Tahir28
Crypto Learner & Market Observer Chart Analysis | Risk Management | Crypto Education Learn First. Manage Risk.
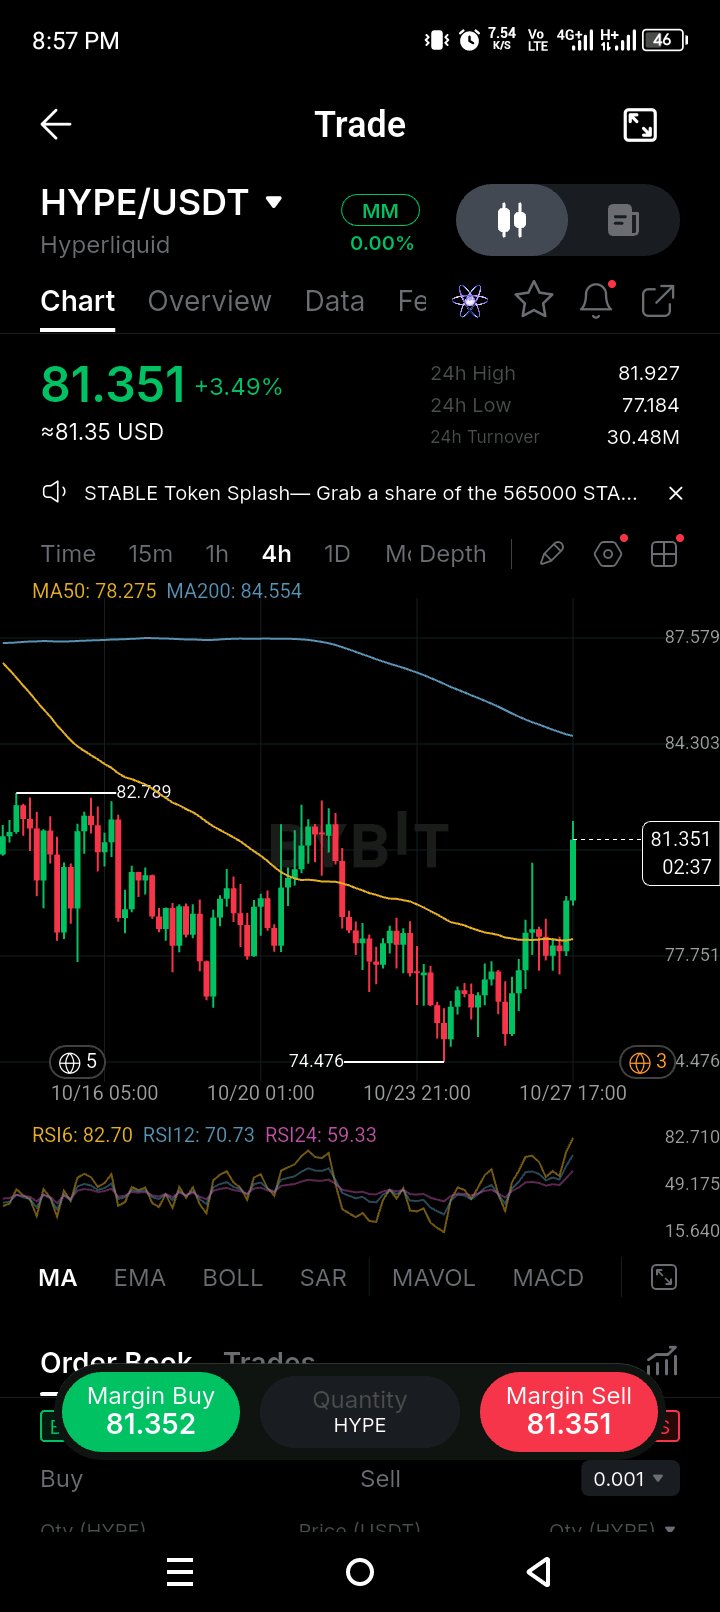
$HYPE JUST MADE A STRONG MOVE!
$HYPEUSDT is trading around $81.35 on the 4H chart, up 3.49% in the screenshot. Here's what I'm watching: 🟢 Bullish: A confirmed breakout above $82.79 could signal further upside. 🔴 Bearish: Rejection at resistance could trigger a pullback toward $78.28 and $77.75. Short-term RSI is elevated, so chasing the pump could be risky. What's next for HYPE — breakout or pullback? #ByXIMPACT $HYPEUSDT #CryptoAnalysis
RIPPLE JUST HIT A MAJOR REGULATORY MILESTONE!
Ripple has reportedly received final approval from the OCC to establish Ripple National Trust Bank. Why does this matter? Federally supervised custody Reserve management for RLUSD More institutional infrastructure for crypto This could mark another important step in connecting traditional finance with digital assets. Do you think institutional adoption will be a major driver of crypto growth? #ByXIMPACT $XRPUSDT #Ripple #CryptoNews

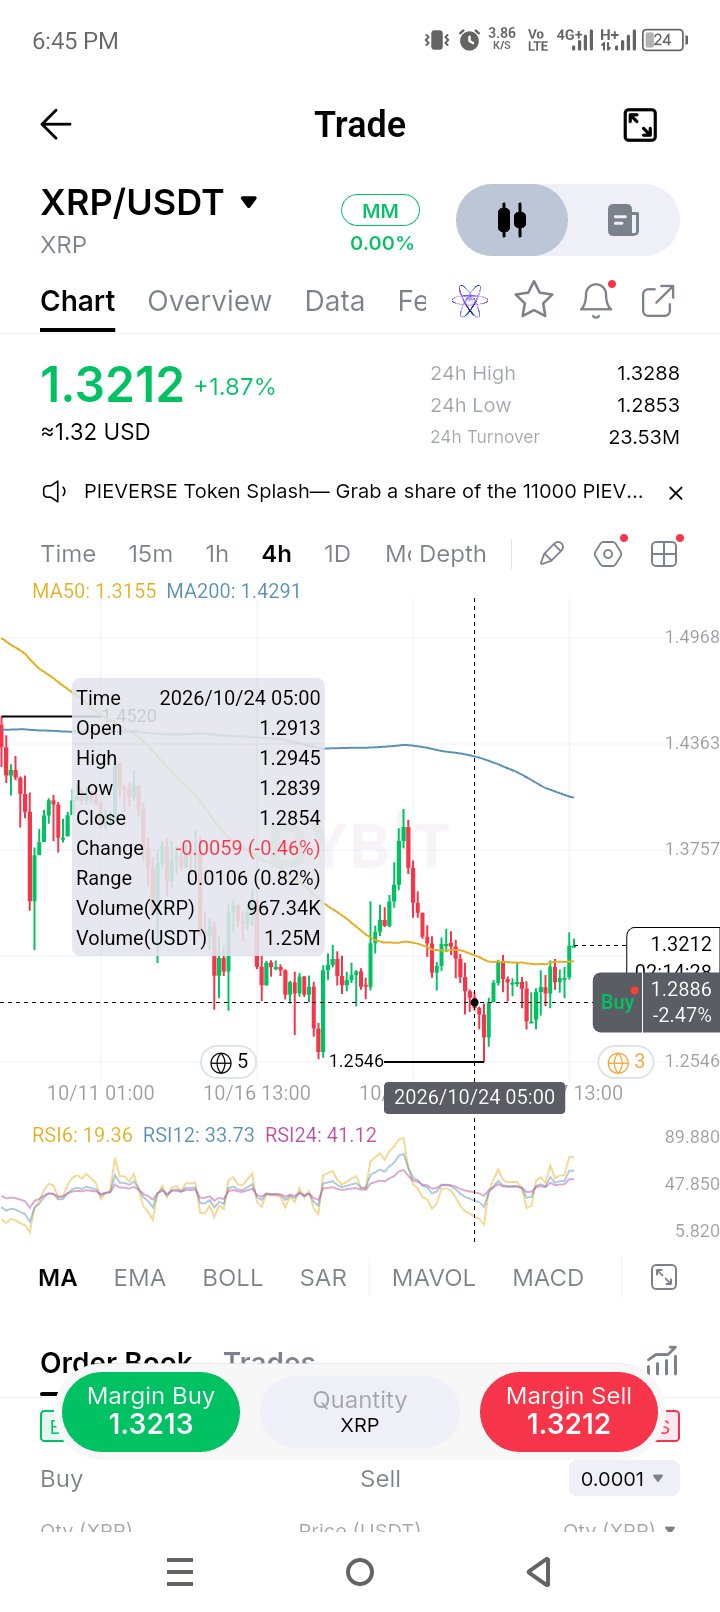
$XRP reclaims its MA50 after an oversold flush
$XRPUSDT reclaims its MA50 after an oversold flush Clean capitulation move here. Steady bleed down to 1.2546, with RSI6 dropping all the way to 19, genuinely oversold, not just a soft dip. That kind of reading usually means selling got rushed, not measured. Since that low, price has climbed back to 1.3212 and just closed above the MA50 (1.3155) for the first time in this whole leg down. RSI6 is recovering fast, now 19 to climbing, while RSI12 (34) and RSI24 (41) are still catching up from below. That lag is normal right after a flush, the short-term indicator always snaps back first. MA200 (1.4291) is still way above and only just starting to flatten, so the bigger trend hasn't turned, this is a bounce off an oversold low testing the first resistance above it, not a reversal call. 1.2546 is the level that matters below, that's the flush low. Hold above the MA50 and this keeps building off it. Lose both and retest 1.2546, the capitulation move wasn't the end, just a pause. Oversold bounces off a real flush tend to have more follow-through than bounces off nothing. Still want to see this hold above 1.3155 for more than a candle before trusting it. #ByXIMPACT $XRPUSDT
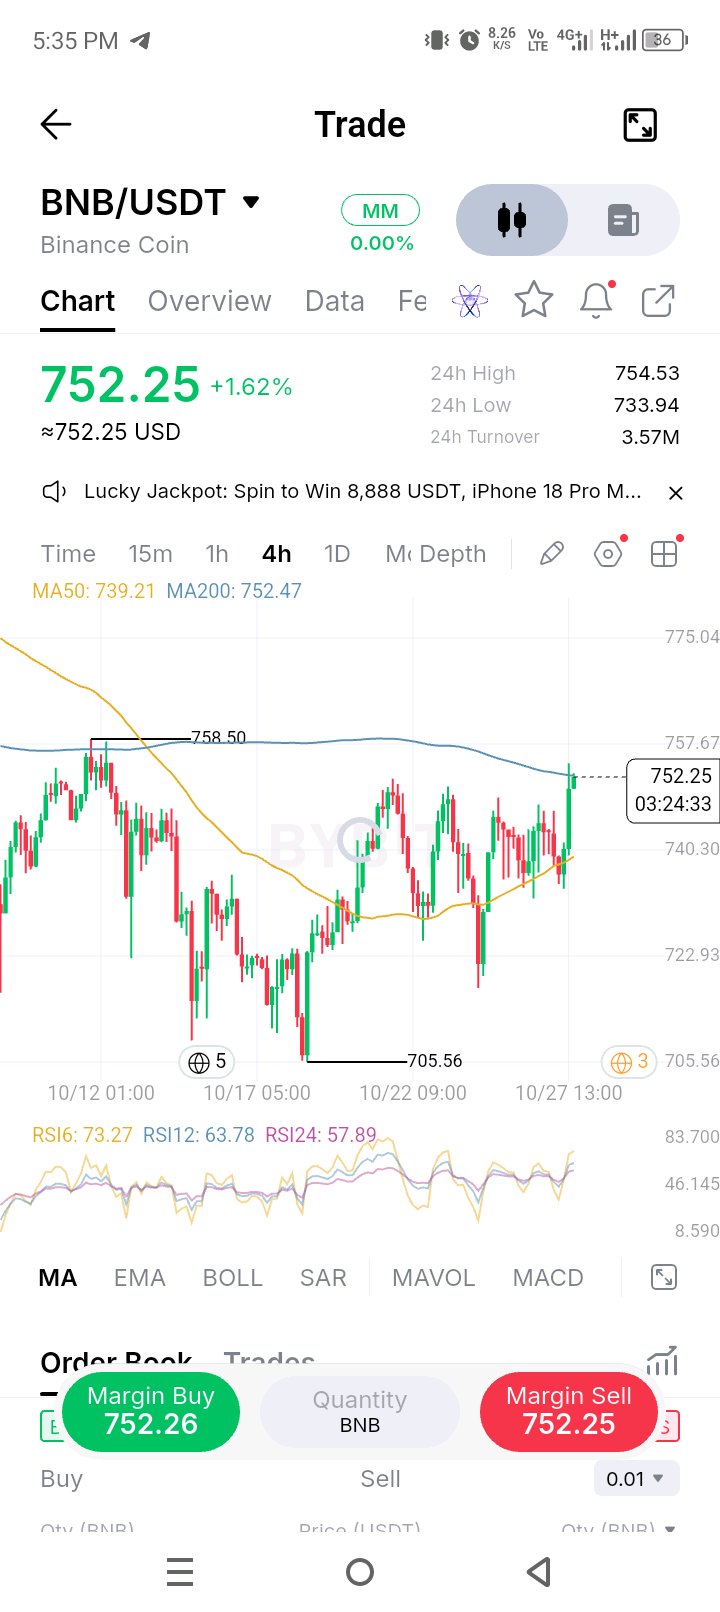
BNB is testing its rejection level.
$BNBUSDT is knocking on its 200-day average right now, this is the level that's decided everything for two weeks Look at the whole range first. 758.50 high, down to 705.56, back up through a messy middle zone, and the entire time, the MA200 (752.47) has basically been a ceiling. Every time price got near it, it got turned away. Right now it's sitting at 752.25, pressed right up against that exact line. The current candle is the strongest push toward it in this whole move, breaking clean above the recent chop between 722 and 758 and closing right at the MA200. That's not nothing, this is the most serious attempt yet at the level that's capped everything so far. RSI6 at 73, RSI12 at 64, RSI24 at 58, all climbing together, no divergence. For a breakout attempt at a key level, that's the kind of alignment you want to see, momentum backing the push rather than price grinding up on fumes. Here's the thing though, it's knocking on the door, not through it yet. 752.47 is still technically resistance until there's an actual close above it. Clear that with conviction and 758.50 becomes the real target, that's the swing high from the start of this whole range. Get rejected here again, like every other test, and it's straight back into the same chop between 722 and 752. This is a binary level. I'd rather see the next 4H candle actually close above the MA200 before assuming it's done, two weeks of rejection at one line deserves one real confirmation candle before trusting it. #ByXIMPACT $BNBUSDT
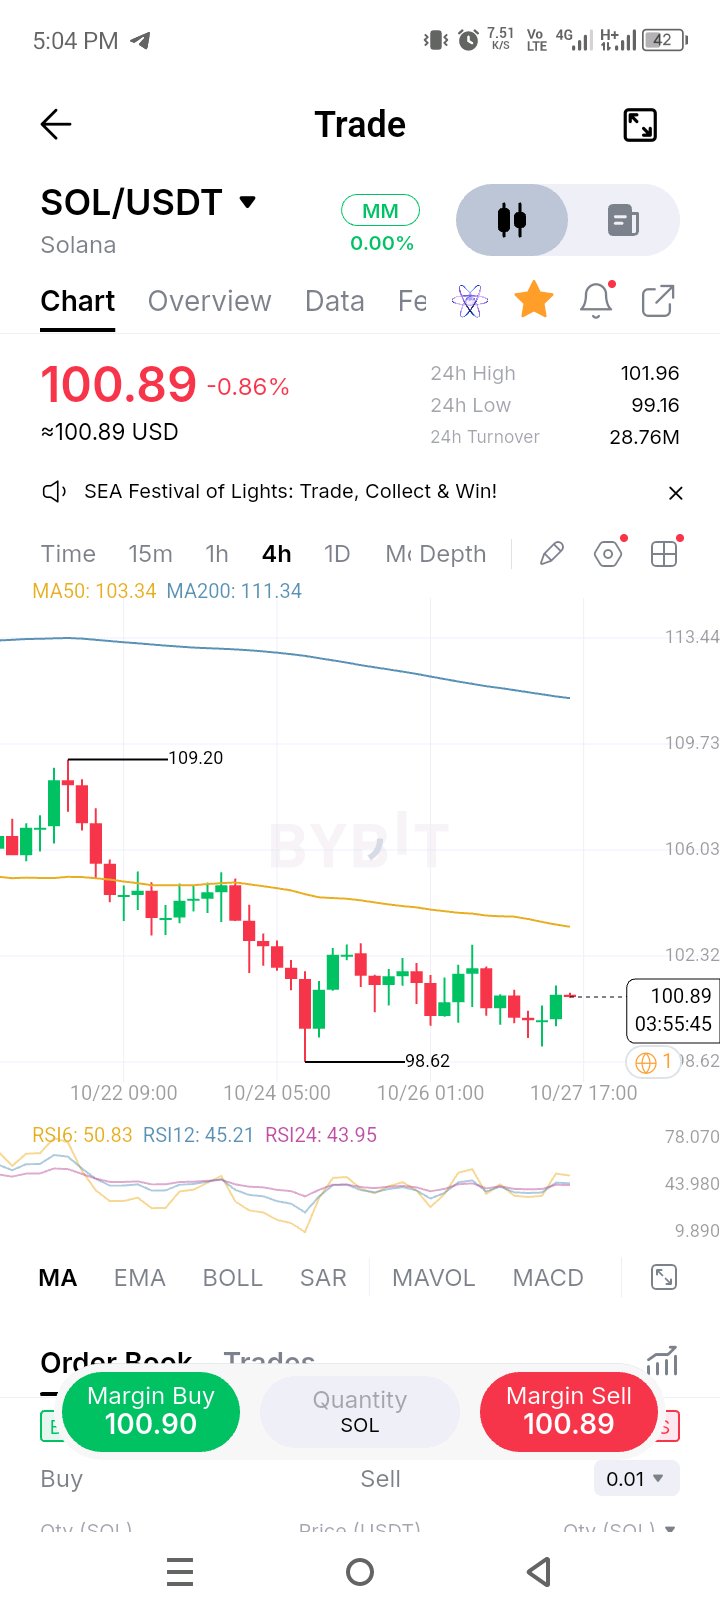
$SOLUSDT is stuck below its MA50 and the bounces keep getting weaker, that's the part worth watching Downtrend that's lost steam, not accelerated. From 109.20 it's been a steady grind down to 98.62, both MAs sloping down the whole way. But look closely at the last couple weeks, each bounce attempt off the lows is getting smaller, less punch than the one before it. That's often what exhaustion looks like before either a real base or one final flush. Price is sitting at 100.89, below the MA50 (103.34) and way below the MA200 (111.34). It's trying to hold above 98.62, the low of this whole leg, but it hasn't done anything to actually challenge the MA50 yet, every bounce is dying well below it. RSI is dead neutral, RSI6 at 51, RSI12 at 45, RSI24 at 44. No divergence, no momentum story either way, it just matches the sideways chop on the chart. This is a market that's tired, not one that's decided anything. 98.62 is the only real level right now. Hold it and this keeps basing, maybe building toward a real low. Break it and there's no structure left until much lower. On the upside, 103.34 (MA50) is what actually needs to break before any of this matters for buyers, until then every green candle is just noise inside the same downtrend. I'm not calling a bottom off fading momentum alone, that's a trap more often than not. I'd want to see this actually reclaim the MA50 before treating any bounce here as real. #ByXIMPACT $SOLUSDT
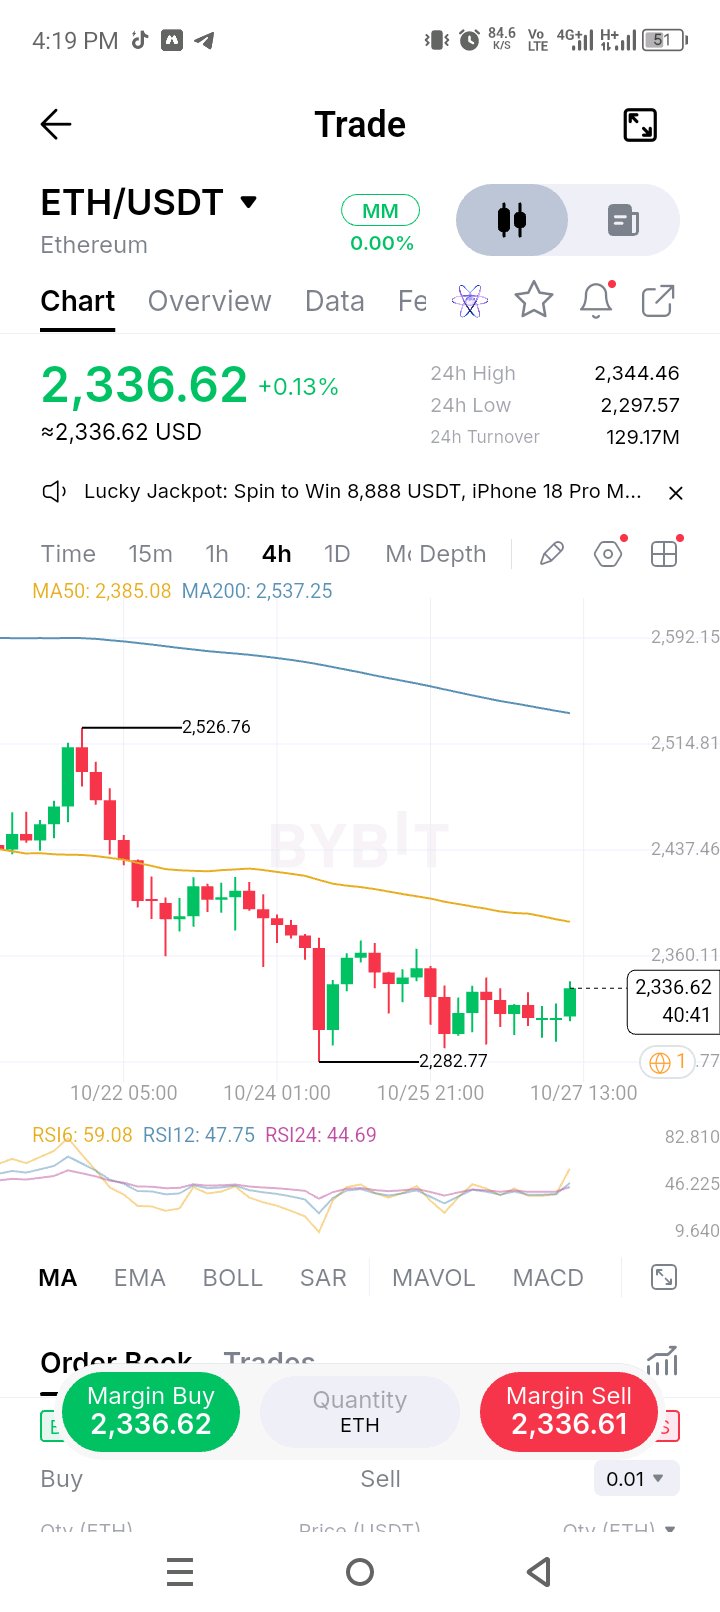
$ETHUSDT bled 10% in days and is now fighting for its life right at the 200-day line Rough stretch here. Dropped from 2,526 down to 2,282, lost both MAs on the way, and it's been chopping in a tight, nervous range ever since, small candles, mixed colors, no real direction. Current price 2,336 is sitting right below the MA50 (2,385), and the MA200 (2,537) is way up and sloping down too, both working against it right now. What's keeping this from looking fully broken is the shape of the last week. After the hard drop to 2,282, it didn't keep bleeding, it's basically flatlined in a tight band, 2,282 to 2,385. That's not strength, but it's also not continued selling, it's indecision. RSI6 at 59, RSI12 at 48, RSI24 at 45, all roughly neutral, no real bias either direction. Matches the price action exactly, this is a market waiting, not deciding. 2,282.77 is the level that actually matters below, that's the low of this whole range. Lose that on a close and this starts looking like real weakness again. Reclaim the MA50 at 2,385 instead, and buyers are starting to win this fight back. Nothing dramatic here yet, just a market parked between two important lines. I'd rather wait for one of them to actually break than guess which way this resolves. #ByXIMPACT $ETHUSDT
NEW TRADFi LISTING ON BYBIT!
Traditional finance meets crypto trading! Bybit has introduced 3 new TradFi Perpetual Contracts: 🔹 $EIDOUSDT 🔹 $EQTUSDT 🔹 $STMUSDT Which of these contracts are you watching closely? Drop your pick in the comments! Always remember: Understand the risk before you trade. #ByXIMPACT #NewFinancialPlatform #TradFi #CryptoTrading

Bitcoin at $80K: A KEY LEVEL TO WATCH
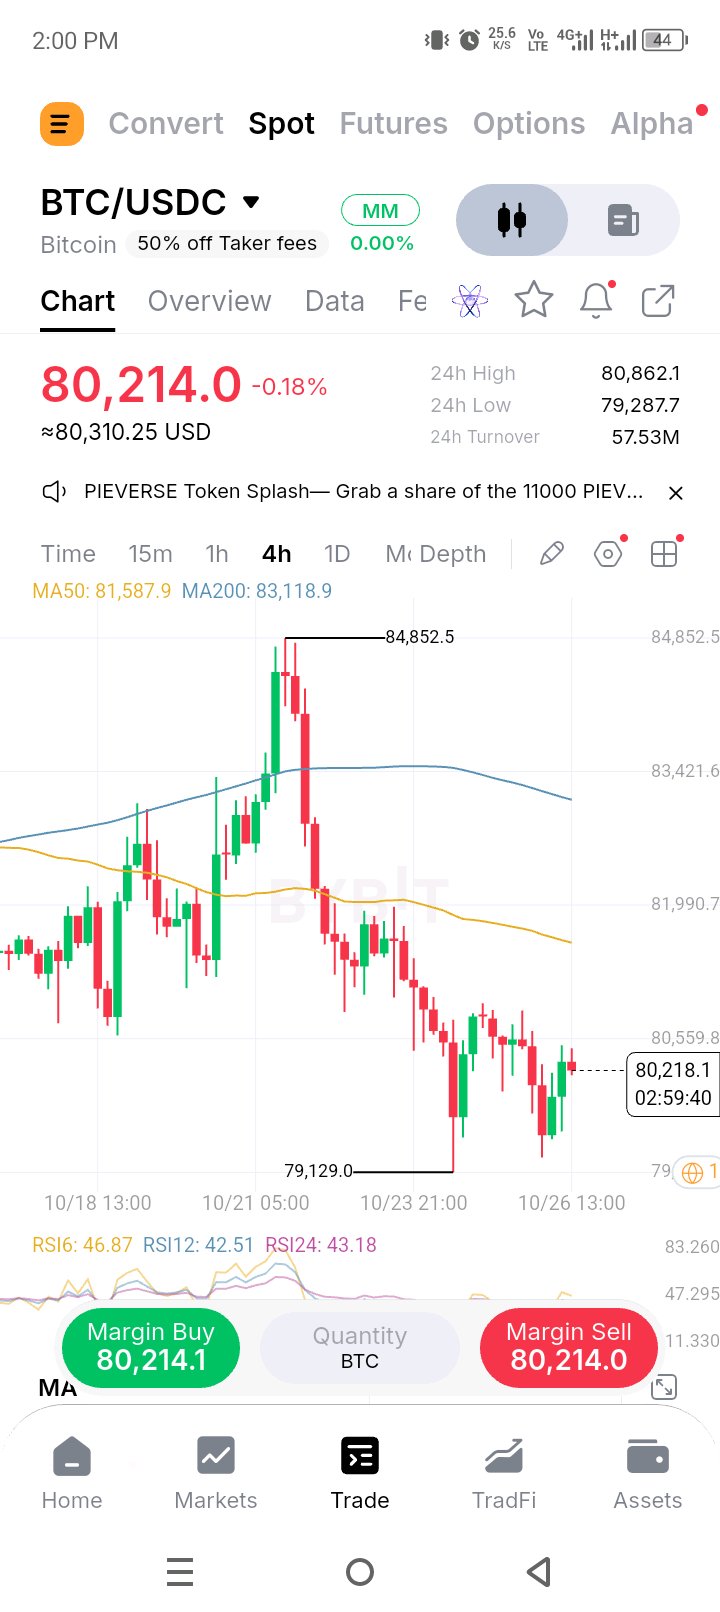
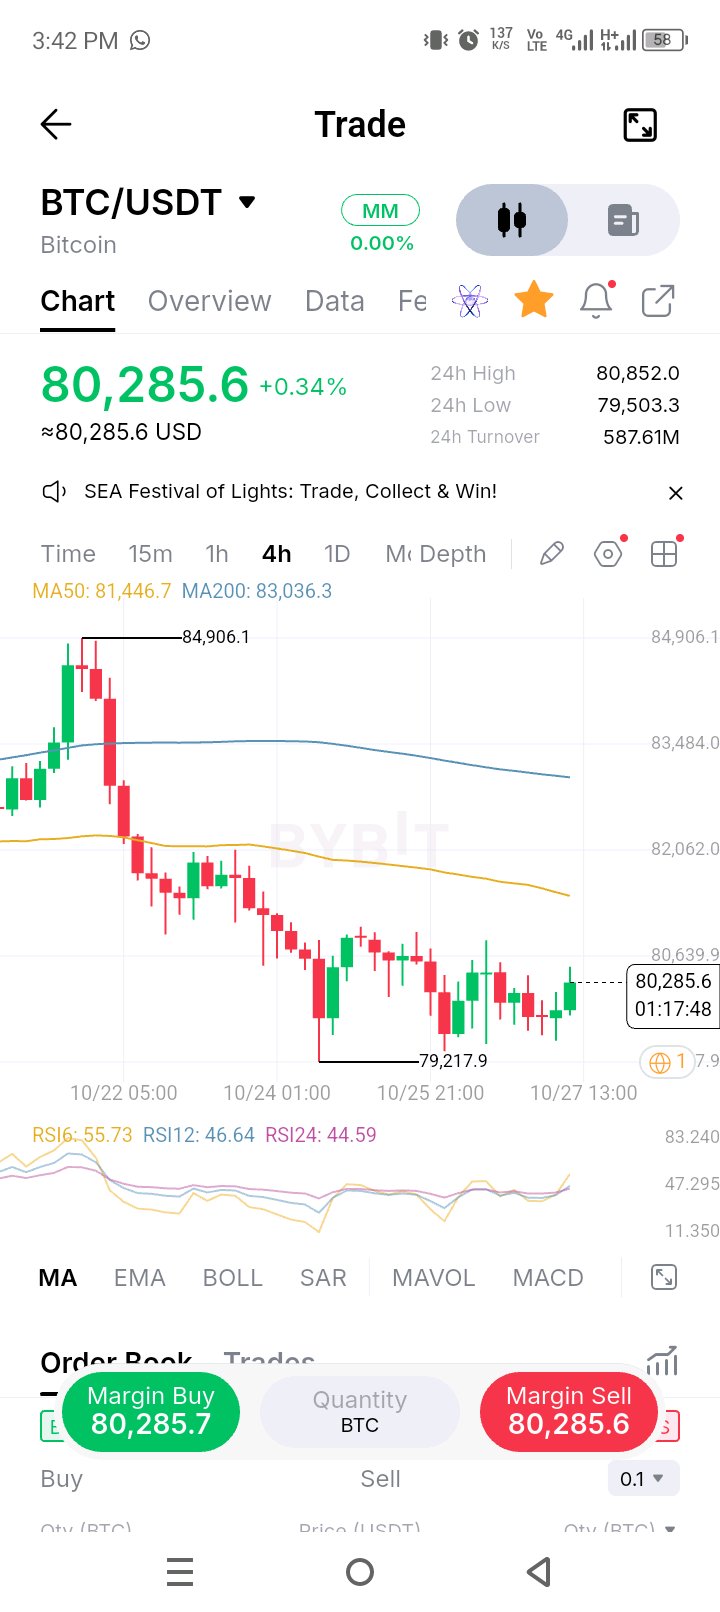
Bitcoin is facing renewed pressure around the $80,000 level as traders watch the Federal Reserve’s October 28 meeting. Macro uncertainty and geopolitical tensions could keep volatility elevated. Here’s what I’m watching: 🔹 Can BTC reclaim $80K and hold above it? 🔹 Or will sellers push the price lower? No outcome is guaranteed. In uncertain markets, protecting capital matters more than chasing every move. What’s your approach this week: staying patient or actively trading the volatility? #ByXIMPACT $BTCUSDT
BTC vs ETH — WHICH ONE LOOKS STRONGER?
Bitcoin is the market leader, while Ethereum has its own catalysts and opportunities. This week, I'm watching price action, key support and resistance, and overall market sentiment before deciding which looks stronger. Your turn: BTC or ETH — which one do you think will perform better this week, and why? #ByXIMPACT $BTCUSDT $ETHUSDT


ETHEREUM OUTLOOK
Can Ethereum show strength against Bitcoin this week? For me, the key is confirmation. A strong move above resistance could improve the outlook, while losing support may bring more selling pressure. No blind predictions. Let's watch the chart. Are you bullish or bearish on ETH? #ByXIMPACT $ETHUSDT
BTC PRICE PREDICTION
Bitcoin is at a critical point this week. If BTC breaks above resistance and holds, we could see a recovery. But if support fails, another pullback may follow. I'm watching the price action before making any trading decision. What do you think comes next? 🟢 Bullish breakout 🔴 More downside Share your view below. #ByXIMPACT $BTCUSDT #CryptoAnalysis

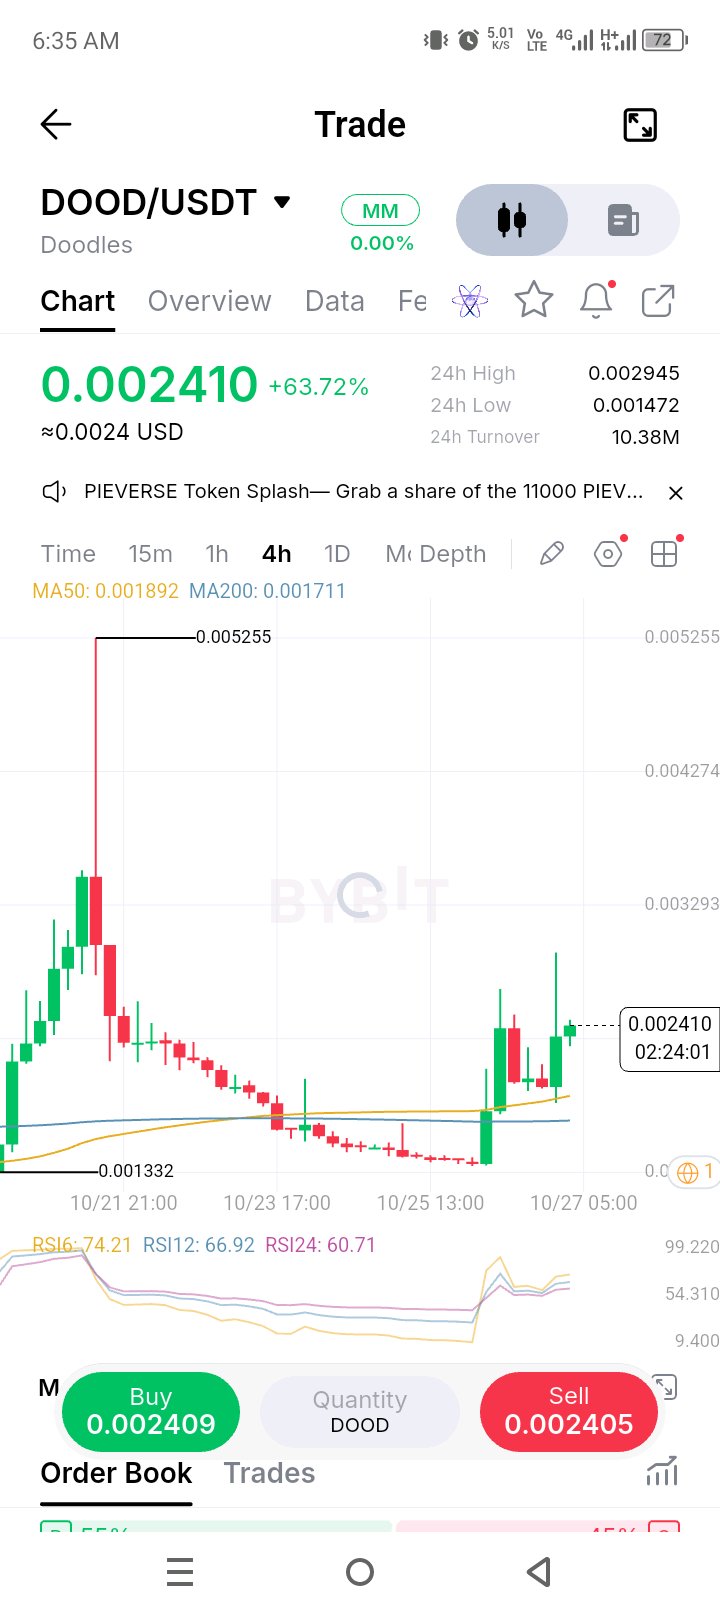
$DOODUSDT is up 63.7% today and broke back above both moving averages after a textbook base Clear structure on this one. Spiked hard to 0.005255, dumped straight down to 0.001332, then spent several days building a quiet base, tight range, low volatility, barely moving, right around the MA50/MA200 crossover zone. That kind of flat, boring consolidation after a crash is usually when the real move is being built. Today it left the base. A big green candle, then a pullback, then another strong green pushing to 0.002410, now trading clean above both MA50 (0.001892) and MA200 (0.001711) for the first time since the original dump. Reclaiming both averages in the same move is a stronger signal than just clipping one of them. RSI6 at 74, RSI12 at 67, RSI24 at 61, all elevated and climbing together. Hot, but this is a breakout day off a multi-day base, some heat here is expected and not automatically a red flag the way it would be on a chart that's already extended for weeks. 0.001332 is the origin low, miles below and not really relevant unless this completely fails. The level that actually matters now is the MA50/MA200 zone around 0.0017-0.0019, hold above that on any pullback and this breakout stays intact. The real resistance above is 0.003293, the next technical level before this starts challenging the original spike zone. Breakouts off quiet, multi-day bases tend to have more follow-through than breakouts off nothing, since the chop usually means real accumulation happened first. Still want to see one pullback hold the reclaimed MAs before fully trusting it though. #ByXIMPACT $DOODUSDT
$ETHUSDT Weekly Analysis $ETH closed above the 1W MA50 for the 6th time, despite BTC Dominance surging above 60% and uncertainty across global markets. It is still stuck between $2,300 and $2,800, testing both bulls and bears before its next big move. The weekly Stoch RSI is showing bearish momentum, so another shakeout is possible if ETH loses $2,300. Key levels: - Support: $2,300. Lose it, and $1,900 is next. - Resistance: $2,550 and $2,800. #ByXIMPACT $ETHUSDT
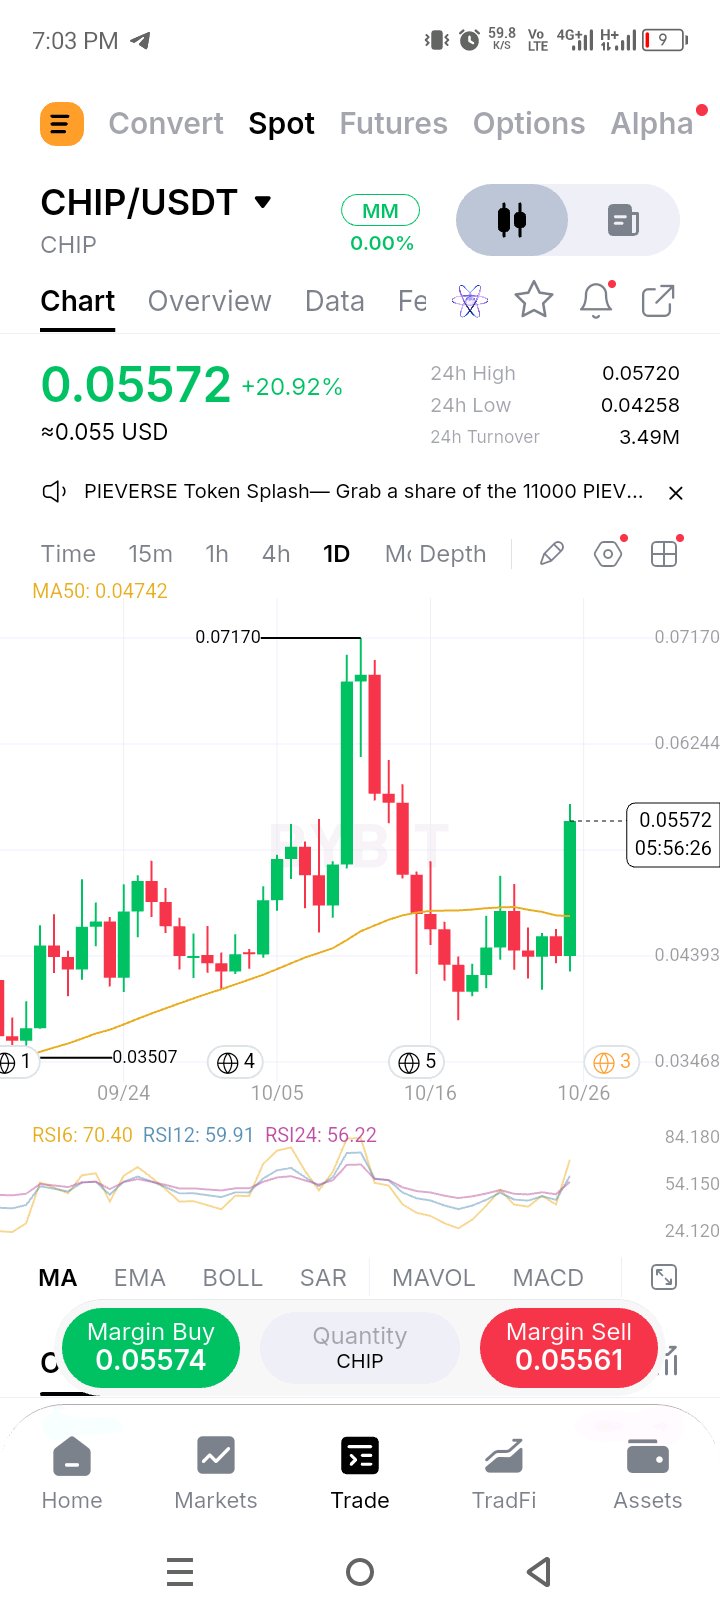
$CHIPUSDT just erased three weeks of post-spike bleeding in a single daily candle Here's the full arc: based between 0.035 and 0.047 for about two weeks, spiked hard to 0.0717, then gave almost the entire move back over the following two weeks, grinding down to the low 0.04s, right back toward where the base started. That round trip looked like the whole move was dead. Today says otherwise. +20.92%, a big green daily candle breaking clean back above the MA50 (0.04742) after being stuck under it since the spike faded. That's the first real reclaim since this thing topped out, and it's not a small poke, it's a decisive close. RSI6 jumped to 70, RSI12 to 60, RSI24 to 56, all climbing together without any divergence. For a coin that spent weeks drifting lower under its MA50, this kind of synchronized RSI push is the first real sign buyers are back in control rather than just a short-lived squeeze. 0.03507 is the original base low, far below and not really relevant unless this completely fails again. The level that actually matters now is the MA50 itself at 0.04742, hold above it on the next close and this looks like a genuine second leg starting. The real test above is the 0.0717 high, that's where the first attempt died, and it's the level that decides if this is a new trend or just a strong relief bounce back into old resistance. One huge green candle after weeks of bleeding deserves respect, but it also deserves a retest before fully trusting it. I'd want to see a pullback hold above the MA50 before treating this as more than a sharp reaction move. #ByXIMPACT $CHIPUSDT
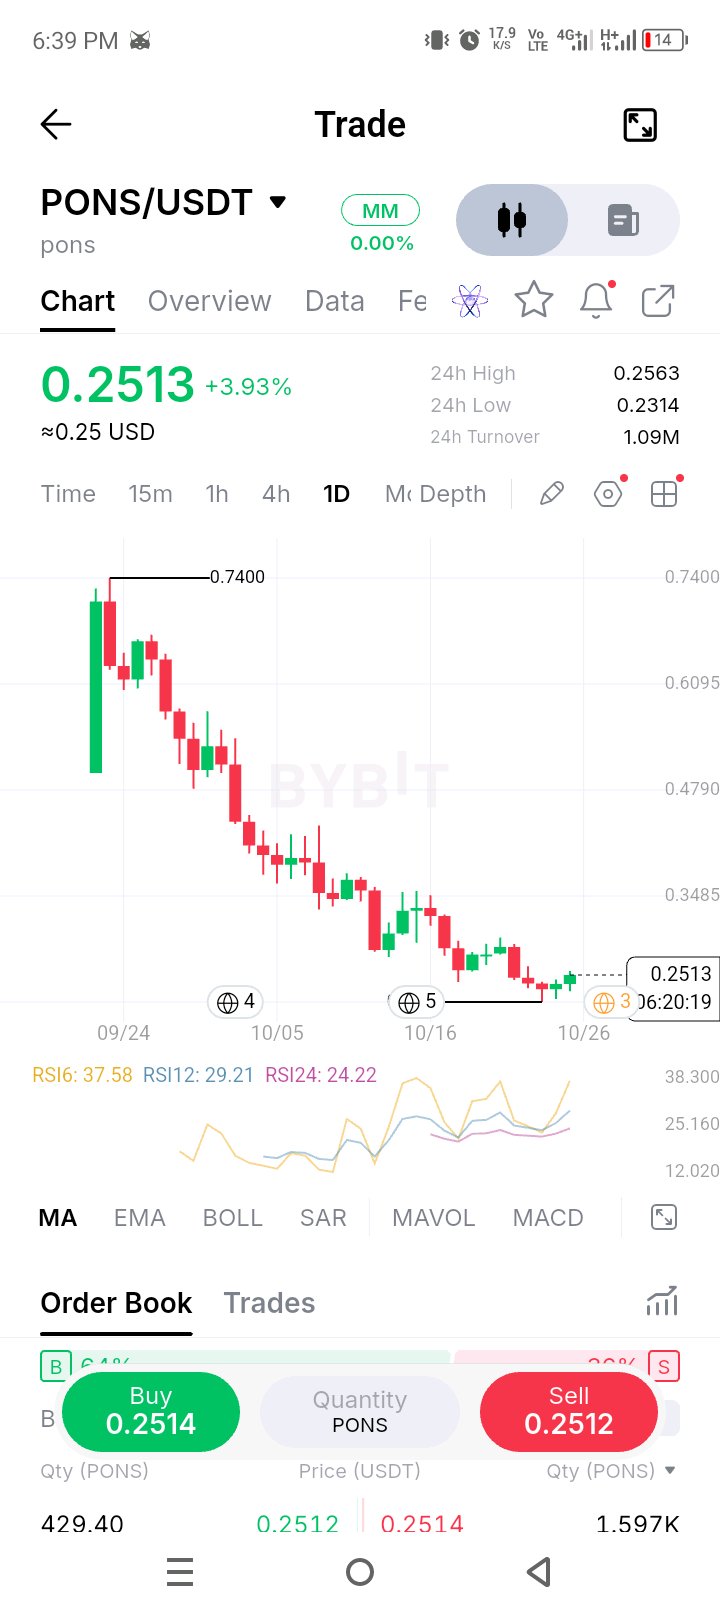
$PONSUSDT is down roughly 66% from its listing spike and finally showing its first green stretch This is a brutal chart, worth being honest about. From the launch spike at 0.74, it's been almost uninterrupted red for over a month. Lower highs, lower lows, barely any real bounces along the way, all the way down to 0.2314. That's close to a 70% drawdown from the top with no real relief in between. The only thing that's changed recently is the last few daily candles. Small greens appearing, price lifting off the lows to 0.2513, up 3.93% today. After a month of nothing but red, even a few green closes stands out, but it's a small sample against a very long downtrend. RSI tells the honest story here. RSI6 at 37, RSI12 at 29, RSI24 at 24, all still deep in oversold territory despite the recent bounce. That actually fits, this isn't a reversal yet, it's the kind of RSI level where dead-cat bounces live. Oversold can mean "due for a bounce" or it can mean "still falling," price action has to confirm which one this is. No real moving averages to lean on yet since this coin doesn't have enough history for a meaningful MA50/MA200 read at this stage, so I'm working off raw structure. 0.2314 is the low, that's the only real line in the sand right now. Above, there's no resistance history yet besides the recent highs around 0.26-0.35 from the slower part of the bleed. I wouldn't read a few green daily candles after a 70% crash as a trend change. It's the first sign of life, nothing more, worth watching whether it can actually build a base above 0.2314 or whether this was just a dead-cat bounce inside a much bigger downtrend. #ByXIMPACT $PONSUSDT
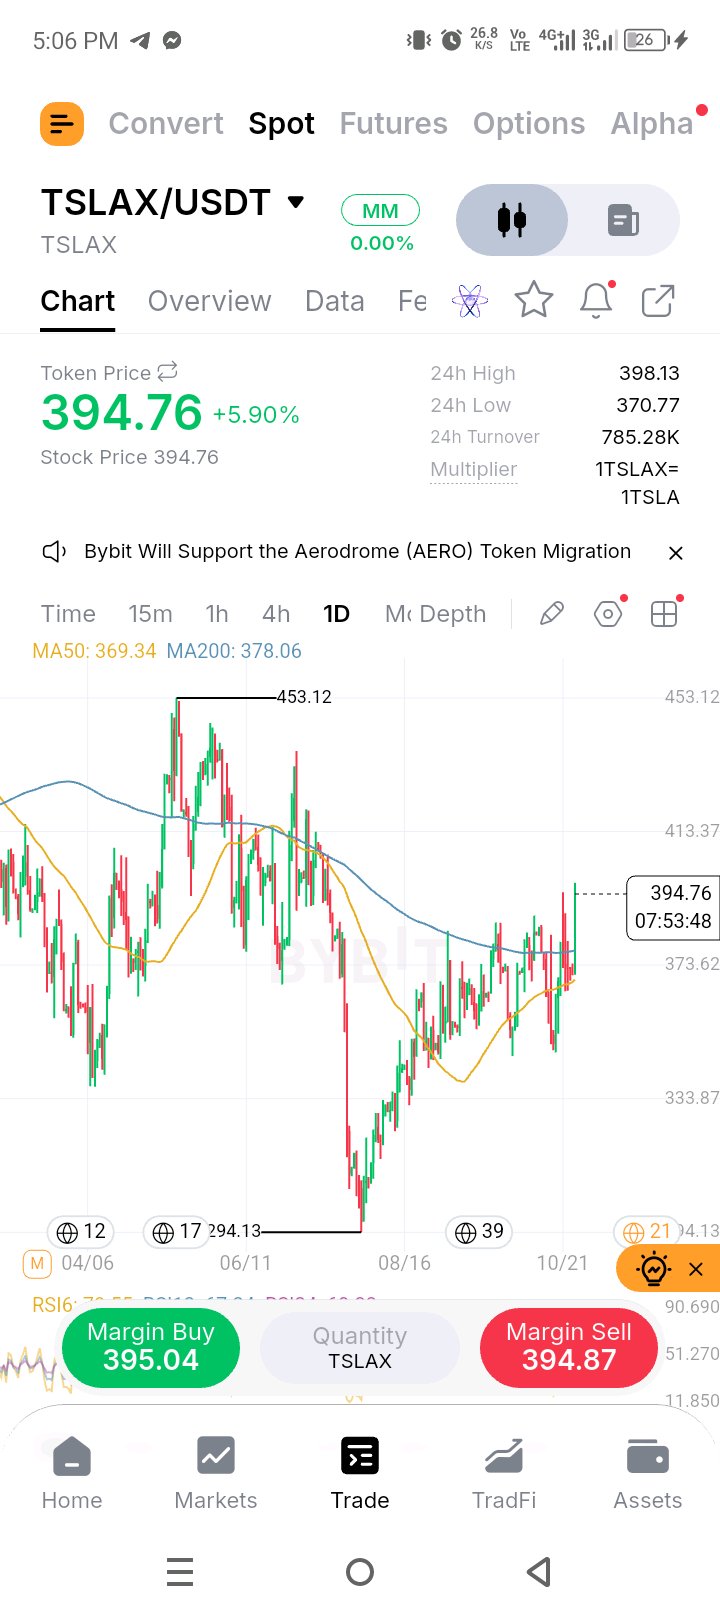
$TSLAXUSDT just reclaimed its MA200 after basing for nearly three months, this is the real structural test Big picture on this one: topped at 453, crashed hard down to 294, then spent from mid-August through late October just building a base, higher lows the whole way, grinding back up underneath both moving averages. Today it's up 5.90%, pushing to 394.76 after a strong green daily candle, and it just closed back above the MA200 (378.06) for the first time since the crash. That's the headline here. Reclaiming the 200-day average on a daily chart after a multi-month base isn't a minor technical footnote, it's usually the level institutional-style money actually watches. Price has been below it for months, now it's not. The shape of the base matters too. From the 294 low, this wasn't a V-shaped snap back, it was a slow, patient climb with the MA50 (369.34) curling up underneath the whole time. That's a healthier recovery pattern than a sharp spike, it suggests steady accumulation rather than a short squeeze. Today's candle is also the biggest green body in weeks, breaking clean above the recent chop between 333 and 373. Real conviction on the move, not just drifting higher on thin volume. 369.34 (MA50) is the first support if this pulls back, that's close to today's breakout zone. The MA200 at 378.06 is the second line, if price falls back under that, today's reclaim gets questioned. Above, 413.37 is the next real resistance before this is challenging the 453 high again. This is a tokenized equity, not a typical crypto chart, so I'd treat the daily close more seriously here than an intraday wick. Want to see this hold above 378 on the next close before trusting the reclaim is real. #ByXIMPACT $TSLAXUSDT
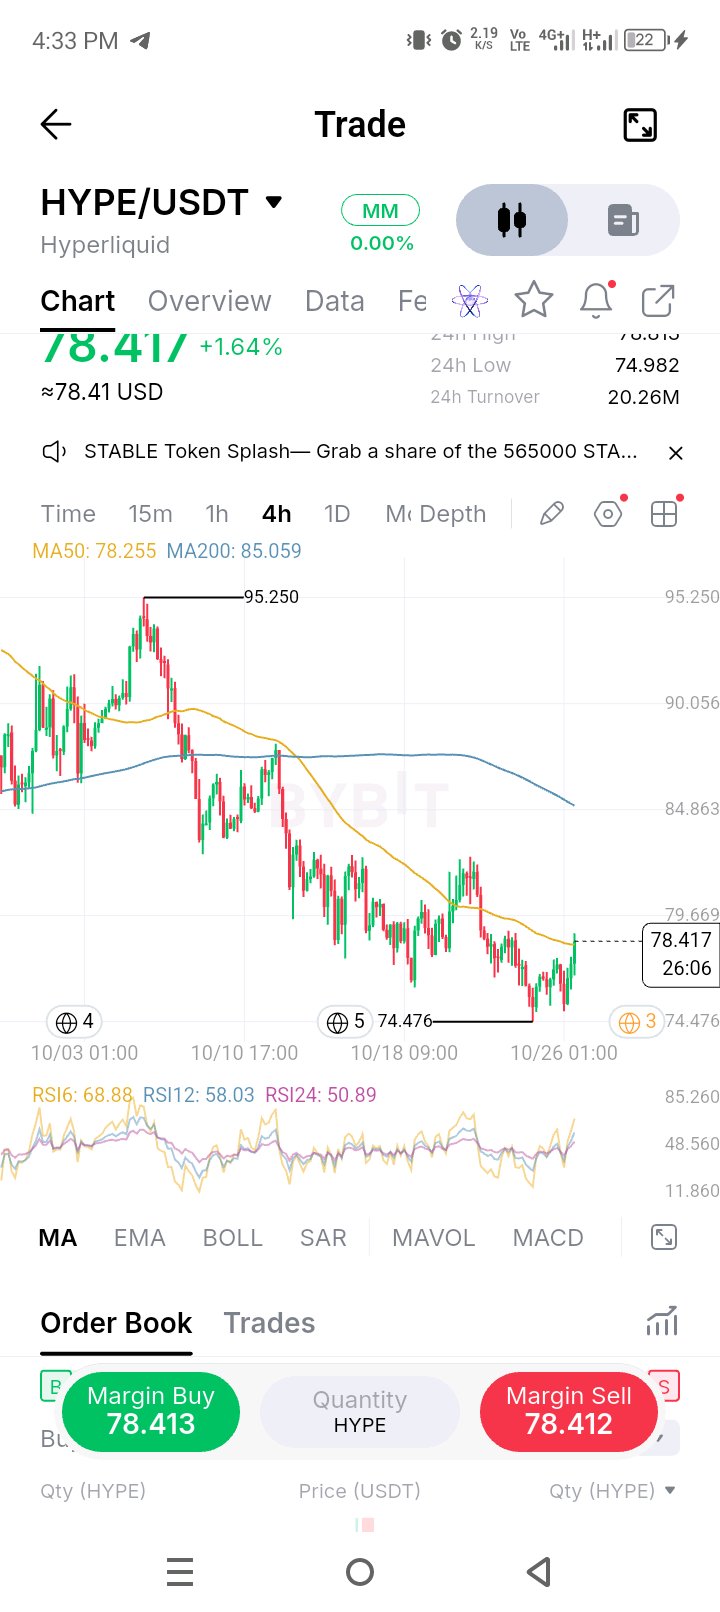
$HYPEUSDT has been grinding lower for three weeks straight and just poked above its MA50 for the first time in that whole stretch Long, grinding downtrend here, not the sharp kind. Topped near 95.25, then it's been a slow staircase down for close to three weeks, lower highs, lower lows, both MAs rolling over the entire way, all the way to 74.476. That's a patient bleed, the kind that wears people out more than it scares them. The last handful of candles are the first real change. Price pushed up through the MA50 (78.255) and is sitting at 78.417, the first close above that average since early in this downtrend. On a chart that's been this persistently bearish, that's worth noting even if it's early. RSI6 jumped to 69, RSI12 to 58, RSI24 to 51, all three lifting together. Momentum is turning up in agreement with price, not diverging, which is a better sign than a bounce where RSI stays flat while price pokes higher. MA200 (85.059) is still way above and still sloping down hard, so the bigger trend is firmly intact, this isn't a reversal call. It's a reclaim of the shorter-term average inside a longer downtrend, worth tracking, not worth assuming it's over. 74.476 is the level that actually matters below, that's the low of this entire three-week slide. Hold above the MA50 and build from here, and the next real test is the MA200 far above. Lose 74.476 again and the grind just continues. Early stage stuff. I'd want to see this hold above 78.255 for more than a candle or two before trusting it over just chasing the bounce. #ByXIMPACT $HYPEUSDT
Big week ahead for the markets! From the US Federal Reserve's interest-rate decisions to earnings reports from major tech companies, several factors could influence market sentiment this week. My focus isn't just on finding opportunities—it's also on managing risk. Before entering any trade: 🔹 Watch how the market reacts to major news. 🔹 Avoid chasing sudden price movements. 🔹 Define your risk before entering a position. What's your priority this week: finding opportunities or protecting capital? #Bybit #RiskManagement #ByXIMPACT

Protecting capital is just as important as finding a good trading opportunity. Before entering any trade, understand how much you can afford to lose, calculate your position size, and plan your exit. Even a strong setup can fail. Risk management won't eliminate losses, but it can help prevent one bad trade from damaging your entire portfolio. Remember: survival in the market comes before chasing profits. How do you manage risk when the market becomes unpredictable? #CryptoEducation #ByXIMPACT

$TRUMP is holding above its MA50 after bottoming at 1.618, small base forming right where it needs to Clear downtrend before this, topped at 1.922, straight lower highs and lower lows all the way down to 1.618. Classic bleed, both MAs rolling over the whole way down, nothing to argue with there. What's changed the last several candles is it's stopped making new lows. It's been chopping in a tight band around 1.618-1.694, and now it's pushed up to 1.667, closing back above the MA50 (1.660) for the first time in this entire leg down. That's a small thing on its own, but it's the first structural change since the top. RSI6 at 63, RSI12 at 56, RSI24 at 50, all three climbing and roughly in agreement, no divergence. Momentum is turning up gently alongside price, which fits a basing read better than a dead-cat bounce. MA200 (1.728) is still well above and still sloping down, so the bigger trend hasn't flipped, this is still technically inside a downtrend until proven otherwise. But 1.618 is now the level that defines whether this base holds, lose that and the downtrend just continues. Hold above the MA50 and build from here, and 1.770-1.846 (the old consolidation zone) becomes the real test of whether this turns into something bigger. Small, early signs here, nothing confirmed. I'd want this to hold above 1.660 for a few more candles before treating it as more than just a pause in the downtrend. #ByXIMPACT $TRUMPUSDT