Diamond
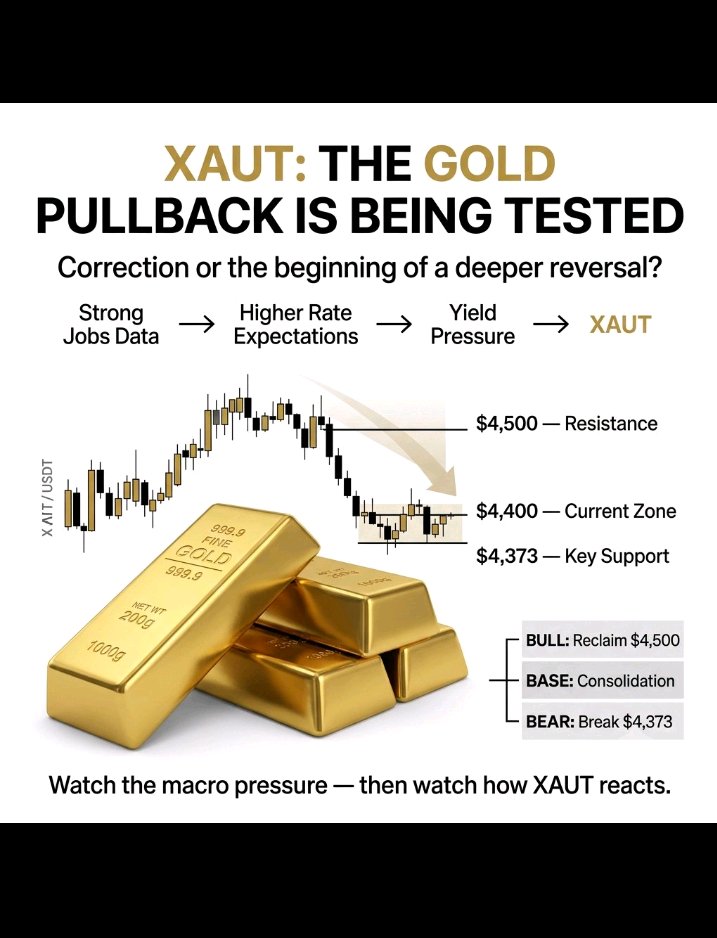
🟡 XAUT: What If You Could Own Gold Without Holding a Gold Bar? Gold has always been a store of value. But what happens when you combine physical gold with blockchain technology? That’s where Tether Gold ($XAUT) comes in. Each XAUT token represents 1 fine troy ounce of physical gold, giving crypto users exposure to gold while keeping the asset transferable on-chain. Why is XAUT interesting? 🔸 1 XAUT = 1 oz of gold Its price is designed to follow the value of physical gold. 🔸 Blockchain-powered ownership Instead of storing a gold bar yourself, you can hold gold exposure in a digital token. 🔸 Fractional access You don’t need to buy an entire gold bar. XAUT can be divided into very small amounts. 🔸 A potential hedge When crypto markets become extremely volatile, some traders look toward gold-backed assets as a way to diversify risk. 🔸 DeFi potential Tokenized gold can also interact with parts of the crypto ecosystem, creating use cases that physical gold alone cannot easily provide. But there’s an important side to the story 👇 XAUT is not risk-free. You still have to consider issuer/counterparty risk, regulation, custody of the underlying gold, and smart-contract or blockchain-related risks. So the bigger question isn't simply: “Is XAUT going up?” It’s: “Can tokenized gold become a major bridge between traditional finance and crypto?” 📊 My view: XAUT is one of the more interesting examples of how real-world assets are moving onto the blockchain. 🔥 What would you choose today? A) BTC — Digital Gold B) XAUT — Tokenized Physical Gold C) Both — Diversification Drop A, B, or C below and tell me WHY. 👇 #ByXIMPACT
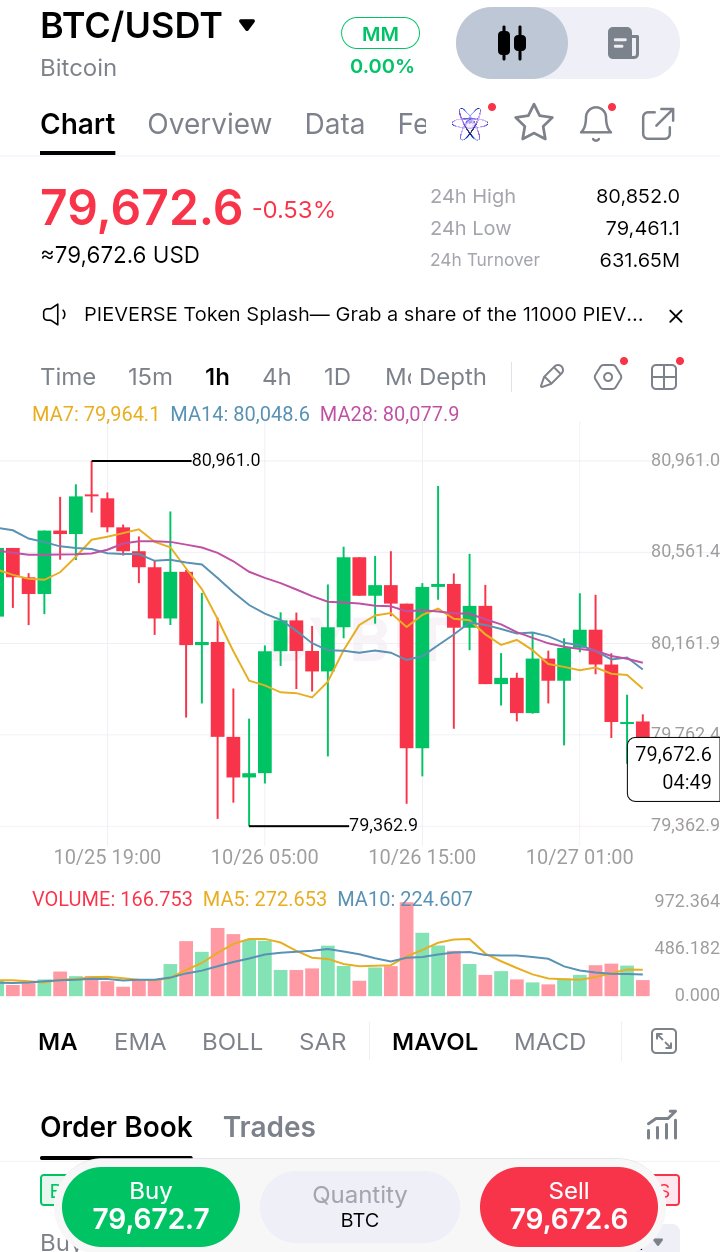
$BTCUSDT Is Sitting at a Critical Decision Zone — What Happens Next? 👀 Bitcoin is currently trading around $79.67K, down roughly 0.53%, after struggling to maintain momentum above the $80K area. Looking at the 1H chart, BTC is currently trading below all three short-term moving averages: 📊 MA7: $79.96K 📊 MA14: $80.05K 📊 MA28: $80.08K This tells me that short-term momentum is still slightly tilted toward the bears. However, the market is now approaching an important support zone, so the next few candles could determine the short-term direction. 🔑 Levels I'm watching 🟢 Support: $79.36K This is the recent swing low. If buyers defend this level, BTC could attempt another recovery toward $80K. 🔴 Resistance: $80.00K–$80.08K BTC needs to reclaim this area and hold above it to show that buyers are getting back in control. 🚀 Bullish scenario: If BTC reclaims $80K with strong volume, the next area I would watch is around $80.56K, followed by the recent high near $80.96K. ⚠️ Bearish scenario: If BTC loses $79.36K, especially with increasing selling volume, the current short-term weakness could accelerate and open the door to lower levels. For now, I don't think the best question is simply “bullish or bearish?” The real question is which level breaks first. $80K reclaim or $79.36K breakdown? 👇 I'm watching the reaction around these two levels closely. What is your call — 🚀 BULLISH or 🔻 BEARISH? And what price do you expect BTC to hit next? #ByXIMPACT

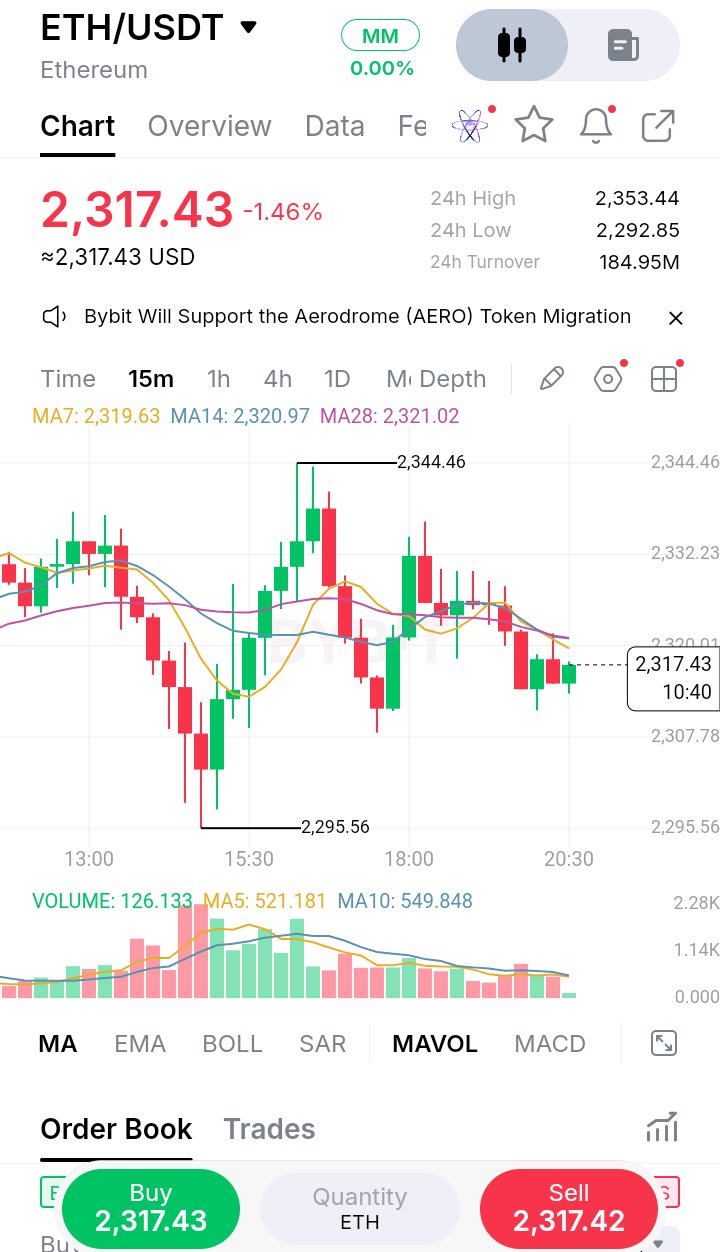
⚡ $ETHUSDT is sitting at a critical level! ETH is currently around $2,317, trading just below the short-term MAs on the 15M chart. 📍 Resistance: $2,325–$2,330 → $2,344 📍 Support: $2,307–$2,300 → $2,295 A clean break above $2,330 could send ETH back toward $2,344. But if $2,300 fails, I’d be watching $2,295 next. 👀 What’s your call? 🚀 BREAKOUT above $2,330 or 🐻 DROP below $2,300? Drop your ETH prediction below 👇 #ByXIMPACT
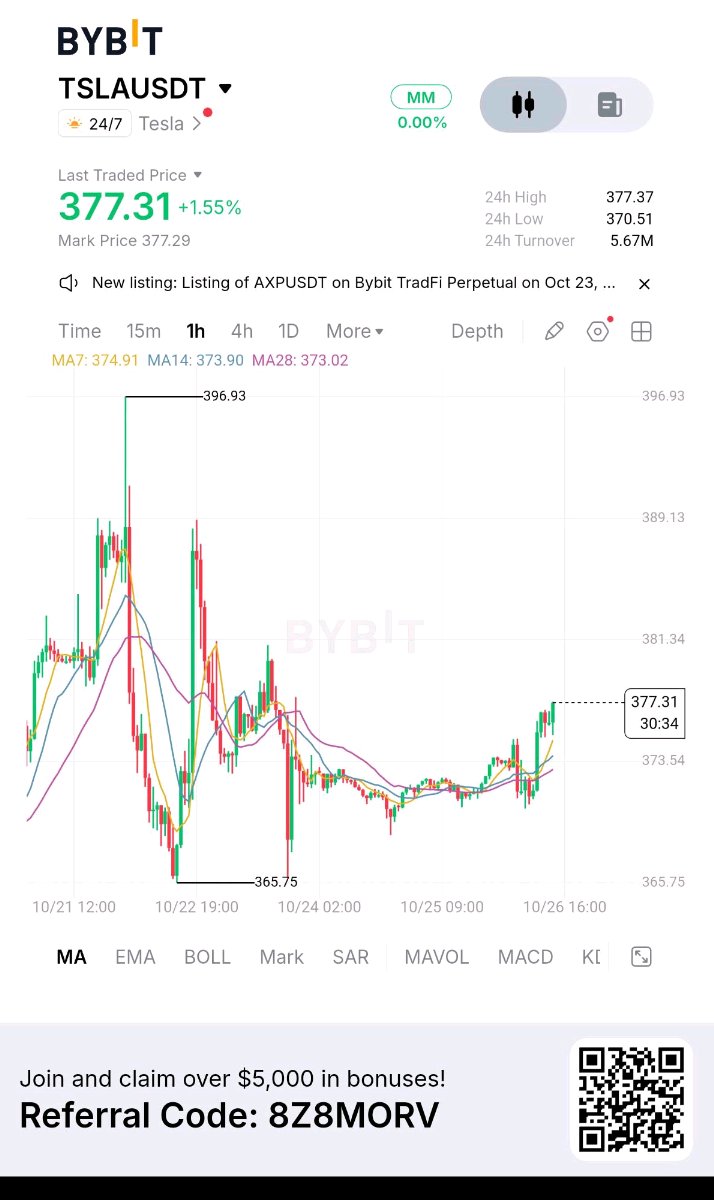
🚨 $TSLA IS MOVING — CAN YOU PREDICT WHERE IT CLOSES? 👀 Tesla is showing a ~$22 trading range today: 📈 24H High: $382.50 📉 24H Low: $360.50 Now the real question: 🎯 Where do you think $TSLA will close today? Drop your exact closing-price prediction in the comments 👇 🔥 $370? $375? $380+? Let’s see who can call it right! 👀 🎁 2 correct predictors will get a follow from the official ByX account! Think you can nail the next move? 👉 Explore Crypto, Esports & Sports Predictions on ByPick. #ByXIMPACT

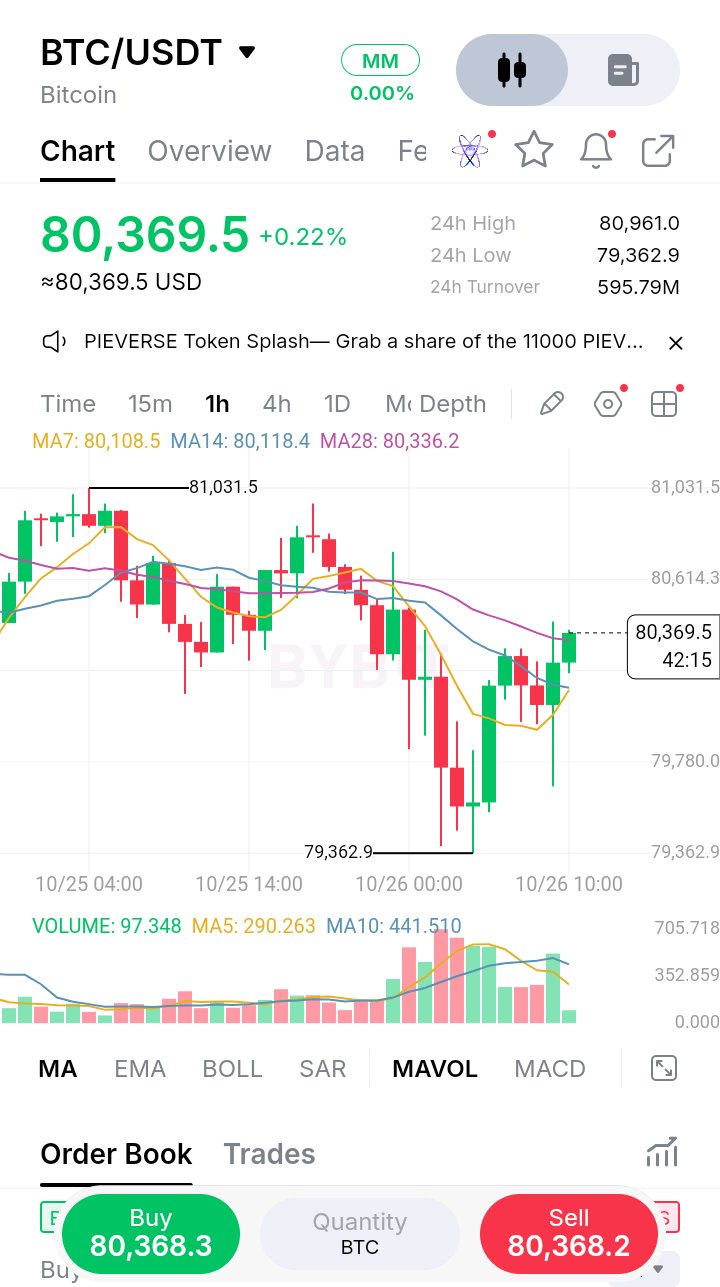
🚨 $BTCUSDT IS AT A CRITICAL LEVEL — WHAT COMES NEXT? Bitcoin is currently trading around $80,369, recovering after a sharp dip to $79,362 on the 1H chart. The bounce has pushed BTC back above its short-term moving averages, suggesting that buyers are starting to regain control. 📈 🔑 Key Levels to Watch: • Support: $79,362 • Current: $80,369 • Resistance: $80,961–$81,031 💡 Bullish Scenario: If BTC holds above $80,300 and breaks through $81,000, we could see stronger upside momentum. ⚠️ Bearish Scenario: If BTC loses the $80,000 area and fails to hold the moving averages, another retest of $79,362 could be on the table. 🔥 My take: BTC is showing a recovery, but the $81K breakout is the key confirmation. Until then, I'm watching the reaction around $80K closely. What do you think? 👇 🚀 BREAK $81K 📉 RETEST $79K 🤔 RANGE AROUND $80K #ByXIMPACT
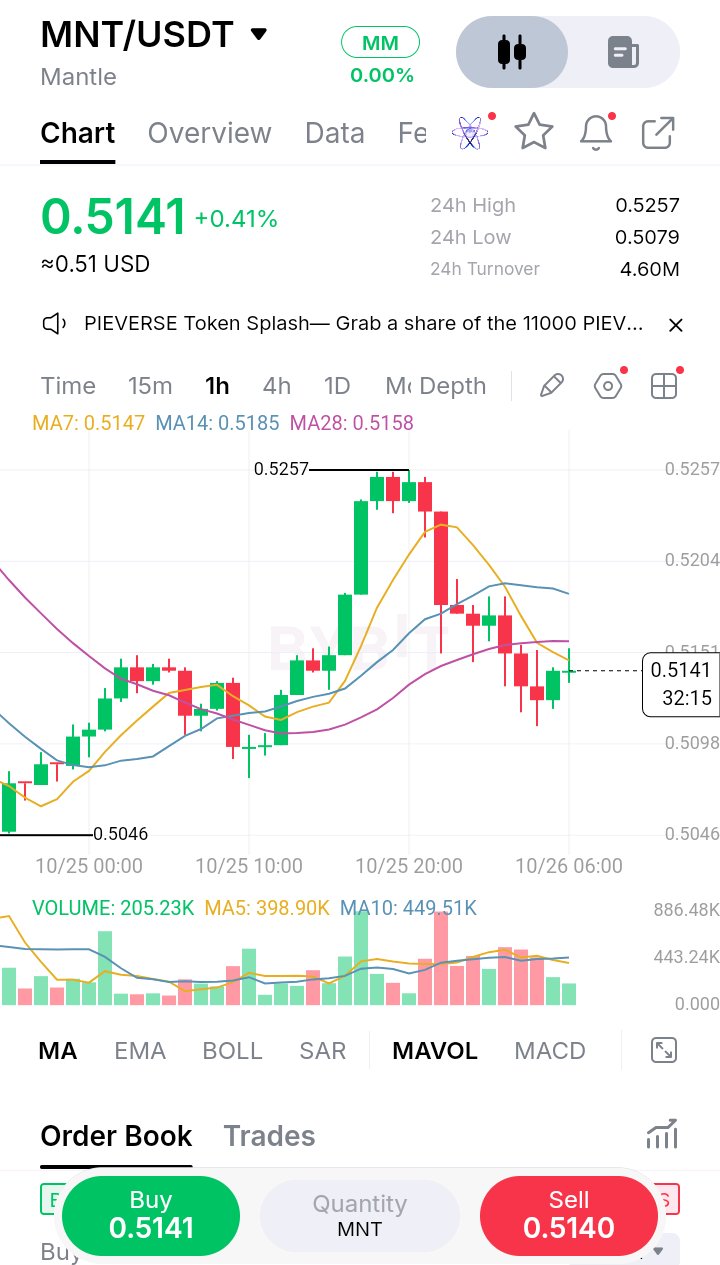
🚨 $MNTUSDT is sitting at a critical level right now. After pushing up to $0.5257, MNT has pulled back and entered a tight consolidation around $0.5141. Here are the levels I’m watching 👇 🟢 Bullish setup: A strong move above $0.5185–$0.5204 with increasing volume could put $0.5257 back in play. Break $0.5257 → the next upside move could accelerate. 🔴 Bearish setup: If MNT loses $0.5079, sellers could push price toward the stronger $0.5046 support. 📊 Right now, volume is cooling off — which makes the next breakout especially interesting. My question for the MNT community: 🔥 Do you think $MNT breaks $0.5257 first, or do we see another pullback below $0.5080? Drop your target below 👇 Bullish 🟢 or Bearish 🔴? #ByXIMPACT
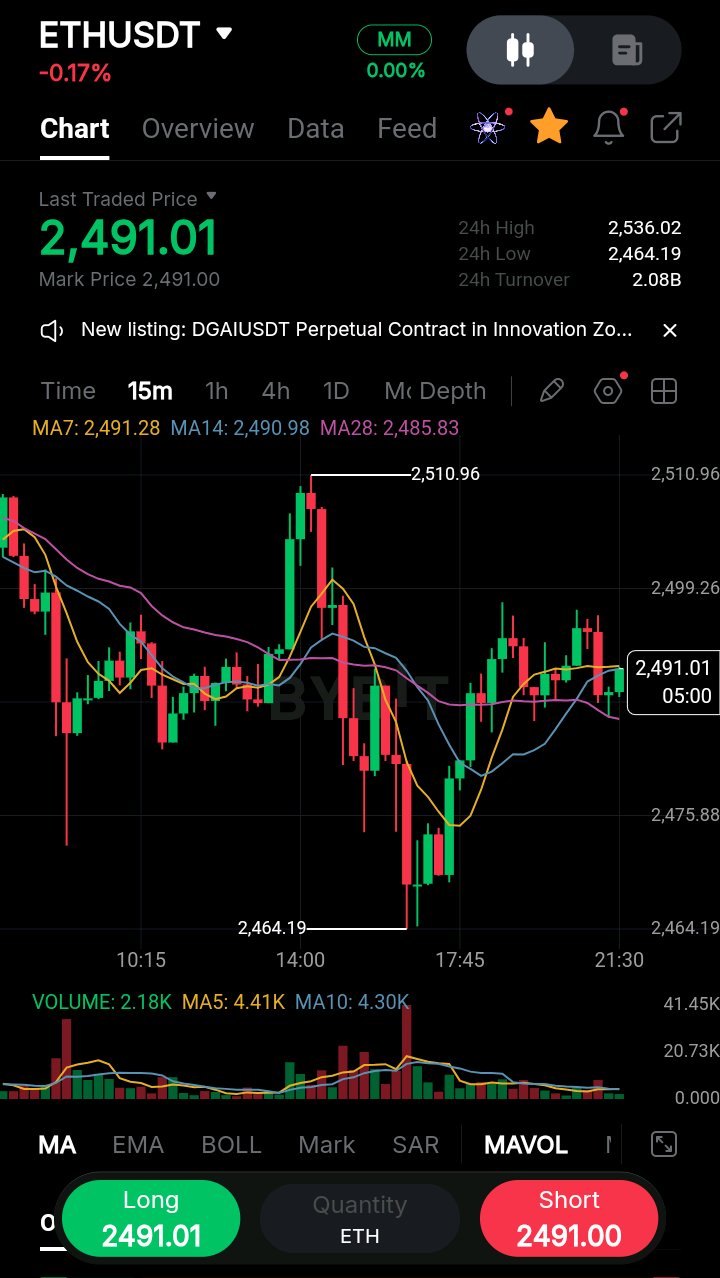
Ethereum Faces a Key Test: 7 ETH Numbers to Watch Ethereum is approaching an important phase as traders closely monitor price action, momentum, support and resistance levels, and overall market sentiment. 📊 Here Are the Key Numbers — ETH Price: Current market price • 24H Change: Daily percentage gain/loss • Key Resistance: The level ETH needs to break for further upside • Key Support: Major demand zone where buyers could step in • 24H High: Recent intraday peak • 24H Low: Recent intraday low • $3,000: Major psychological level to watch 📈 Technical Outlook Ethereum remains closely influenced by Bitcoin’s direction and overall crypto-market sentiment. If ETH holds above its key support zone and breaks through resistance with strong trading volume, it could signal the beginning of another bullish expansion. However, a rejection at resistance followed by a breakdown below support could increase selling pressure and lead to a deeper short-term correction. 🎯 Key Scenarios to Watch 🟢 Bullish Scenario: A clean breakout above major resistance, followed by a successful retest, could strengthen bullish momentum and open the way toward higher price targets. 🔴 Bearish Scenario: If ETH loses its key support zone, sellers could take control and push the price toward the next major support level. 💬 Community Question Do you think Ethereum will break above $3,000 in its next major move, or are we likely to see another correction first? 👇 Drop your ETH target in the comments. 👍 Like, repost, and follow for more crypto market analysis. #iPhone18 #BybitAIBestReplies #AppleVsBTC #MyBybitAIPromptPlaybook #ByXIMPACT

$XAUTUSDT (Tether Gold) — Medium-to-Long-Term Technical Analysis 📌 Major Trend & Market Structure - Overall Trend: Macro bullish - Market Structure: Higher highs and higher lows remain intact. - Current Phase: High-level consolidation, potentially preparing for the next major expansion. - Fundamental Driver: XAUT continues to reflect the broader strength of physical gold and its role as a safe-haven asset. 🎯 Key Technical Levels Resistance Zones - R1: $2,750 — Key breakout level - R2: $2,850–$2,900 — Next major upside target zone - Major Psychological Target: $3,000 Support Zones - S1: $2,580–$2,620 — Primary demand/support zone - S2: $2,480 — Major structural support 📈 Potential Trade Setups 1️⃣ Breakout & Retest — Bullish Scenario A confirmed weekly close above $2,750, supported by strong volume, could signal renewed bullish momentum toward $2,850–$2,900, with $3,000 becoming the next psychological target. 2️⃣ Pullback Entry — Buy-the-Dip Scenario If XAUT retraces toward the $2,600–$2,620 support zone and shows a strong bullish reaction, this area could offer an attractive risk-to-reward setup for longer-term traders. ⚠️ Risk Management: Wait for confirmation around key levels and avoid entering trades solely because price reaches a support or resistance zone. 💬 Community Question Do you think XAUT can break above the psychological $3,000 level before the end of the year, or are we likely to see a deeper correction first? 👇 Share your target below and let me know your outlook. 👍 Like, repost, and follow for more market analysis. #iPhone18 #BybitAIBestReplies #AppleVsBTC #MyBybitAIPromptPlaybook #ByXIMPACT

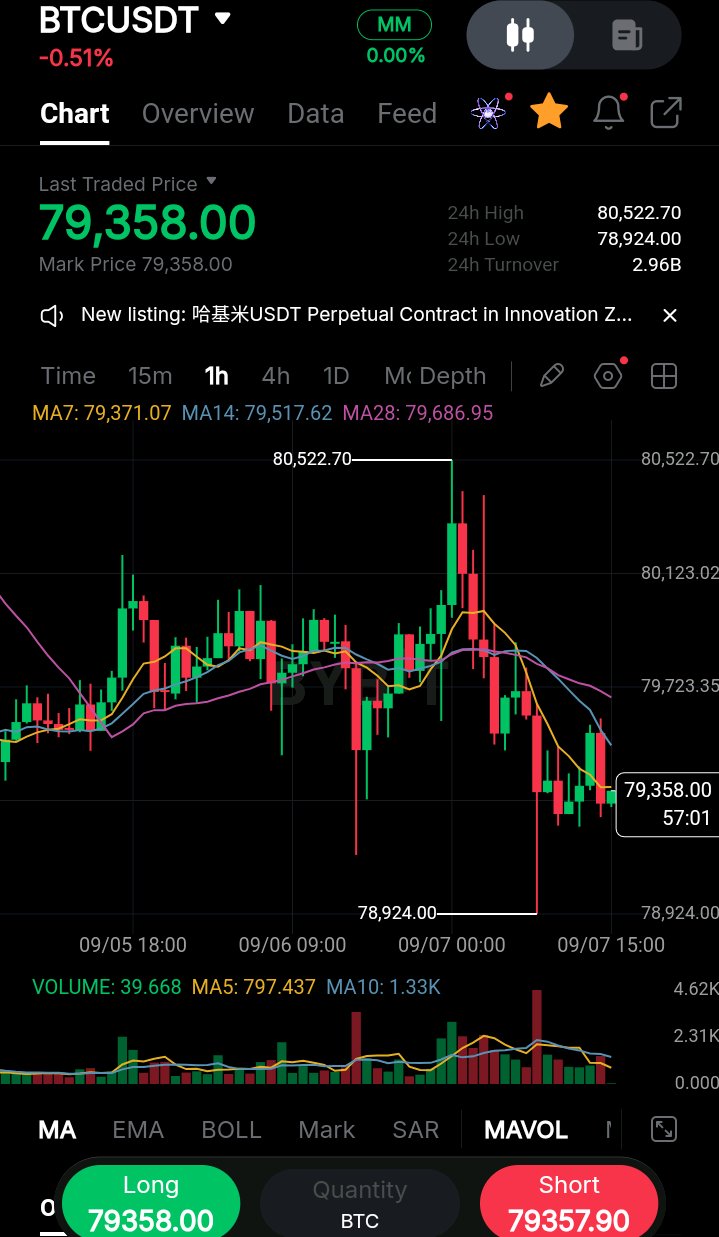
$BTCUSDT — 1-Hour Technical Analysis The BTC/USDT 1-hour chart shows a short-term bearish pullback following a failed breakout above the $80,000 level. Price is currently attempting to consolidate near key support, but the recovery remains weak and lacks strong buying momentum. Key Price Levels - Current Price: $79,358.00 (-0.51%) - Immediate Resistance: $79,517.62 – $79,686.95 — MA14 and MA28 resistance zone. - Major Resistance: $80,522.70 — 24-hour high and recent rejection area. - Immediate Support: $78,924.00 — 24-hour low and key horizontal support. Technical Breakdown Moving Averages: The short-term moving averages remain in a bearish alignment, with MA7 at $79,371.07, MA14 at $79,517.62, and MA28 at $79,686.95. BTC is currently trading slightly below MA7, indicating continued short-term selling pressure. Price Action: BTC initially swept the highs near $80,522.70, but strong selling pressure triggered a sharp decline toward $78,924.00. Buyers defended this level, producing a long lower wick and a modest rebound. However, the recovery remains weak, suggesting that buyers have not yet regained control. Volume: The sell-off toward $78,924.00 was accompanied by a strong red-volume spike, confirming significant selling pressure. Meanwhile, the current green recovery candle has relatively low volume at 39.668, compared with the MA5 volume of 797.437, indicating limited buying conviction. Trade Scenarios 🔴 Bearish Scenario: A confirmed 1-hour candle close below $78,924.00 could signal further downside and continuation of the short-term bearish trend toward lower support levels. 🟢 Bullish Scenario: For the bullish momentum to strengthen, BTC needs to reclaim and hold above $79,686.95 (MA28). A successful breakout could open the way toward $80,123.00, followed by the major resistance at $80,522.70. Overall Outlook The short-term structure remains bearish to neutral while BTC trades below the $79,686.95 resistance zone. The key level to watch is $78,924.00—a break below it could accelerate selling, while a strong reclaim of $79,686.95 would improve the bullish outlook. #iPhone18 #BybitAIBestReplies #AppleVsBTC #MyBybitAIPromptPlaybook #ByXIMPACT

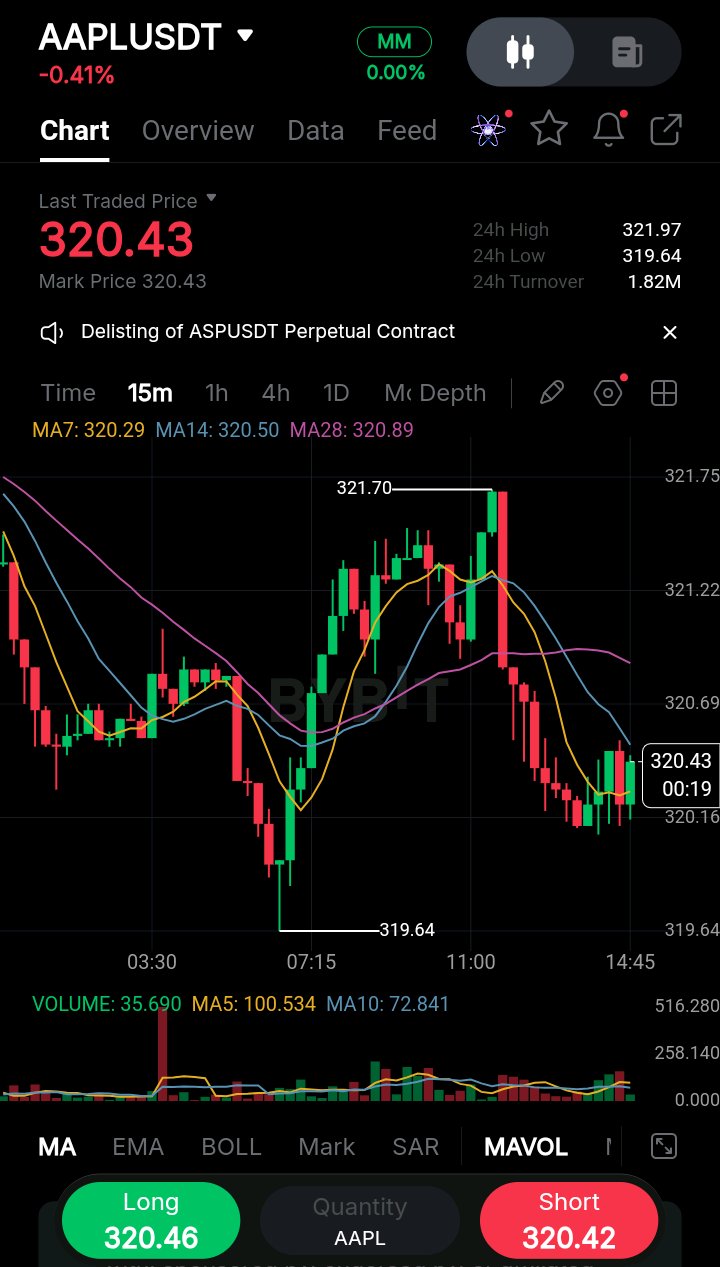
$AAPLXUSDT – 15-Minute Technical Analysis Current Market Overview - Asset: AAPLUSDT (Apple Tokenized Perpetual Contract) - Current Price: 320.43 USDT (-0.41%) - 24H High: 321.97 USDT - 24H Low: 319.64 USDT Technical Analysis Trend & Moving Averages: AAPLUSDT is currently trading below the MA14 at 320.50 and MA28 at 320.89, indicating short-term bearish momentum on the 15-minute timeframe. The price is attempting a modest recovery above the MA7 at 320.29, but the bounce remains weak. Price Structure: After forming a lower high around 321.70, the price experienced strong selling pressure and dropped toward the 319.64 support area. The subsequent rebound has been relatively weak, suggesting that buyers have not yet gained enough momentum to confirm a bullish reversal. Volume Analysis: Trading volume remains relatively low during the current consolidation. This indicates limited market conviction and suggests that a stronger volume expansion may be required before the next significant move. Potential Trade Setups Strategy| Entry Zone| Take-Profit Targets| Stop Loss| Rationale Short – Bearish Continuation| 320.50–320.80| 319.65 / 319.00| 321.20| Look for rejection around the MA14/MA28 resistance zone. Long – Support Bounce| 319.70–320.00| 320.80 / 321.50| 319.30| Tactical long if price holds the local support and shows a bullish reversal with stronger volume. Market Bias The short-term bias remains bearish while AAPLUSDT trades below the 320.50–320.90 resistance zone. A decisive break above 320.90, supported by increasing volume, could weaken the bearish setup and open the way toward 321.50–321.97. Conversely, a break below 319.64 could trigger further downside toward 319.00. Key Levels to Watch: - 🔴 Resistance: 320.50–320.90 - 🔴 Major Resistance: 321.70–321.97 - 🟢 Support: 319.64 - 🟢 Next Support: 319.00 #iPhone18 #BybitAIBestReplies #AppleVsBTC #MyBybitAIPromptPlaybook #ByXIMPACT

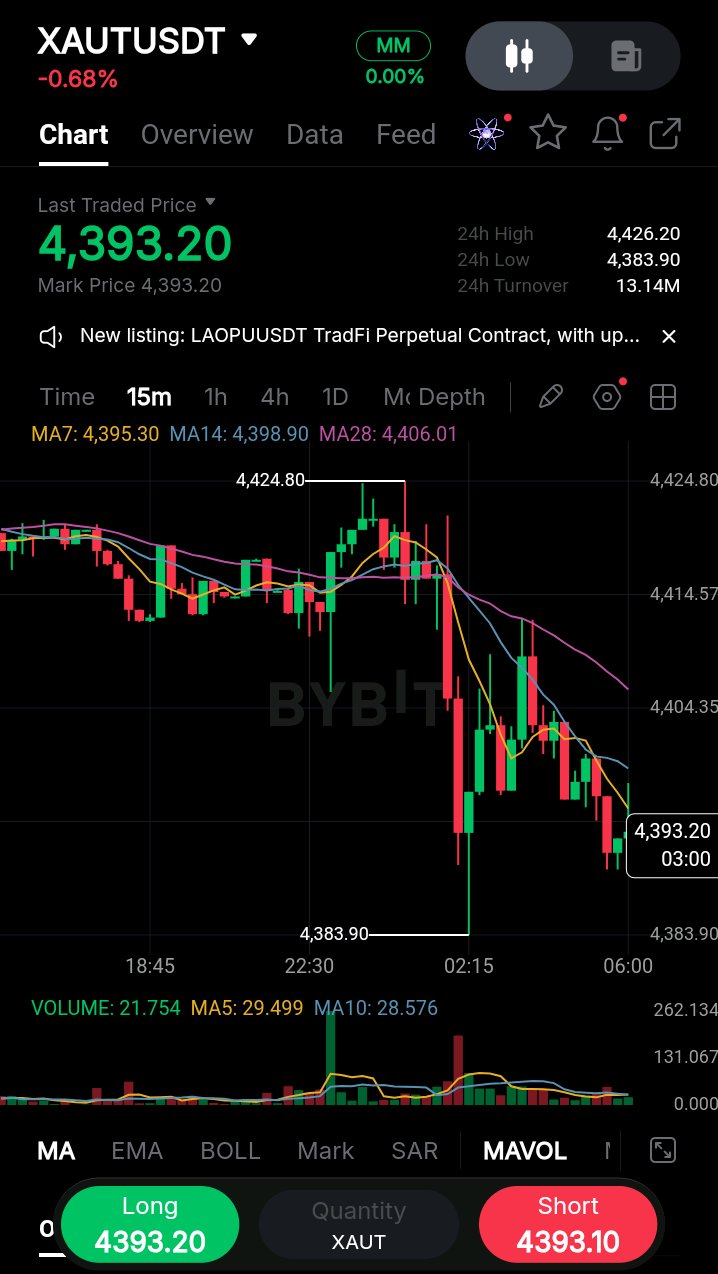
📊 $XAUTUSDT Technical Breakdown — 15-Minute Chart The XAUT/USDT 15-minute chart shows a clear short-term bearish shift following a sharp sell-off and the formation of a lower-low structure. 🔑 Key Price Levels 🔴 Immediate Resistance: 4,395.30 – 4,406.01 (MA7, MA14, and MA28 resistance zone) 🔴 Major Resistance: 4,424.80 (Previous local swing high) 🟢 Immediate Support: 4,383.90 (24H low and recent liquidation wick) 💰 Current Price: 4,393.20 (-0.68%) 📉 Technical Breakdown Sharp Sell-Off: A large bearish candle accompanied by heavy volume pushed price down to 4,383.90 around 02:15, indicating strong selling pressure and liquidity being swept. Moving Average Structure: • MA7: 4,395.30 • MA14: 4,398.90 • MA28: 4,406.01 All three moving averages are positioned above the current price and are trending downward, reinforcing the short-term bearish structure. Volume Analysis: Selling volume surged during the initial breakdown, with MA5 volume reaching above 29.49. However, volume has since declined toward 21.75, suggesting that aggressive buying has not yet returned with strong conviction. 🔻 Bearish Scenario A decisive break below 4,383.90 could confirm further bearish continuation and expose XAUT to lower support zones. 🔺 Bullish Scenario For the bearish momentum to weaken, bulls need to reclaim and hold above 4,406.01 (MA28). A successful breakout could open the way toward 4,424.80. 🔥 Key Question: Will XAUT break below 4,383.90, or can bulls reclaim 4,406.01 and start a recovery? BEARISH or BULLISH? 👇 #XAUT #XAUTUSDT #TetherGold #Gold #Crypto #ByX #Bybit #Trading #TechnicalAnalysis #iPhone18 #BybitAIBestReplies #AppleVsBTC #MyBybitAIPromptPlaybook #ByXIMPACT

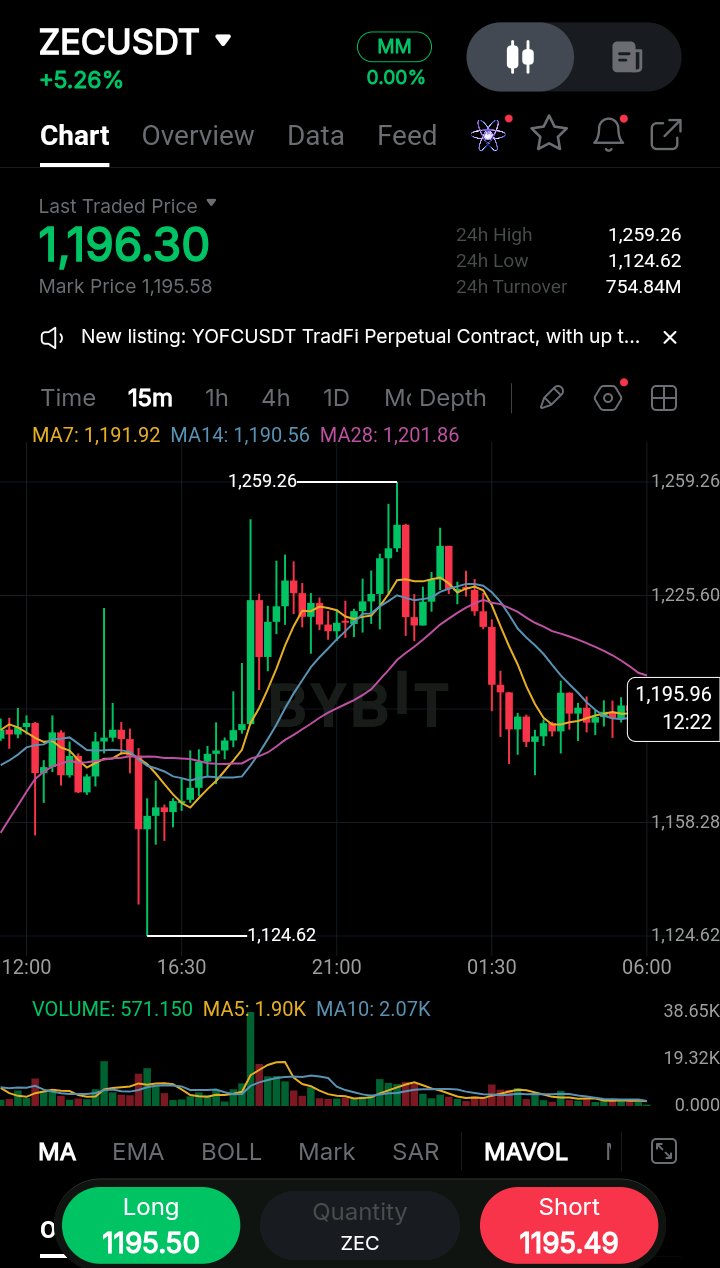
📊 ZEC/USDT Technical Breakdown — 15-Minute Chart Current Price & Market Structure ZEC is currently trading around 1,196.30 USDT, after pulling back from the 24H high of 1,259.26. On the 15-minute timeframe, price is showing a strong correction followed by a consolidation phase around the 1,190–1,200 zone. Moving Averages 🔹 MA7: 1,191.92 🔹 MA14: 1,190.56 🔹 MA28: 1,201.86 Price is currently holding slightly above the MA7 and MA14, suggesting mild short-term buying pressure. However, the MA28 at 1,201.86 remains an important overhead resistance. Key Levels to Watch 🟢 Resistance: • 1,201.86 — MA28 resistance • 1,225.60 — Intermediate resistance • 1,259.26 — 24H high 🔴 Support: • 1,158.28 — Recent swing low • 1,124.62 — Major support / 24H low Volume Analysis Trading volume has declined significantly during the current consolidation compared with the strong volume spike that accompanied the previous price move. This suggests market indecision and the possibility of a larger move once volume returns. 📈 Bullish Scenario A strong breakout and 15-minute close above 1,201.86, supported by increasing volume, could open the way toward 1,225.60 and potentially 1,259.26. 📉 Bearish Scenario If ZEC fails to reclaim 1,201.86 and breaks below 1,190, selling pressure could increase, potentially sending price toward 1,158.28 or even 1,124.62. 🔥 Key Question: Will ZEC break above 1,201.86 and continue higher, or will sellers take control again? LONG or SHORT? 👇 #ZEC #Zcash #ZECUSDT #Crypto #ByX #Bybit #Trading #TechnicalAnalysis #iPhone18 #BybitAIBestReplies #AppleVsBTC #MyBybitAIPromptPlaybook #ByXIMPACT

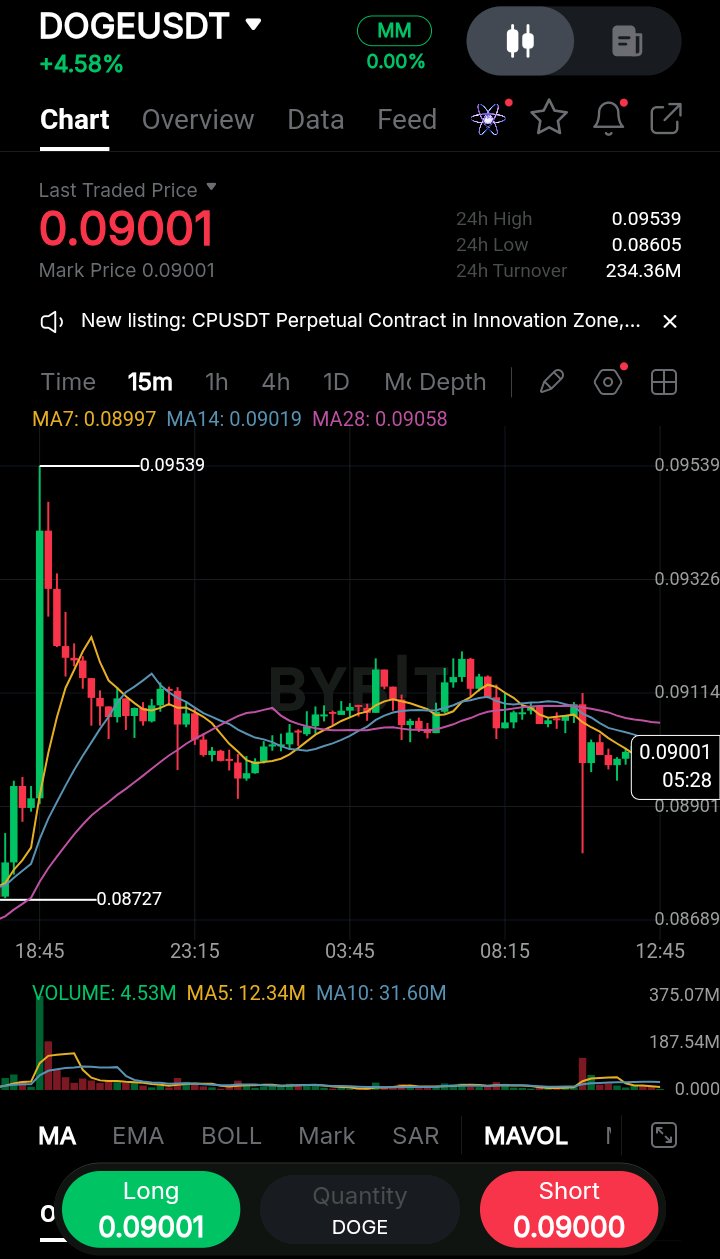
$DOGEUSDT 15-Minute Technical Analysis The DOGE/USDT 15-minute chart shows a period of short-term consolidation with a mild bearish bias following a strong rejection from higher levels. Market Overview - Current Price: 0.09001 (+4.58% over 24h) - 24h High: 0.09539 - 24h Low: 0.08605 Technical Breakdown Trend Structure: DOGE experienced a strong rally toward 0.09539, followed by a sharp rejection. The price then pulled back and established local support around 0.08727. Since then, price action has entered a tightening consolidation range, characterized by lower highs and higher lows, indicating reduced volatility and market indecision. Moving Averages: - MA7: 0.08997 - MA14: 0.09019 - MA28: 0.09058 The MA7 and MA14 remain slightly below the MA28, reflecting mild short-term weakness and a developing bearish alignment. Price is currently trading close to the MA7, suggesting that the market is waiting for a clear directional breakout. Volume Analysis: Trading volume has declined significantly compared with the initial rally. A recent red candle around 12:45 triggered a modest increase in volume, indicating some selling pressure; however, the lack of strong follow-through suggests that sellers have not yet established clear control. Key Levels to Watch Resistance: - 0.09058–0.09114: Immediate resistance zone around the MA28 and recent local highs. - A strong breakout above this zone could shift short-term momentum back to the upside, with potential targets at 0.09326 and 0.09539. Support: - 0.08880–0.08727: Key short-term support zone. - A decisive breakdown below 0.08727 could expose DOGE to further downside toward the 24h low at 0.08605. Trading Scenarios Bullish Scenario: A strong 15-minute candle close above 0.09060, preferably supported by increasing volume, would signal a potential bullish breakout. If confirmed, DOGE could move toward 0.09320 and potentially retest 0.09539. Bearish Scenario: A decisive break below 0.08880 would increase bearish pressure and could lead to a retest of 0.08727. If that support fails, the price could extend toward 0.08605. Overall Outlook DOGE is currently in a tight consolidation phase with a slight bearish bias. The key level to watch is 0.09060–0.09114. A high-volume breakout above this zone would strengthen the bullish case, while a break below 0.08880–0.08727 would favor further downside. #ByXIMPACT #GridTrading #AppleEvent #EarnOnEveryWave #MRVLEarnings
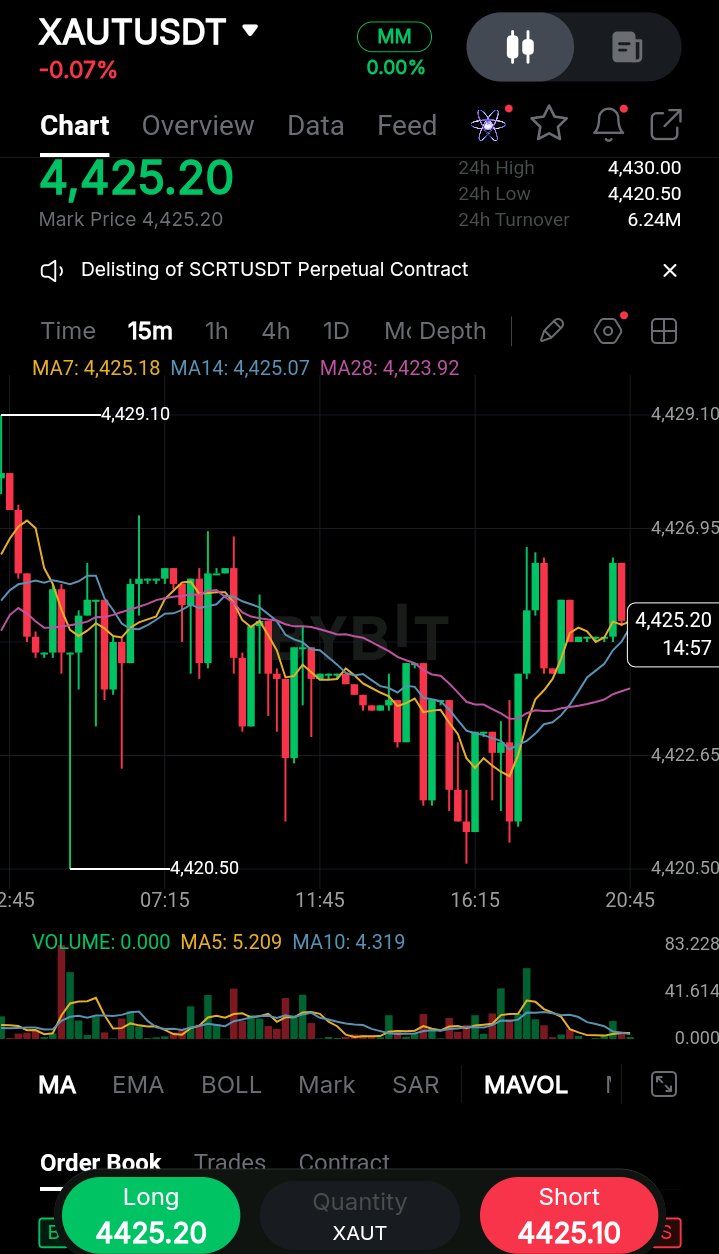
$XAUTUSDT (15-Minute Chart) Technical Analysis The XAUT/USDT 15-minute chart shows a short-term bullish recovery structure following a recent decline toward the 4,420.50 support zone. Current Price & Market Structure - Current Price: 4,425.20 - 24h High: 4,430.00 - 24h Low: 4,420.50 - Short-Term Trend: The market has shifted slightly bullish after forming a potential double-bottom pattern around 4,420.50. Price is now consolidating just below the recent swing high near 4,427.00, suggesting that buyers are attempting to regain control. Moving Averages - MA7: 4,425.18 - MA14: 4,425.07 - MA28: 4,423.92 MA Structure: MA7 and MA14 have moved above MA28, indicating early bullish momentum on the 15-minute timeframe. Price is currently trading around the MA7 and MA14, which are acting as immediate dynamic support. Key Technical Levels - Immediate Resistance: 4,427.00–4,429.10 - Major Resistance: 4,430.00 - Immediate Support: 4,423.90 - Major Support: 4,420.50 Potential Trade Scenarios 🟢 Bullish Scenario — Breakout Long: A decisive 15-minute candle close above 4,427.00, preferably accompanied by increasing volume, could confirm a bullish breakout. The next targets would be 4,429.10, followed by the 4,430.00 resistance level. A sustained break above 4,430.00 could open the way for further upside. 🔴 Bearish Scenario — Breakdown/Pullback: If price breaks and closes below 4,423.90, it would signal weakening bullish momentum and could trigger a deeper pullback toward the major support at 4,420.50. A clean break below 4,420.50 would further strengthen the bearish setup. Overall Outlook The short-term structure remains cautiously bullish while XAUT/USDT holds above 4,423.90. The key confirmation level is 4,427.00–4,430.00. A breakout above this zone would strengthen the bullish outlook, while a breakdown below 4,423.90 would shift momentum back toward the downside. #ByXIMPACT #GridTrading #AppleEvent #EarnOnEveryWave #MRVLEarnings
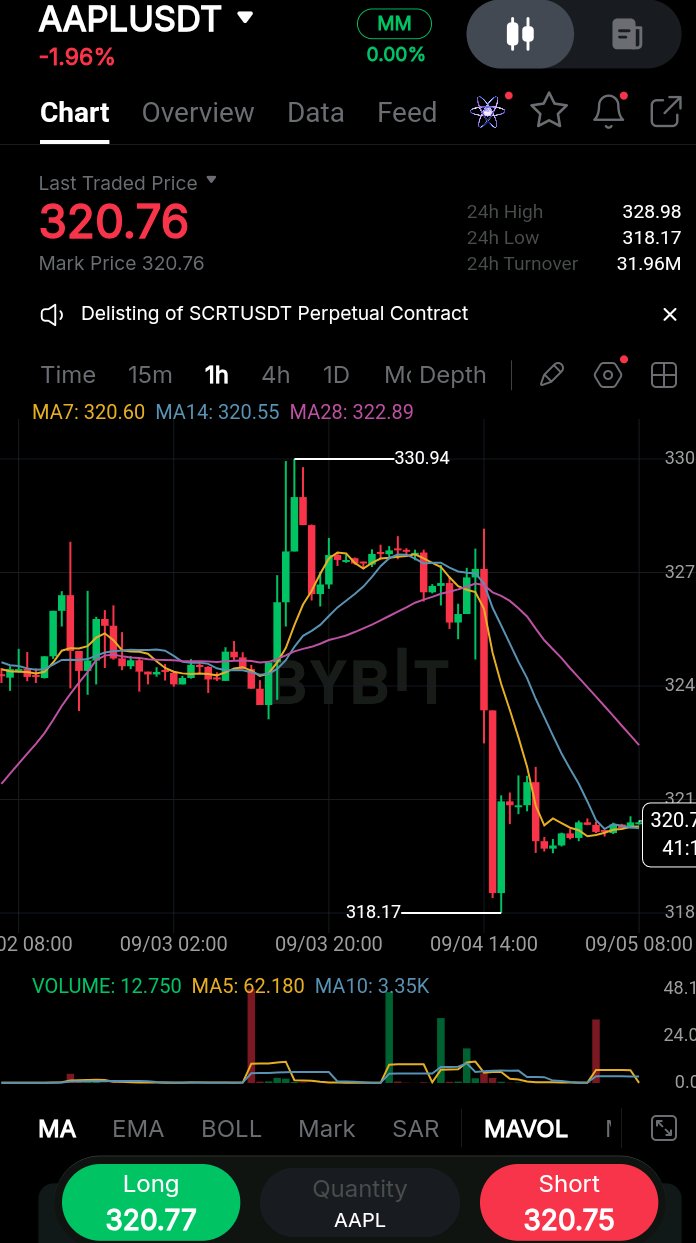
$AAPLXUSDT — 1-Hour Technical Analysis Key Market Metrics Metric| Value| Technical Context Last Traded Price| 320.76| Down 1.96% over the past 24 hours 24h Range| 318.17 – 328.98| Price rebounded from the local low at 318.17 MA7 / MA14| 320.60 / 320.55| Price is consolidating around the short-term moving averages MA28| 322.89| Key dynamic resistance Technical Breakdown Market Structure: AAPLUSDT experienced a sharp bearish decline from the local high of 330.94 to 318.17. Following the sell-off, price has entered a tight sideways consolidation between approximately 320.00 and 321.50, suggesting a temporary balance between buyers and sellers. Moving Averages: Price remains below the MA28 at 322.89, keeping the broader short-term structure under bearish pressure. Meanwhile, the MA7 and MA14 are flattening around the current price, indicating that immediate bearish momentum has weakened and the market is entering a consolidation phase. Volume Analysis: The sharp sell-off on September 4 was accompanied by significant volume, confirming strong selling pressure. However, the subsequent recovery has occurred on declining volume, suggesting that buying momentum remains relatively weak. This increases the risk of another downward move if buyers fail to reclaim key resistance levels. Potential Scenarios 🟢 Bullish Scenario — Long: A sustained breakout and close above 322.90 would signal a potential recovery and confirm a break above the MA28 resistance. If momentum strengthens, the next target could be around 327.00, followed by the 328.98–330.94 resistance zone. 🔴 Bearish Scenario — Short: A decisive break below 318.17 would confirm a continuation of the bearish structure and could open the way toward the 315.00 psychological support level. A strong volume increase on the breakdown would provide additional confirmation. Overall Bias The 1-hour bias remains cautiously bearish while price trades below 322.90. The current consolidation suggests that a breakout is likely to determine the next significant move. Traders should watch 318.17 support and 322.90 resistance closely before entering a position. #ByXIMPACT #GridTrading #AppleEvent #EarnOnEveryWave #MRVLEarnings

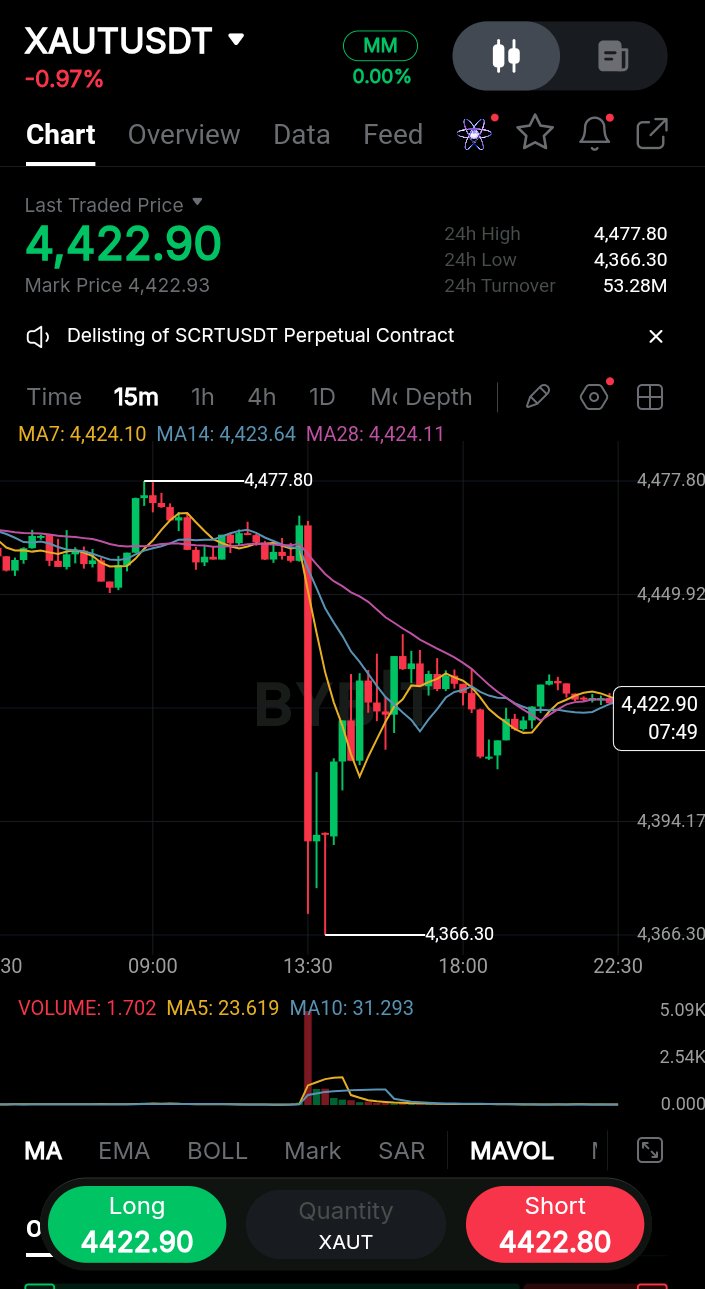
The $XAUTUSDT 15-minute chart shows a sharp sell-off followed by a slow, low-volume stabilization phase. Key Technical Levels - Immediate Resistance: 4,424–4,425 — strong confluence of MA7, MA14, and MA28. - Major Resistance: 4,477.80 — 24-hour high and pre-drop peak. - Immediate Support: 4,394.17 — interim bounce low. - Major Support: 4,366.30 — 24-hour low and key wick bottom. Technical Analysis - Price Action & Trend: Around 13:30, XAUT experienced a sharp breakdown from approximately 4,477 to 4,366.30, accompanied by a significant spike in selling volume. Since then, price has attempted a gradual recovery, forming a low-angle rising channel/wedge. However, the rebound is now approaching strong resistance around 4,423–4,425. - Moving Averages: MA7 (4,424.10), MA14 (4,423.64), and MA28 (4,424.11) are tightly clustered around the current price of 4,422.90. This compression indicates a period of short-term indecision and suggests that a stronger directional move may be approaching. - Volume: The large initial red volume spike confirms strong selling pressure, potentially driven by liquidations or aggressive profit-taking. However, the recovery is occurring on very low volume (1.702), indicating weak buying momentum. Potential Trading Scenarios - Bearish Scenario — Higher Probability: The weak, low-volume recovery resembles a potential bear flag. A rejection from the 4,424–4,428 resistance zone could trigger another decline toward 4,394, followed by a possible retest of the major support at 4,366. - Bullish Scenario: A decisive 15-minute candle close above 4,428, supported by a noticeable increase in volume, could invalidate the immediate bearish setup and open the way toward the 4,450 liquidity zone. Overall Outlook The short-term structure remains cautiously bearish while XAUT trades below 4,428. The key confirmation will be whether price is rejected from resistance or breaks above it with strong volume. Traders should watch the 4,394–4,366 support zone and the 4,424–4,428 resistance zone closely. #ByXIMPACT #GridTrading #AppleEvent #EarnOnEveryWave #MRVLEarnings

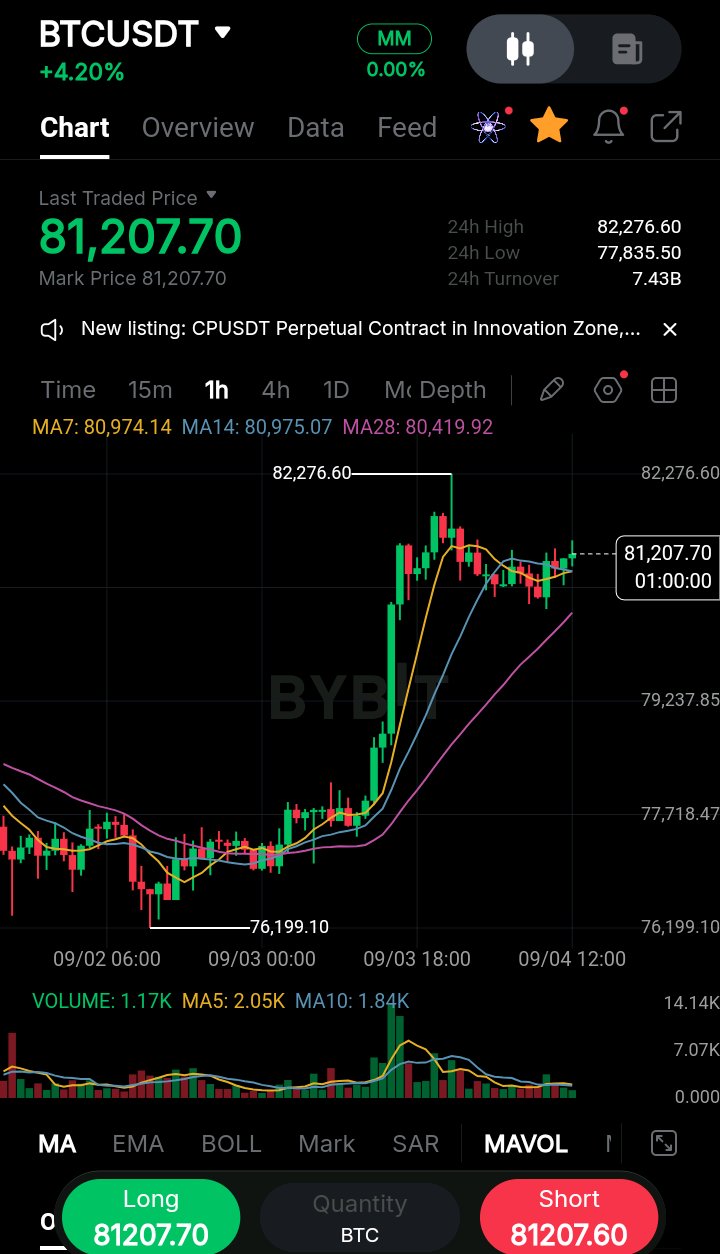
$BTCUSDT 1-Hour Technical Analysis The BTC/USDT 1-hour chart shows a strong bullish impulse followed by a period of high-level consolidation near the recent local high. Key Technical Observations - Price & Trend: Bitcoin surged from a low near 76,199.10 to a local high of 82,276.60. The price is currently trading around 81,207.70, up +4.20%, while holding firmly near the upper end of the recent range. - Moving Averages: - MA7: 80,974.14 - MA14: 80,975.07 - MA28: 80,419.92 MA7 and MA14 are converging just below the current price, providing immediate dynamic support. Meanwhile, the upward-sloping MA28 confirms that the medium-term momentum remains bullish. - Volume: The breakout toward 82,276.60 was supported by a significant volume spike. Volume has since declined during the pullback, suggesting healthy consolidation and profit-taking rather than strong selling pressure. Market Outlook Scenario| Key Levels| Technical Setup Bullish Continuation| Resistance: 82,276.60 → Target: 83,500+| A strong 1-hour close above 82,276.60 could confirm further upside momentum and open the door toward new highs. Pullback| Support: 80,970 → Major Support: 80,400| A break below 80,970 could trigger a deeper retracement toward the MA28 support around 80,400. Overall Bias The structure remains bullish as long as BTC holds above the 80,400–80,970 support zone. A confirmed breakout above 82,276.60 would strengthen the bullish continuation setup, while a sustained break below 80,400 could signal a deeper correction. #ByXIMPACT #GridTrading #AppleEvent #EarnOnEveryWave #MRVLEarnings
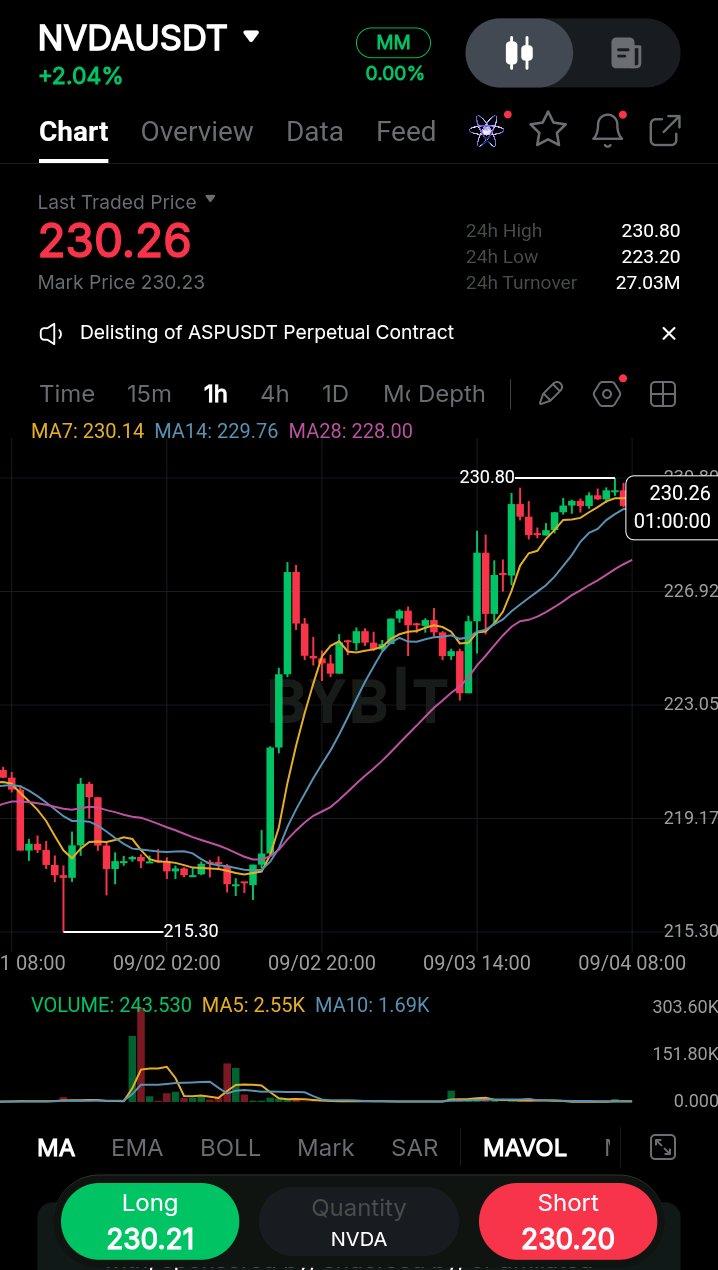
📈 $NVDAXUSDT — 1H Technical Analysis Key Market Metrics - Trading Pair: NVDAUSDT — NVIDIA TradFi Perpetual / Tokenized Contract on Bybit - Current Price: 230.26 USDT (+2.04% 24H) - 24H High: 230.80 USDT - 24H Low: 223.20 USDT - 24H Volume/Turnover: 27.03M USDT 🔍 Technical Analysis Bullish Price Structure: The 1-hour chart shows a strong bullish expansion. After forming a local base around 215.30 USDT on September 2, price broke out decisively and continued higher, reaching a recent high of 230.80 USDT. Moving Average Alignment: The short-term moving averages remain bullishly aligned: - MA7: 230.14 - MA14: 229.76 - MA28: 228.00 Price is currently holding above all three moving averages, indicating strong short-term bullish momentum. Volume Structure: The strongest volume spike occurred during the initial breakout on September 2, exceeding 243.5K. Since then, volume has cooled while price remains near the highs, suggesting that buyers are still defending the breakout rather than aggressive distribution taking place. 🎯 Key Levels & Outlook Resistance: - 230.80 USDT — Recent 24H high - 235.00 USDT — Psychological resistance and potential next target if the breakout is confirmed Support: - 228.00 USDT — MA28 dynamic support - 223.20 USDT — 24H low - 215.30 USDT — Major breakout base and key structural support 📌 Market Outlook The structure remains bullish as long as price holds above the 228.00–223.20 USDT support zone. A clean breakout above 230.80 USDT could open the way toward 235.00 USDT. However, a rejection at the current high followed by a break below 228.00 USDT could trigger a deeper pullback toward 223.20 USDT. Are you currently holding a Long or Short position on NVDAUSDT, or are you waiting for a confirmed entry setup? 👇 #ByXIMPACT #GridTrading #AppleEvent #EarnOnEveryWave #MRVLEarnings

$XRPUSDT — 1-Hour Technical Analysis Technical Overview - Pair & Timeframe: XRP/USDT — 1-Hour - Current Price: $1.4684 (+8.83% over 24h) - 24H High: $1.4833 - 24H Low: $1.3405 Key Technical Levels - Immediate Resistance: $1.4833 - Immediate Support: $1.4648 (MA7) - Secondary Support: $1.4253 (MA14) - Major Dynamic Support: $1.3908 (MA28) - Key Demand Zone: $1.3405–$1.3100 Market Structure & Indicators XRP has experienced a strong vertical breakout after consolidating between $1.3100 and $1.3500. Price is now trading well above all major short-term moving averages, with MA7 > MA14 > MA28, confirming strong bullish momentum. The MA7 at $1.4648 is currently acting as immediate dynamic support, while the MA14 at $1.4253 provides a deeper support level. The MA28 at $1.3908 is also trending sharply upward, reflecting sustained buying pressure. Volume Analysis The breakout toward the $1.4833 high was supported by strong trading volume. However, volume is beginning to cool slightly on the latest 1-hour candle, which could indicate a brief consolidation or minor pullback before the next directional move. Potential Trade Scenarios 🟢 Bullish Continuation: A decisive 1-hour candle close above $1.4833 could confirm further upside momentum, with $1.5000 becoming the next psychological target. 🟡 Pullback & Retest: A short-term pullback toward the $1.4250–$1.4600 support zone would be technically healthy. As long as XRP holds above this area, the bullish structure remains intact. 🔴 Bearish Risk: A sustained breakdown below $1.3900 would weaken the current bullish momentum and could trigger a deeper retracement toward the $1.3400 support area. Overall Outlook The 1-hour structure remains strongly bullish, but XRP is approaching a key resistance zone around $1.4833–$1.5000. Traders should watch for either a confirmed breakout above resistance or a controlled pullback toward the moving-average support levels. #ByXIMPACT #GridTrading #EarnOnEveryWave #MRVLEarnings #NiuLai

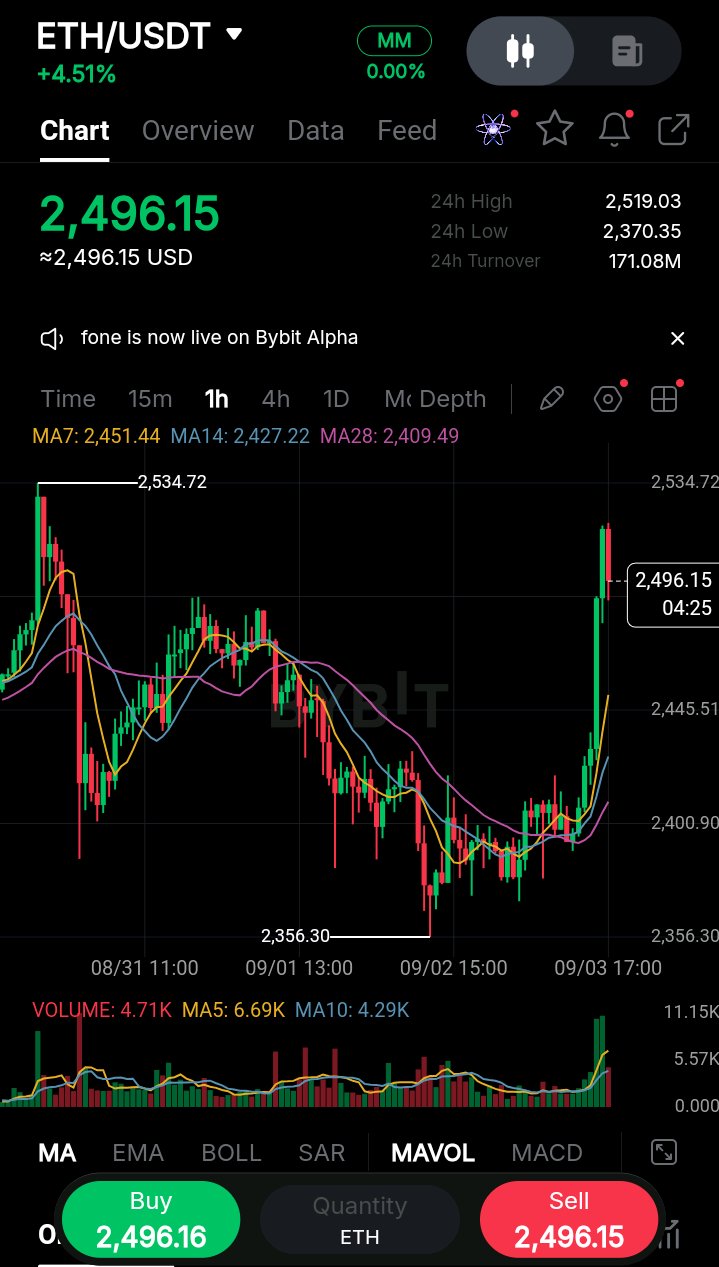
$ETHUSDT 1-Hour Technical Analysis The ETH/USDT 1-hour chart shows a strong short-term bullish reversal following a period of consolidation around key support levels. Buyers have regained control, with price breaking decisively above the major short-term moving averages. Key Technical Metrics - Current Price: $2,496.15 (+4.51%) - 24H High / Low: $2,519.03 / $2,370.35 Moving Averages: - MA7: $2,451.44 - MA14: $2,427.22 - MA28: $2,409.49 Price is trading significantly above all three moving averages, while the MA7 has crossed above the MA14 and MA28, confirming strong short-term bullish momentum. Volume: Volume surged to approximately 11.15K on the latest breakout candle, supporting the strength of the upward move and indicating strong buying interest. Technical Structure & Key Levels Immediate Resistance: $2,519–$2,535 - The $2,519 area is the current 24-hour high and the first major hurdle. - The previous local high around $2,534.72 remains an important resistance level. - A sustained 1-hour close above $2,535 could open the way toward $2,580–$2,600. Immediate Support: $2,445–$2,451 - This zone aligns closely with the rising MA7. - Holding above this area during a pullback would keep the short-term bullish structure intact. Major Support: $2,356 - This level marks the key double-bottom support area that helped initiate the current recovery. - A decisive breakdown below it would significantly weaken the bullish setup. Market Scenarios Bullish Scenario: If ETH consolidates above $2,480–$2,490 and buyers continue to defend this zone, another attempt to break $2,519–$2,535 is likely. A confirmed breakout above $2,535 could accelerate the move toward $2,580–$2,600. Pullback Scenario: The sharp vertical move has pushed ETH significantly above its moving-average cluster. Some short-term profit-taking or a cooling-off move toward $2,450–$2,480 would be normal. If buyers defend this area, it could provide a potential base for another bullish continuation. Overall Bias Short-term bias: Bullish 📈 ETH remains strongly bullish while price holds above the $2,450–$2,480 support zone. However, traders should watch the $2,519–$2,535 resistance area closely, as rejection there could trigger a temporary pullback before another breakout attempt. #ByXIMPACT #GridTrading #EarnOnEveryWave #MRVLEarnings #NiuLai $ETHUSDT