MuzammilWeb3
🚀 Crypto Signals for Byx Traders | Trade Smart, Profit Smart 💰
PYTH: Recovery Is Building, But Resistance Remains
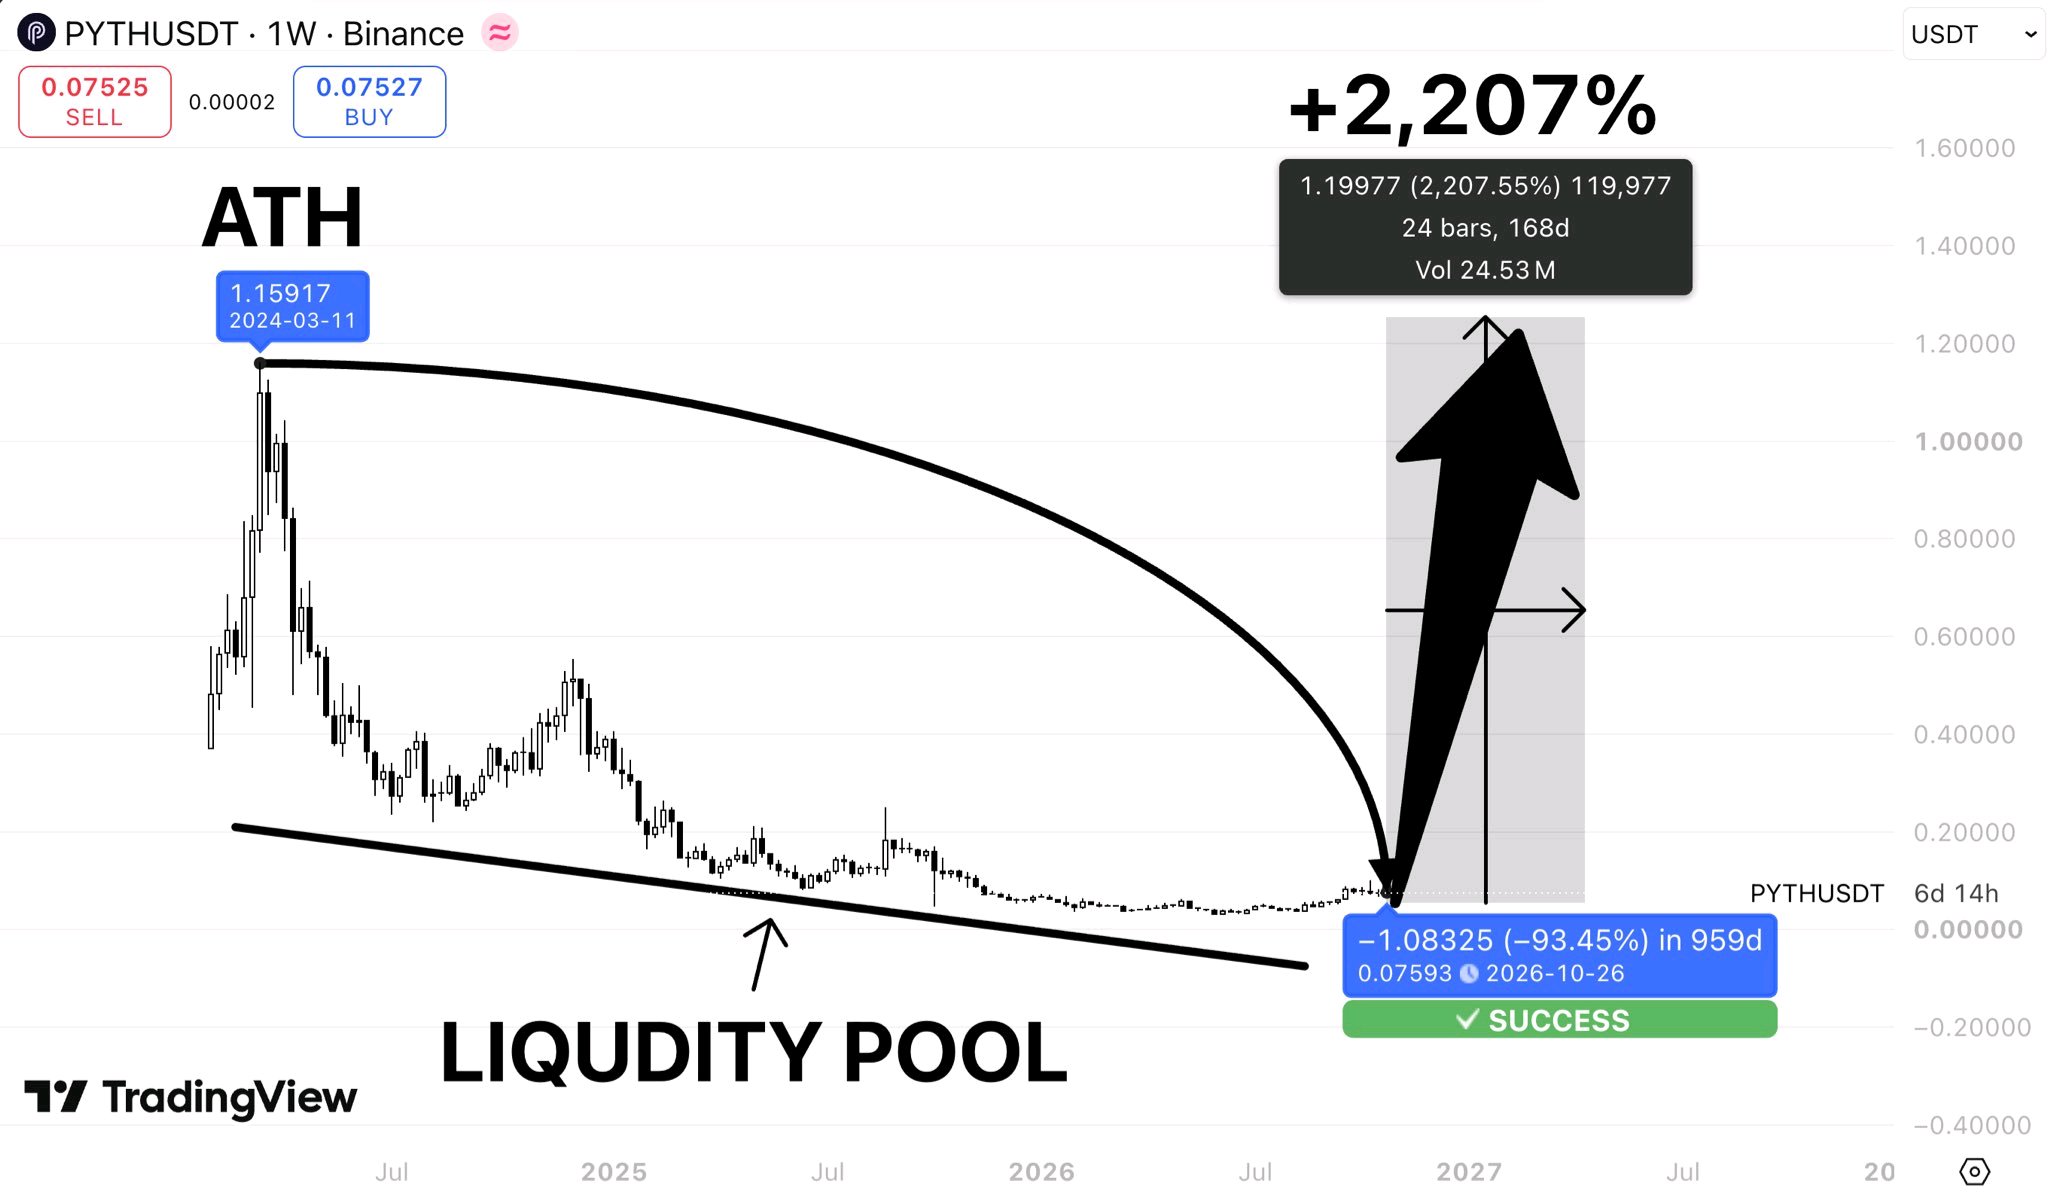
$PYTHUSDT is attempting to recover after falling to the $0.06708 area, but the 4H chart shows that buyers still have important levels to reclaim Price is currently around $0.07324, trading just above the MA28 at $0.07238, while remaining below the MA7 at $0.07425 and MA14 at $0.07350. This suggests the recovery is underway, but bullish momentum has not fully returned The $0.0748–$0.0769 region is the key resistance area to watch. A sustained move above this zone could strengthen the recovery and open the way toward $0.0785, followed by the previous chart high near $0.0824 On the downside, $0.0719 is an important nearby support level. Losing it could weaken the recovery and bring the $0.06708 low back into focus The next move depends on confirmation: buyers need to reclaim resistance with stronger volume, rather than relying on a short-term bounce For now, PYTH is at a decision point. A confirmed breakout could shift momentum in favor of buyers, while another rejection may extend consolidation. #ByXIMPACT
JTO: Can Buyers Defend Support Before a Breakdown?
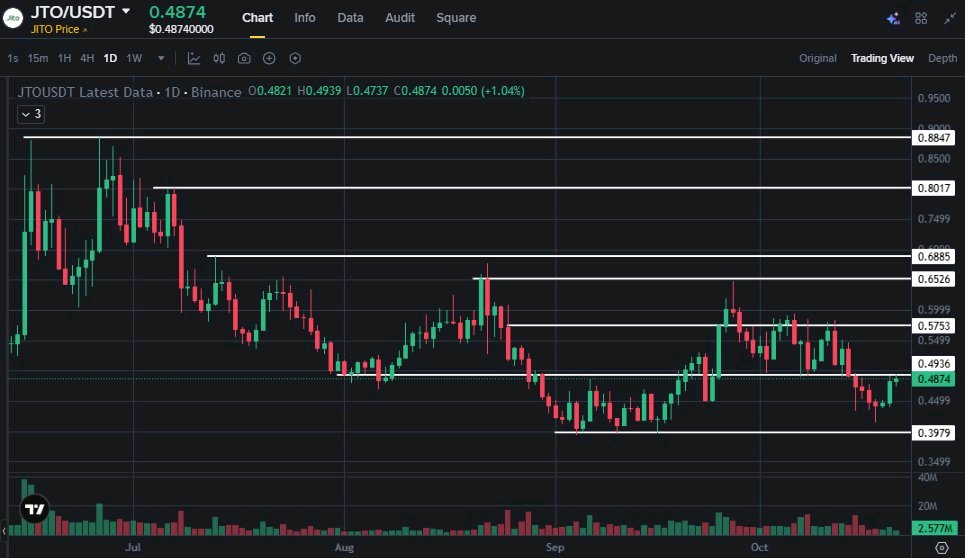
I was looking at the $JTOUSDT chart, and one thing caught my attention. Price is approaching an important support zone, but the bigger trend is still working against buyers. JTO has fallen roughly 34% from its recent $0.6469 peak. The daily chart continues to show lower highs, with price around $0.4276. Here's what makes this setup interesting. The moving averages are still bearish: MA7: $0.4431 MA14: $0.4539 MA28: $0.4981 Price remains below all three. That tells me something important: a bounce is possible, but a reversal hasn't been confirmed. The level I'm watching is $0.4128. Buyers have recently defended this area. If it holds again and buying volume strengthens, JTO could attempt a recovery toward its nearest resistance. But I'm not interested in blindly catching a falling knife. 📊 My Trading Watchlist 📍 Potential bounce zone: $0.4128–$0.4160 🛑 Key invalidation: A sustained breakdown below $0.4128 would weaken the immediate bounce idea. 🎯 Target 1: $0.4431 🎯 Target 2: $0.4539 These are provisional daily-chart levels, not an active entry signal. Here's the catch. If JTO breaks above $0.4431 with strong volume, momentum could improve. But buying only after that breakout leaves relatively little room before the next resistance at $0.4539. That's why entry timing matters more than simply predicting direction. My plan? I'll watch for a confirmed support reaction on the 1H chart before considering a long. If support fails, I'll reassess the bearish continuation instead. The daily trend remains bearish, and without lower-timeframe confirmation, I'm staying patient. Sometimes the best trade isn't the first bounce. It's the one where price finally proves buyers are taking control. Daily chart snapshot: JTO ~$0.4276. Levels may change. #ByXIMPACT
📊 ETH: Bounce Setup or Another Leg Down?
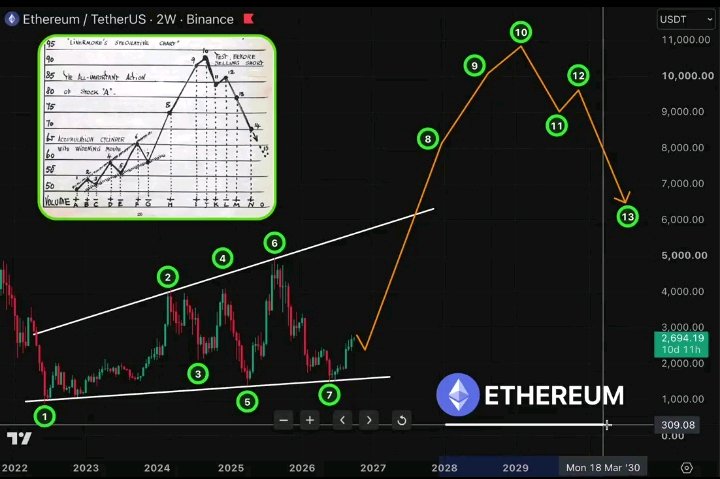
Market snapshot | Oct 27, 2026 💰 $ETHUSDT: ~$2,308 🟢 Immediate support: $2,307 🔴 First resistance: $2,371 📍 Next upside confirmation: $2,438 ⚠️ Lower support: $2,262 Why is ETH worth watching now? ETH is trading near a critical support zone after a series of lower daily closes. The daily technical picture remains weak, with bearish momentum indicators and price below several short-term moving averages. That creates a trade opportunity—but only if price confirms a direction. 🟢 Bullish setup — wait for confirmation If ETH holds $2,307 and reclaims $2,371 with stronger buying volume, a move toward $2,438 becomes worth watching. A sustained break above $2,438 would strengthen the recovery case. 🔴 Bearish setup — support fails If ETH closes below $2,307 and cannot reclaim it, $2,262 becomes the next level to watch. A breakdown supported by selling volume would strengthen the bearish thesis. 🎯 My trading plan • No blind long just because ETH is near support. • No blind short before support actually breaks. • Wait for a confirmed breakout or breakdown, then define invalidation and risk before entering. Long-term targets like $8K–$11K are speculation, not a short-term trading signal. The opportunity is the reaction at $2,307—not the prediction that ETH must bounce. Levels are technical reference points, not guaranteed outcomes. Price and indicators change; verify the live ETH/USDT chart before trading. #ByXIMPACT
📊 AERO: Migration Event — Is There a Trade?
Market snapshot | Oct 27, 2026 💰 Price: ~$0.6753 (source snapshot: Oct 27, 04:26 IST) 📉 7D performance: approximately −15.2% 📉 30D performance: approximately −22.6% Why watch $AEROUSDT now? Bybit announced on Oct 26 that it will support the Aerodrome token migration and smart-contract upgrade. The migration converts old AERO into new AERO at a 1:1 ratio. Important dates: 📅 Nov 3, 08:00 UTC — legacy-token deposits and withdrawals suspended. 📅 Nov 6, 08:00 UTC — estimated resumption for the new token; timing may change. Spot trading is expected to continue during the migration process. 🎯 The trading reason A confirmed migration creates a time-sensitive event that traders may monitor for volatility. But the migration itself does not guarantee buying pressure—and AERO has recently been trending lower. 🟢 Bullish setup: Price reclaims a key resistance level with rising volume and holds the breakout. That could signal buyers are returning. 🔴 Bearish setup: Price fails at resistance, selling volume increases, or the downtrend continues. In that case, the migration narrative alone is not a reason to buy. ⏳ My plan: Watch AERO/USDT on Bybit Spot. Wait for a volume-backed breakout or a clear support reaction before considering an entry. Define the invalidation level first; if price gives no confirmation, skip the trade. The opportunity is the price reaction to the event—not the event headline itself. Price snapshot and performance figures are source-dependent and should be refreshed before posting. Migration dates are based on Bybit's announcement and may change. Not financial advice. #ByXIMPACT

📊 QNT: Bank Adoption vs Token Demand
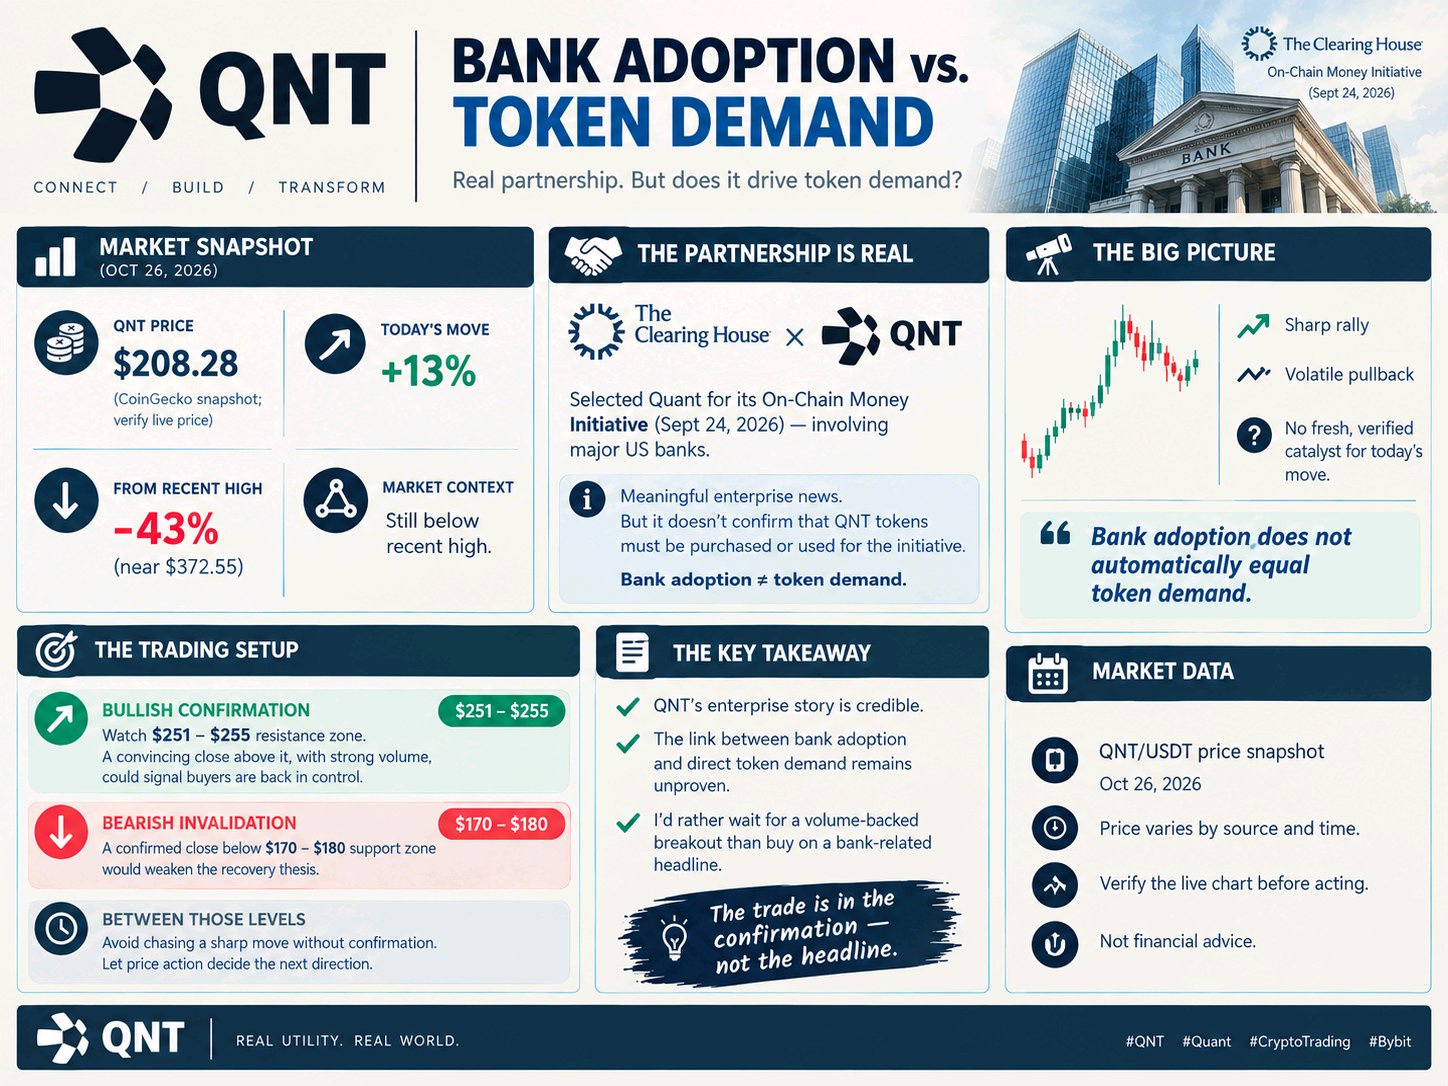
Market snapshot | Oct 26, 2026 💰 $QNTUSDT : ~$208.28 (CoinGecko snapshot; verify live price before posting) 📈 Today’s move: approximately +13% 📉 Still roughly 43% below its recent high near $372.55 The partnership is real. But what does it mean for QNT? On September 24, The Clearing House selected Quant for its On-Chain Money Initiative, involving major US banks. That is meaningful enterprise news—but there’s a critical distinction: the announcement did not establish that QNT tokens must be purchased or used for the initiative. Bank adoption does not automatically equal token demand. Meanwhile, QNT has experienced a sharp rally followed by a volatile pullback. No fresh, verified catalyst has been established for today’s move. 🎯 The trading setup 🟢 Bullish confirmation: Watch the $251–255 resistance zone. A convincing close above it, supported by strong volume, could indicate that buyers are regaining control. 🔴 Bearish invalidation: A confirmed close below the $170–180 support zone would weaken the recovery thesis. ⏳ Between those levels: Avoid chasing a sharp move without confirmation. Let price action establish the next direction. These are analyst-derived levels to verify on the live chart—not guaranteed support or resistance. My thesis: QNT’s enterprise story is credible, but the link between that adoption and direct token demand remains unproven. I’d rather wait for a volume-backed breakout than buy simply because a bank-related headline is circulating. The trade is in the confirmation—not the headline. Market data: Oct 26, 2026. Price snapshots vary by source and time. Verify the live QNT/USDT spot chart before acting. Not financial advice. #ByXIMPACT
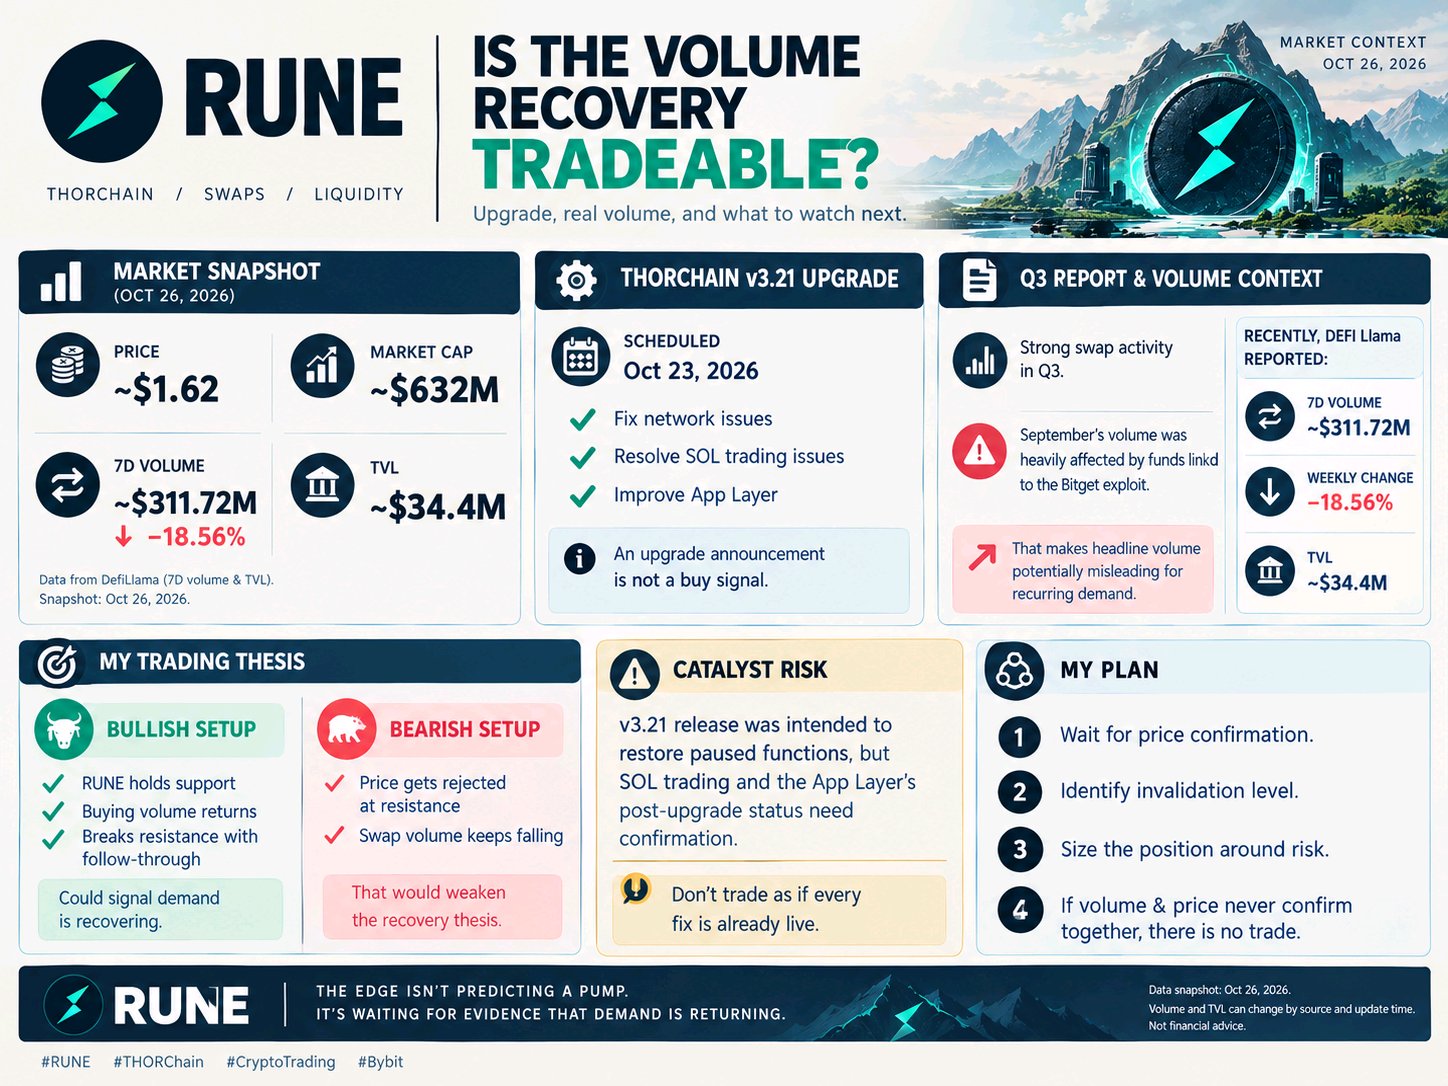
📊 RUNE: Is the Volume Recovery Tradeable?
THORChain’s v3.21 upgrade was scheduled for Oct 23 to fix several network issues, including those affecting SOL trading and the App Layer. But an upgrade announcement alone is not a buy signal. Here’s the trading opportunity to watch 👇 THORChain’s Q3 report showed strong swap activity, but September’s volume was heavily affected by funds linked to the Bitget exploit moving through the network. That makes headline volume a potentially misleading measure of recurring demand. More recently, DefiLlama reported: 🔄 7D volume: ~$311.72M 📉 Weekly volume change: −18.56% 🏦 TVL: ~$34.4M My trading thesis 🟢 Bullish setup: $RUNEUSDT holds support, buying volume returns, and price breaks resistance with follow-through. That could signal demand is recovering. 🔴 Bearish setup: Price gets rejected at resistance while swap volume keeps falling. That would weaken the recovery thesis. ⚠️ Catalyst risk: The v3.21 release was intended to restore paused functions, but SOL trading and the App Layer’s post-upgrade status need confirmation. Don’t trade as if every fix is already live. My plan: Wait for price confirmation instead of buying just because RUNE looks cheap. Before entering, identify the invalidation level and size the position around the risk. If volume and price never confirm together, there is no trade. The edge isn’t predicting a pump. It’s waiting for evidence that demand is returning. Data snapshot: Oct 26, 2026. Volume and TVL can change by source and update time. Not financial advice. #ByXIMPACT
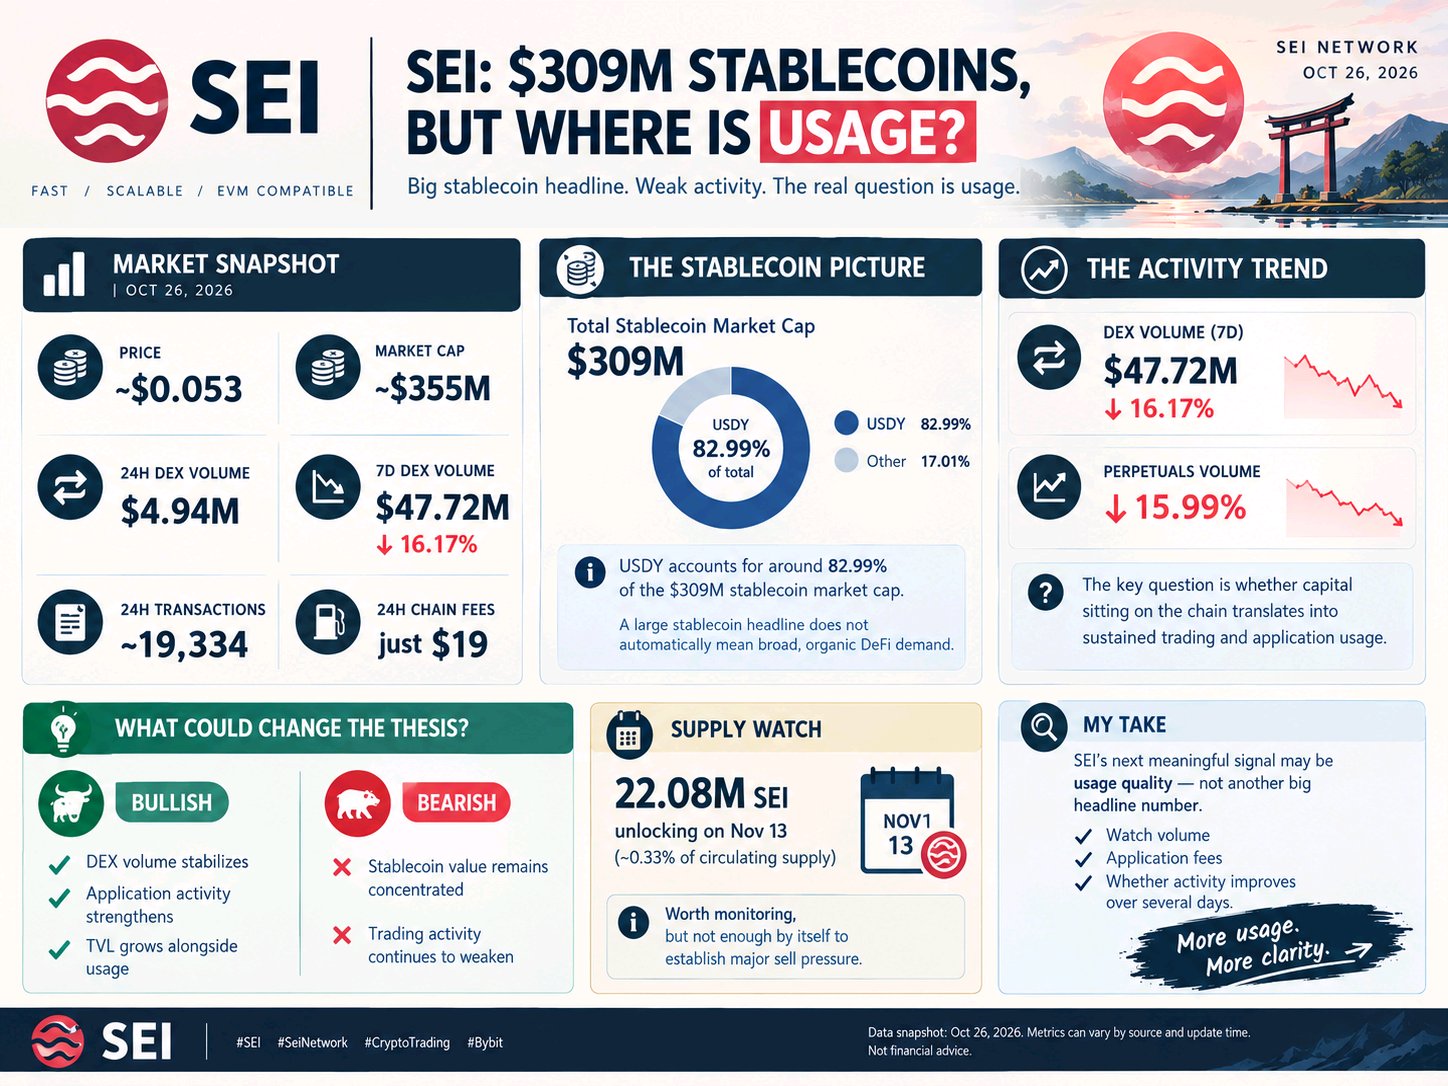
📊 SEI: $309M Stablecoins, But Where Is Usage?
Market snapshot | Oct 26, 2026 💰$SEIUSDT Price: ~$0.053 📉 Market cap: ~$355M 🔄 24h DEX volume: $4.94M 📊 7D DEX volume: $47.72M, down 16.17% ⚡ 24h transactions: ~19,334 ⛽ 24h chain fees: just $19 The headline vs. the activity Sei reports approximately $309M in stablecoin market cap—but USDY accounts for around 82.99% of that total. That matters: a large stablecoin headline does not automatically mean broad, organic DeFi demand Meanwhile, DEX volume has fallen 16.17% over seven days, and perpetuals volume is down 15.99%. The key question is whether capital sitting on the chain translates into sustained trading and application usage What could change the thesis? 🟢 Bullish: DEX volume stabilizes, application activity strengthens, and TVL grows alongside usage 🔴 Bearish: Stablecoin value remains concentrated while trading activity continues to weaken 📅 Supply watch: DefiLlama lists 22.08M SEI unlocking on Nov 13—about 0.33% of circulating supply. Worth monitoring, but not enough by itself to establish major sell pressure My take: SEI’s next meaningful signal may be usage quality—not another big headline number. I’d watch volume, application fees, and whether activity improves over several days before drawing a directional conclusion Data snapshot: Oct 26, 2026. Metrics can vary by source and update time. Not financial advice #ByXIMPACT
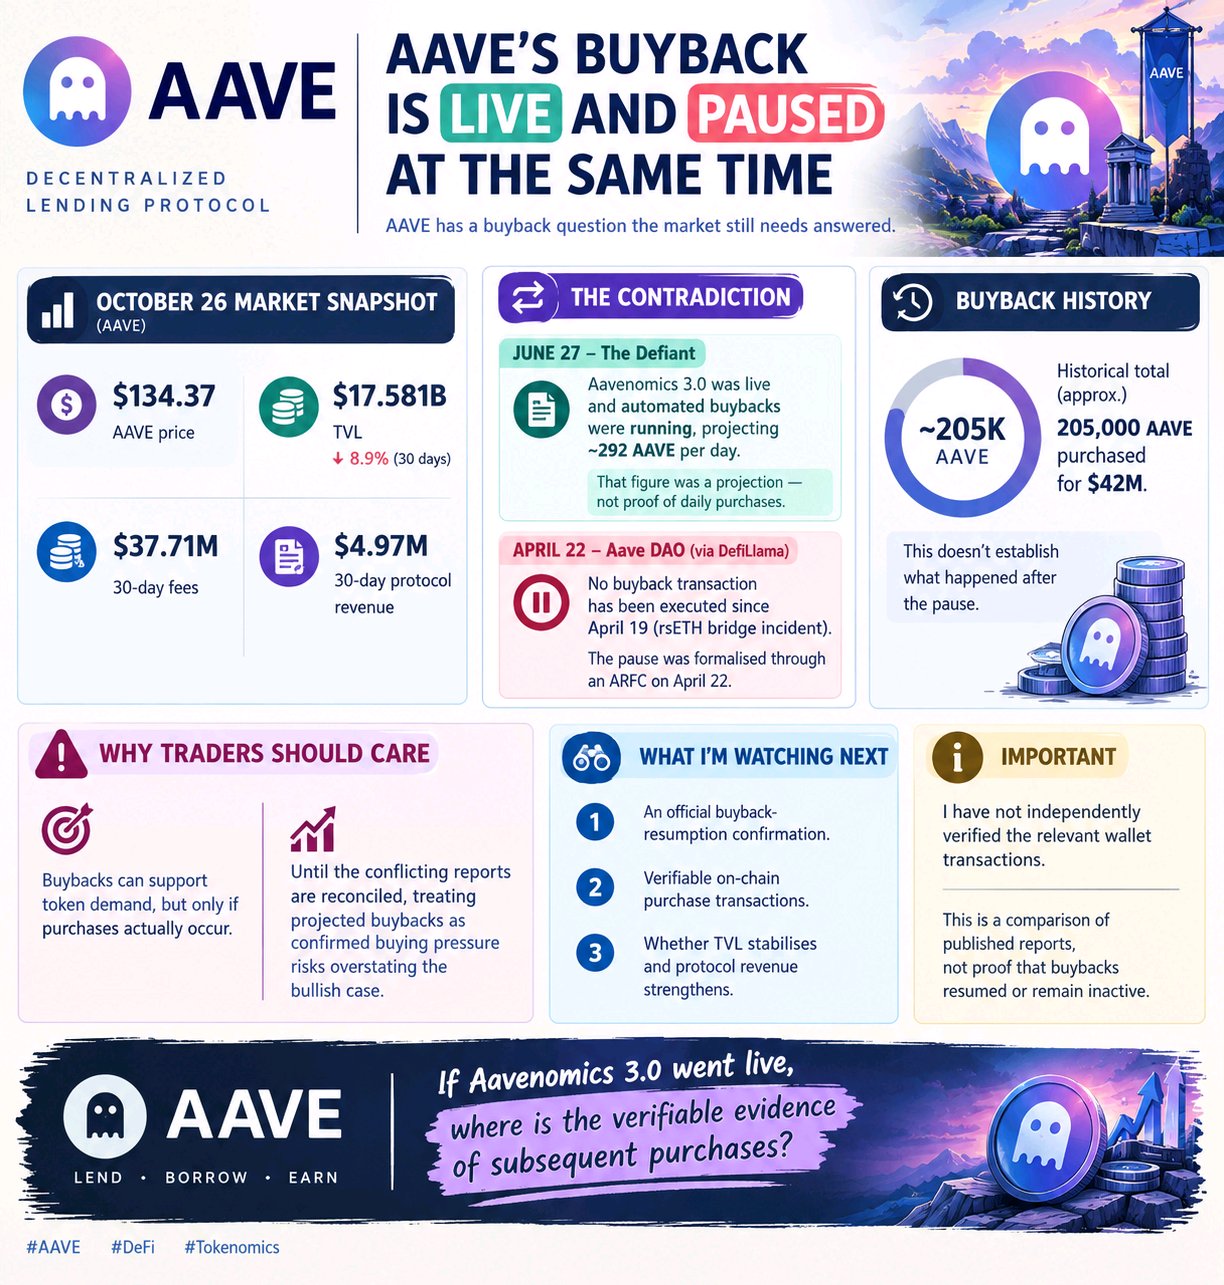
Aave's Buyback Is Live and Paused at the Same Time
$AAVEUSDT has a buyback question the market still needs answered I found two published accounts that don't reconcile—and the difference matters for anyone evaluating $AAVE's token-demand story 📊 October 26 market snapshot • AAVE price: $134.37 • TVL: $17.581B, down 8.9% over 30 days • 30-day fees: $37.71M • 30-day protocol revenue: $4.97M The contradiction: On June 27, The Defiant reported that Aavenomics 3.0 was live and automated buybacks were running, projecting approximately 292 AAVE per day. That figure was a projection—not proof of daily purchases However, the Aave DAO finance service provider's statement cited in DefiLlama's token rating says no buyback transaction has been executed since April 19, following the rsETH bridge incident. The pause was formalised through an ARFC on April 22 The programme's historical total is reported at approximately 205,000 AAVE purchased for $42M—but that doesn't establish what happened after the pause Why traders should care: Buybacks can support token demand, but only if purchases actually occur. Until the conflicting reports are reconciled, treating projected buybacks as confirmed buying pressure risks overstating the bullish case 🔎 What I'm watching next: 1. An official buyback-resumption confirmation. 2. Verifiable on-chain purchase transactions. 3. Whether TVL stabilises and protocol revenue strengthens. Important: I have not independently verified the relevant wallet transactions. This is a comparison of published reports, not proof that buybacks resumed or remain inactive If Aavenomics 3.0 went live, where is the verifiable evidence of subsequent purchases? #ByXIMPACT
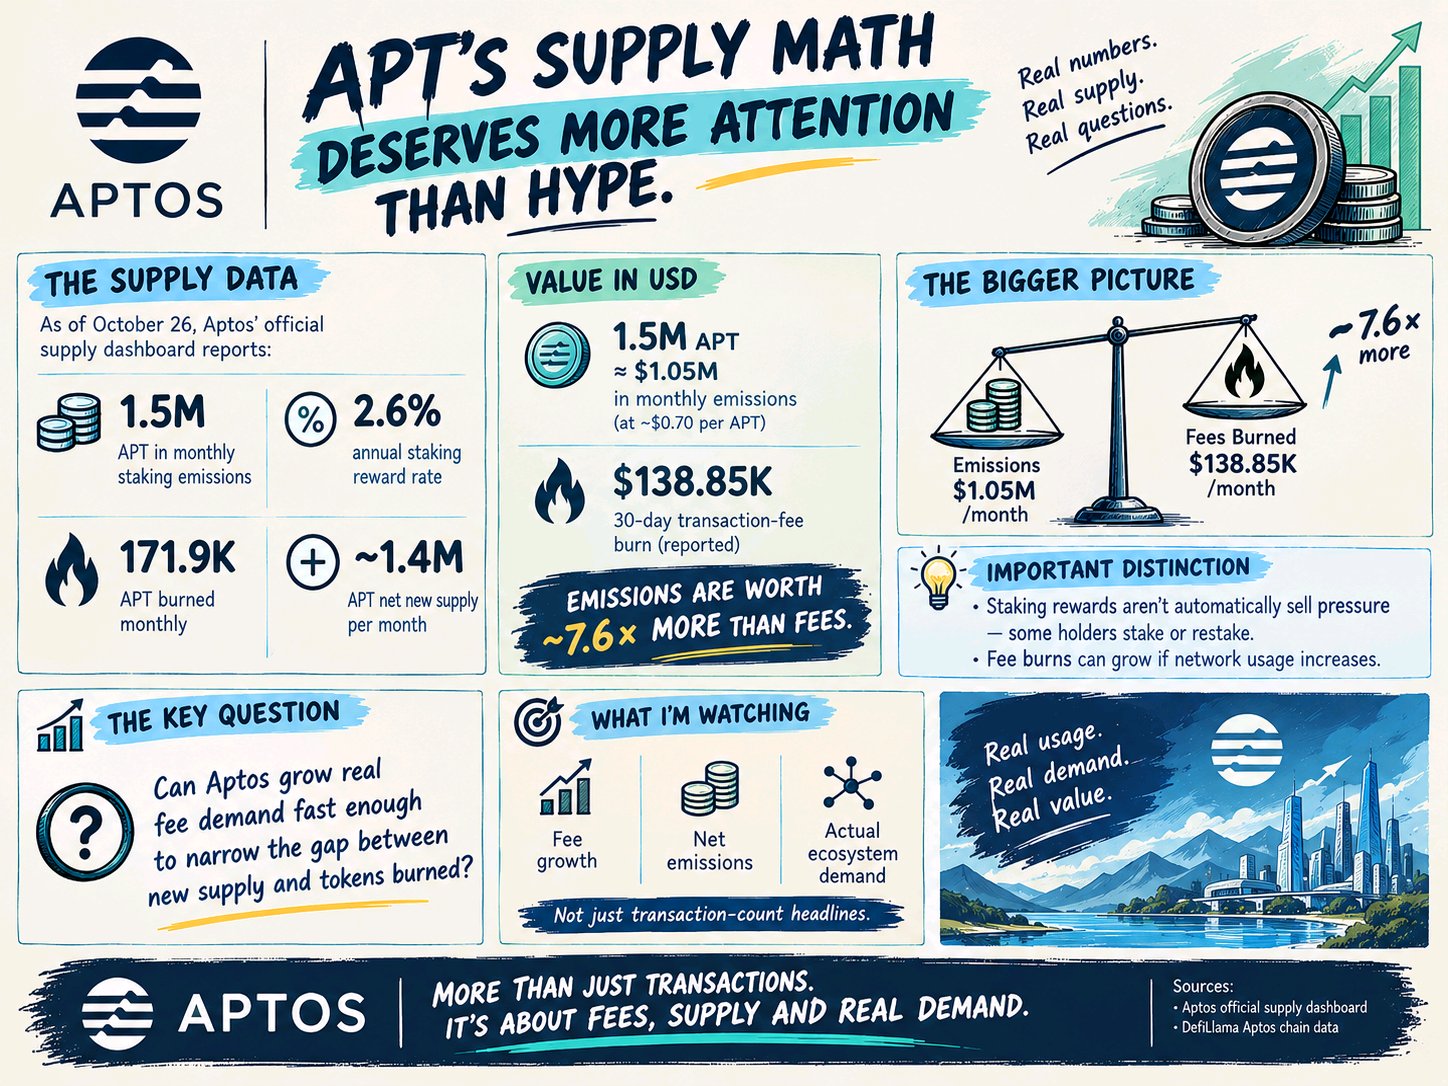
APT’s Supply Math Deserves more Attention Hype
As of October 26, Aptos’ official supply dashboard reports: • 1.5M APT in monthly staking emissions • 2.6% annual staking reward rate • 171.9K APT burned monthly • Around 1.4M APT net new supply per month At roughly $0.70 per $APTUSDT, 1.5M tokens represent about $1.05M in monthly emissions. The network’s reported 30-day transaction-fee burn is about $138.85K. That means emissions are worth roughly 7.6× the dollar value of fees burned at that price. Important distinction: staking rewards aren’t automatically sell pressure—some holders stake or restake. And fee burns can grow if network usage increases. But the key question remains: Can Aptos grow real fee demand fast enough to narrow the gap between new supply and tokens burned? I’m watching fee growth, net emissions, and actual ecosystem demand—not just transaction-count headlines. #ByXIMPACT
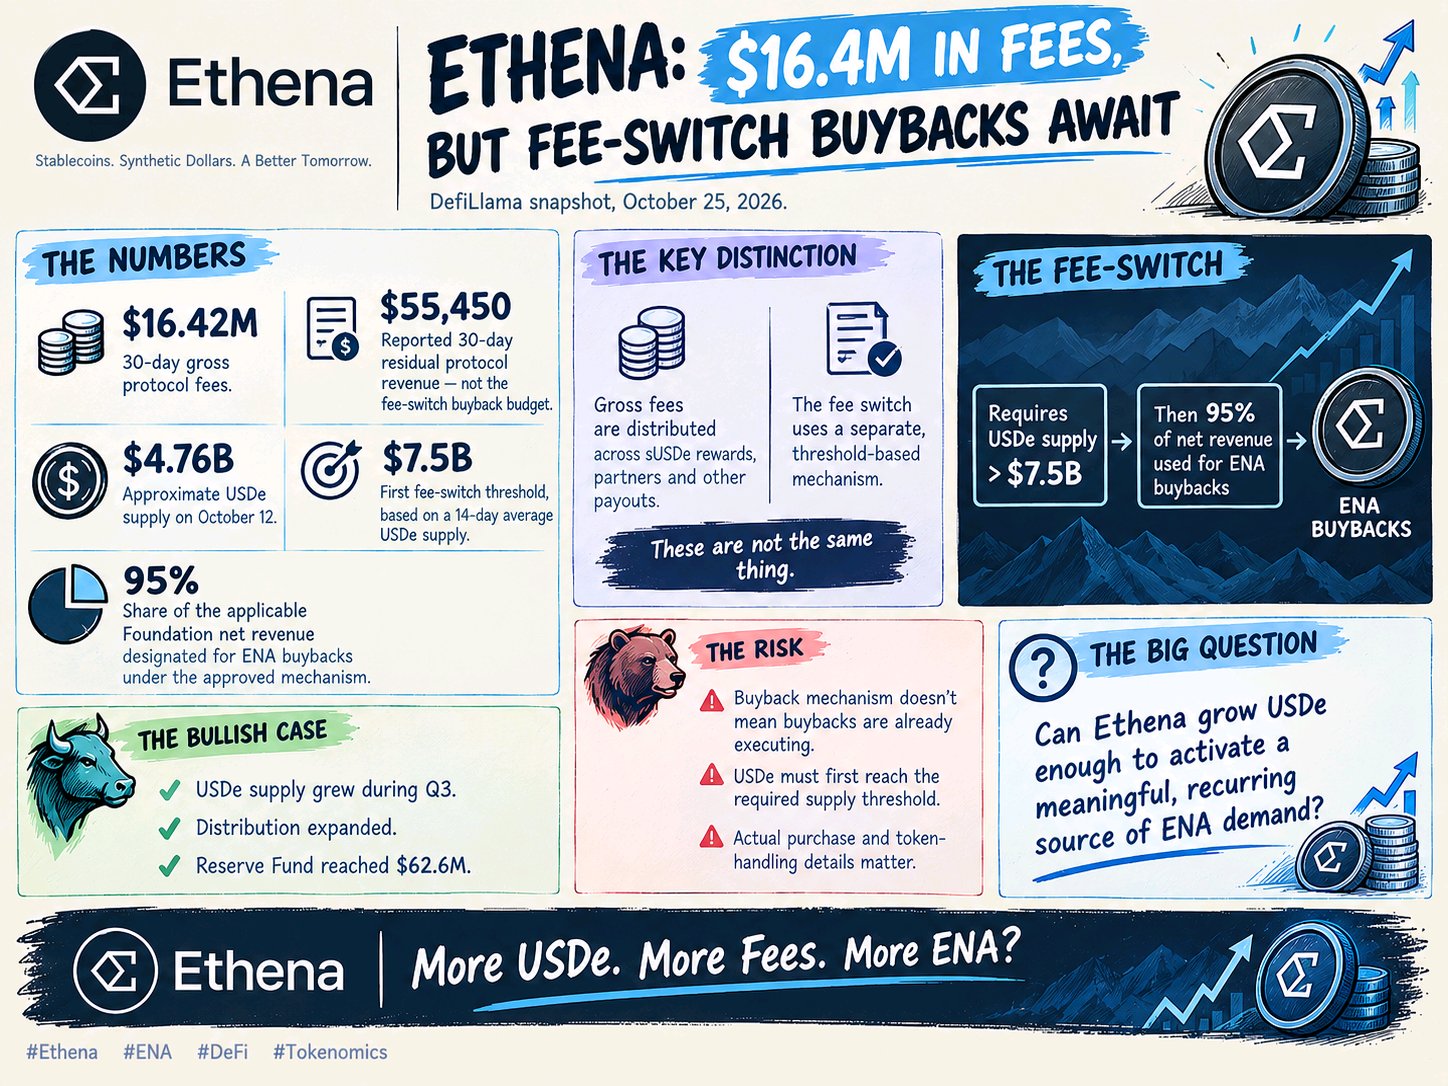
Ethena: $16.4M in Fees, But Fee-Switch Buybacks
DefiLlama snapshot, October 25, 2026 Ethena generated approximately $16.42M in gross protocol fees over 30 days. Yet the approved $ENAUSDT fee-switch mechanism had not reached its first activation threshold in the latest supply data you collected. 📊 The numbers - $16.42M: 30-day gross protocol fees - $55,450: Reported 30-day residual protocol revenue—not the fee-switch buyback budget - $4.76B: Approximate USDe supply on October 12. - $7.5B: First fee-switch threshold, based on a 14-day average USDe supply - 95%: Share of the applicable Foundation net revenue designated for ENA buybacks under the approved mechanism The distinction matters: gross fees are distributed across sUSDe rewards, partners and other payouts. The fee switch uses a separate, threshold-based mechanism The bullish case: USDe supply grew during Q3, distribution expanded, and the Reserve Fund reached $62.6M The risk: The buyback mechanism's existence does not mean buybacks are already executing. USDe must first reach the required supply threshold, and the actual purchase and token-handling details matter The real question: Can Ethena grow USDe enough to activate a meaningful, recurring source of ENA demand? #ByXIMPACT
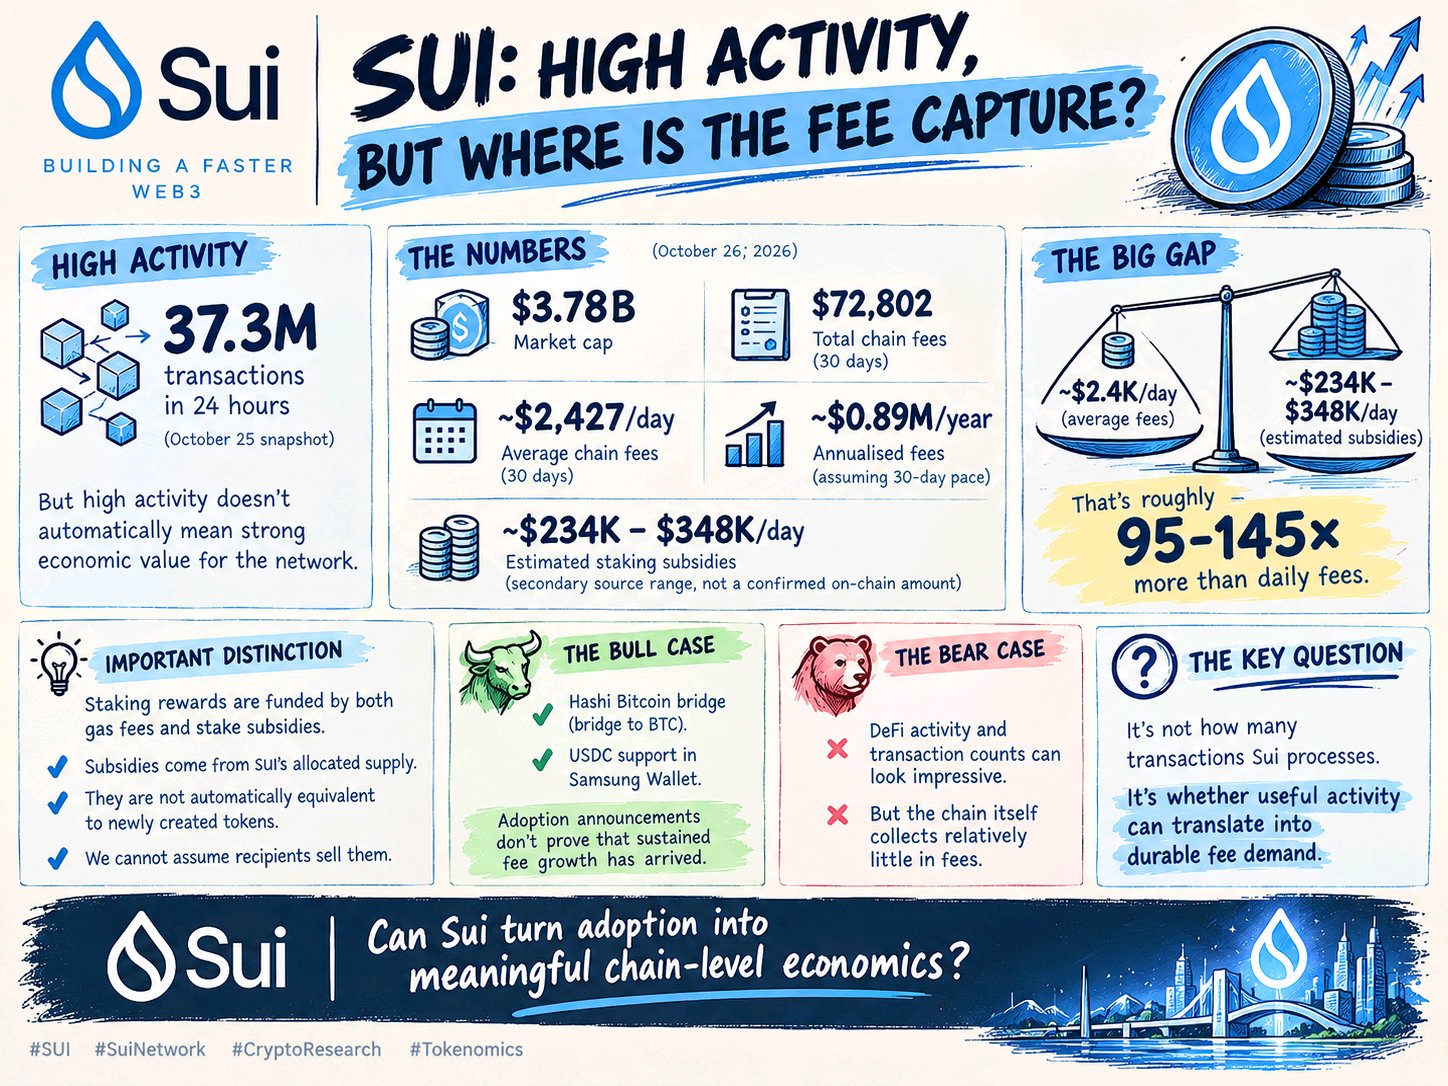
SUI: High Activity, But Where Is the Fee Capture?
$SUIUSDT reported 37.3M transactions in 24 hours in the October 25 snapshot. But high activity doesn't automatically mean strong economic value for the network. 📊 The numbers — October 26, 2026 - $3.78B: Market cap. - $72,802: Total chain fees over 30 days. - ~$2,427/day: Average chain fees over that period. - ~$0.89M/year: Annualised fees, assuming the 30-day pace continues. - ~$234K–$348K/day: Estimated staking subsidies, based on a secondary-source range—not a confirmed current on-chain amount. That estimated subsidy range is roughly 95–145× the average daily chain fees. Important distinction: staking rewards are funded by both gas fees and stake subsidies. Subsidies come from SUI's allocated supply; they are not automatically equivalent to newly created tokens, and we cannot assume recipients sell them. The bull case: Sui has potential catalysts, including the Hashi Bitcoin bridge and USDC support in Samsung Wallet. But adoption announcements don't prove that sustained fee growth has arrived. The bear case: DeFi activity and transaction counts can look impressive while the chain itself collects relatively little in fees. The key question isn't how many transactions Sui processes. It's whether useful activity can translate into durable fee demand. Can Sui turn adoption into meaningful chain-level economics? #ByXIMPACT
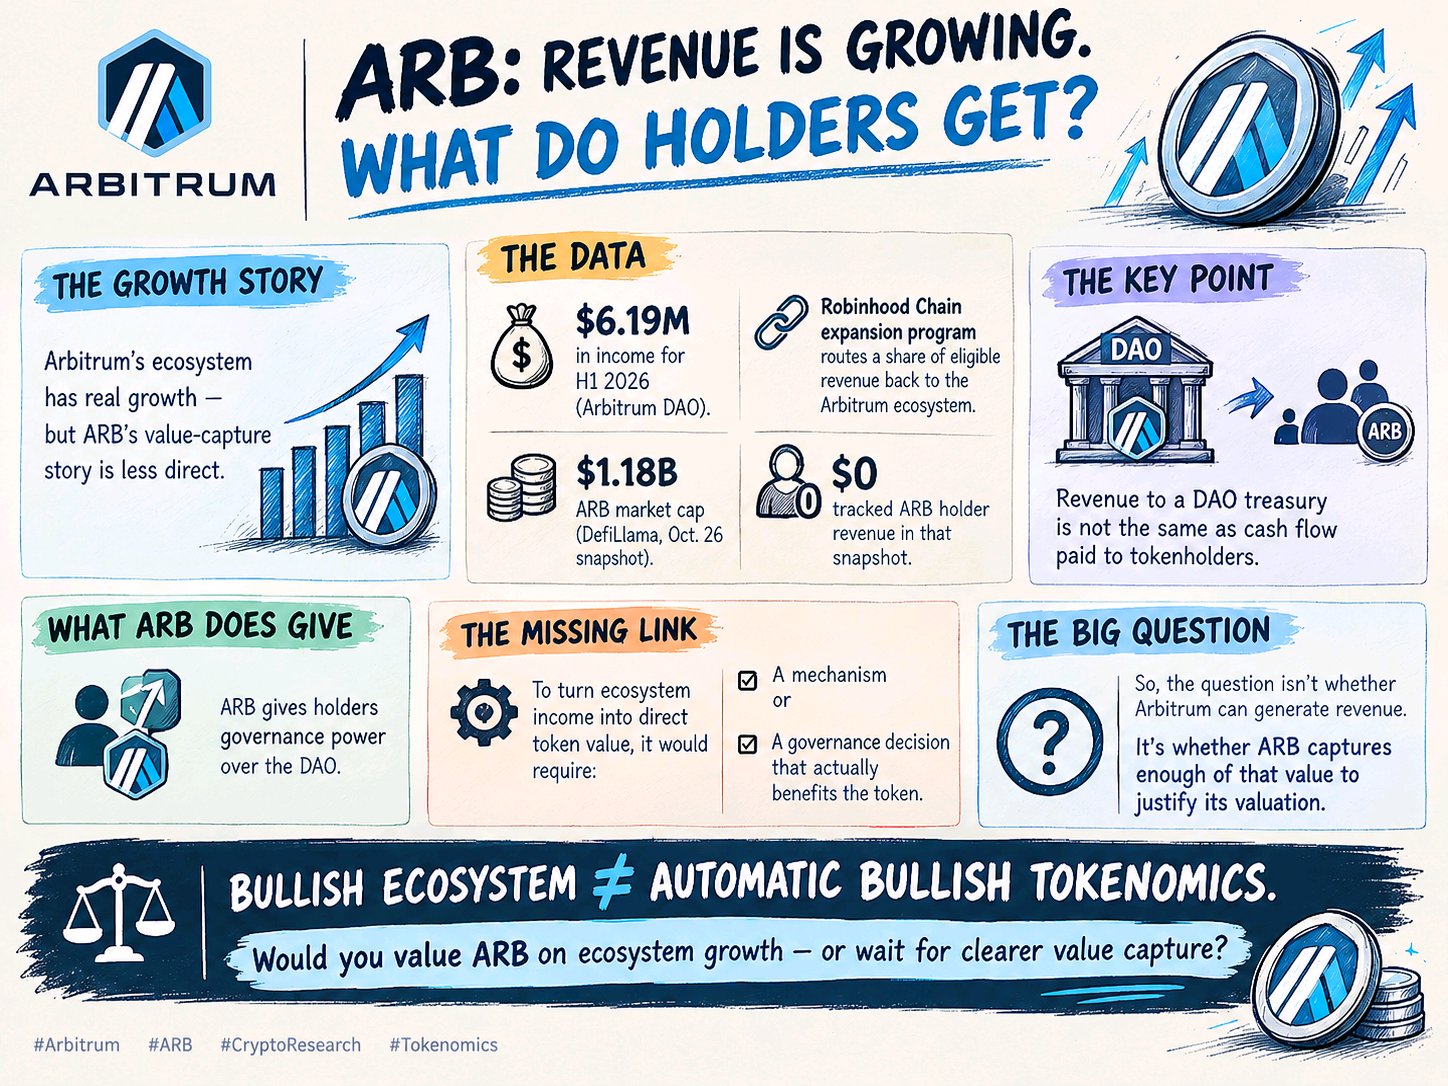
ARB: Revenue Is Growing. What Do Holders Get?
Arbitrum’s ecosystem has a real growth story—but ARB’s value-capture story is less direct 📊 The data • Arbitrum DAO reported $6.19M in income for H1 2026 • Its Robinhood Chain expansion program routes a share of eligible revenue back to the Arbitrum ecosystem • DefiLlama’s Oct. 26 snapshot showed about $1.18B ARB market cap • Yet tracked ARB holder revenue was $0 in that snapshot That last figure matters. Revenue going to a DAO treasury is not the same as cash flow paid to tokenholders $ARBUSDT gives holders governance power over the DAO—but turning ecosystem income into direct token value would require a mechanism or governance decision that actually benefits the token So the question isn’t whether Arbitrum can generate revenue. It’s whether ARB captures enough of that value to justify its valuation Bullish ecosystem ≠ automatic bullish tokenomics Would you value ARB on ecosystem growth—or wait for clearer value capture? #ByXIMPACT #MyByXTake
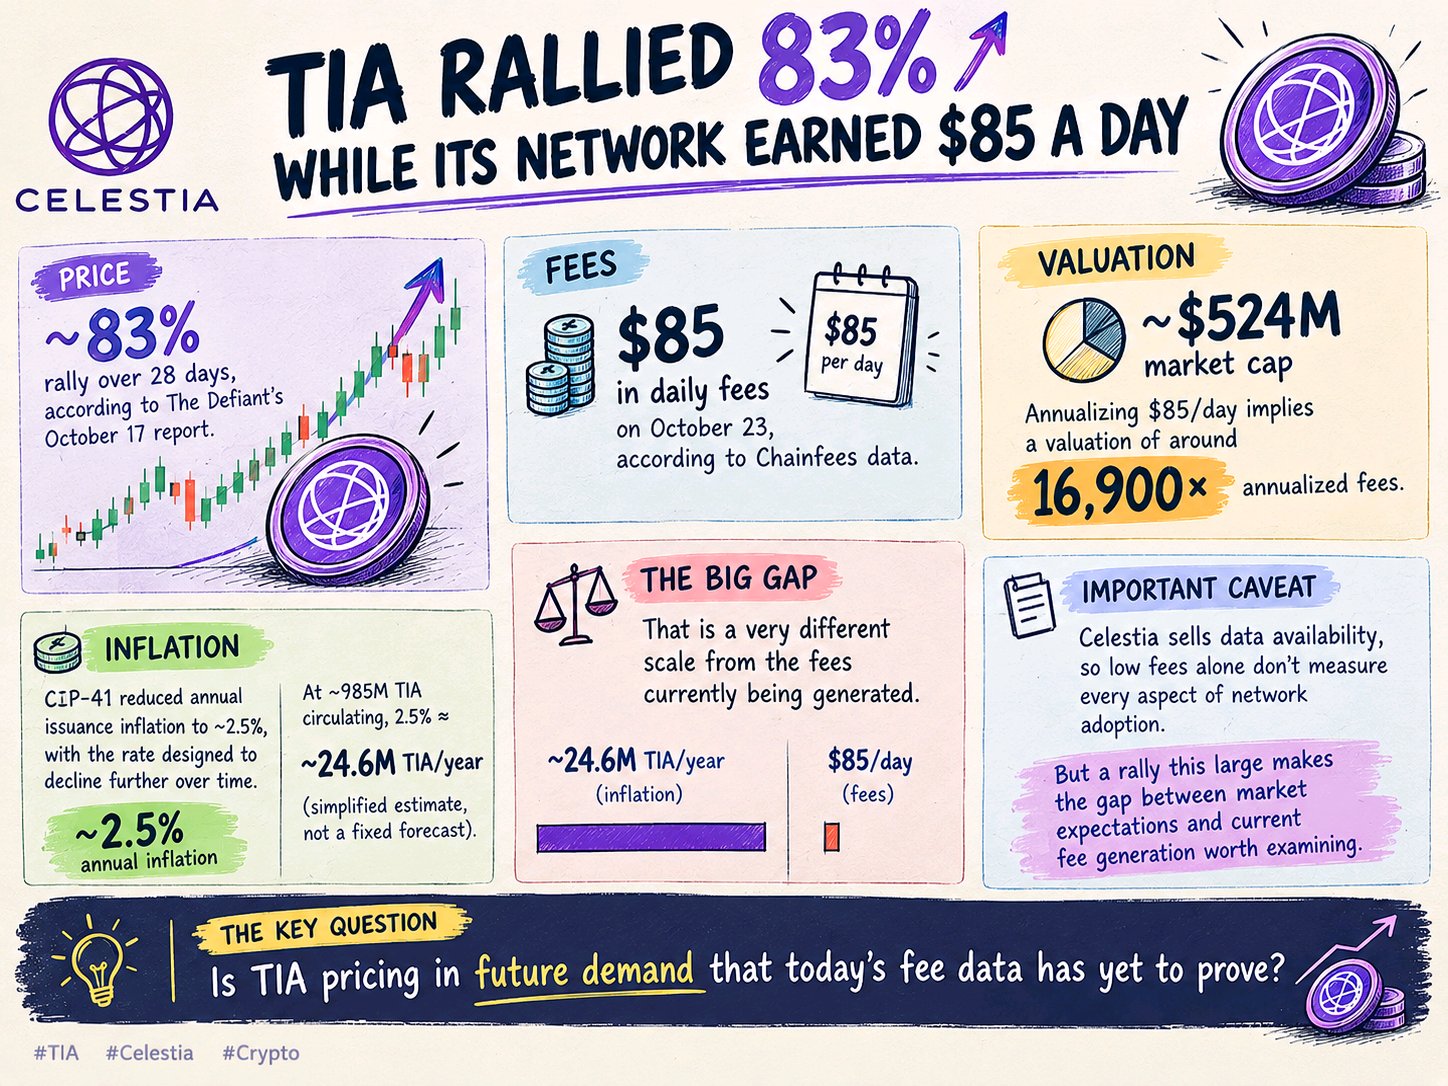
TIA Rallied 83% While Its Network Earned $85 a Day
Celestia’s token rallied roughly 83% in 28 days But network fees tell a very different story. 📈 PRICE: ~83% rally over 28 days, according to The Defiant’s October 17 report 💸 FEES: Just $85 in daily fees on October 23, according to Chainfees data 📊 VALUATION: At roughly $524M market cap, annualizing $85/day implies a valuation of around 16,900× annualized fees 🪙 INFLATION: CIP-41 reduced annual issuance inflation to approximately 2.5%, with the rate designed to decline further over time. At ~985M $TIAUSDT circulating, 2.5% represents roughly 24.6M TIA/year as a simplified estimate—not a fixed issuance forecast. That is a very different scale from the fees currently being generated. One important caveat: Celestia sells data availability, so low fees alone do not measure every aspect of network adoption. But a rally this large makes the gap between market expectations and current fee generation worth examining. The key question: is TIA pricing in future demand that today’s fee data has yet to prove? #ByXIMPACT #MyByXTake
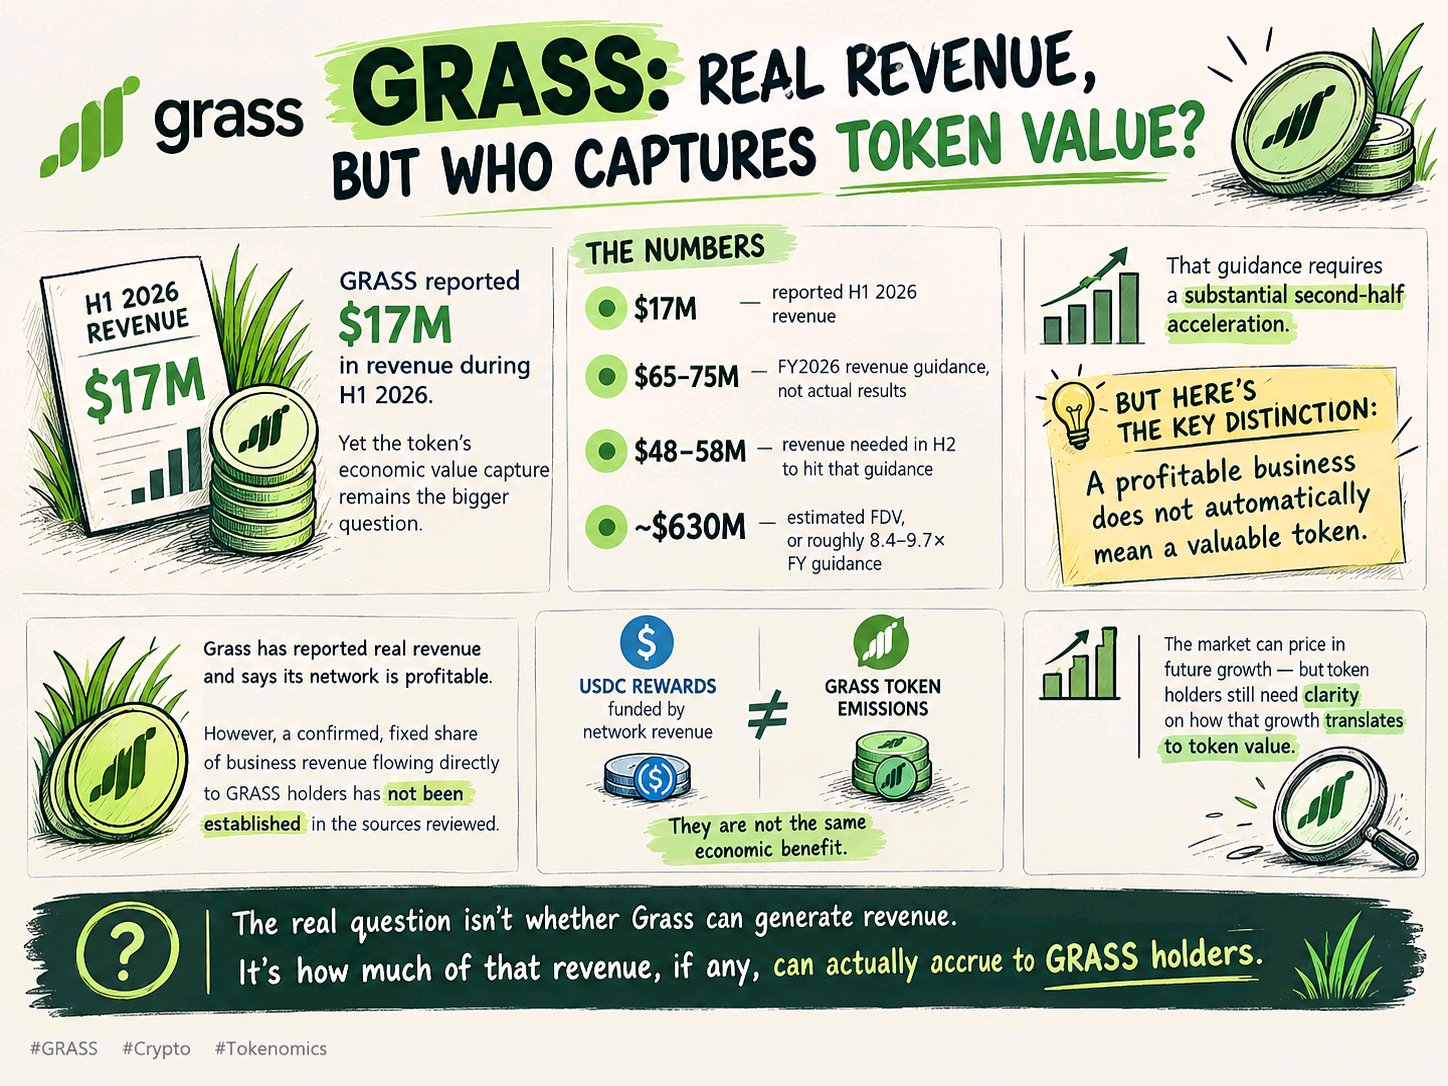
GRASS: Real Revenue, But Who Captures Token Value?
$GRASSUSDT reported $17M in revenue during H1 2026 Yet the token’s economic value capture remains the bigger question. Here’s what the numbers say: • $17M — reported H1 2026 revenue • $65–75M — FY2026 revenue guidance, not actual results • $48–58M — revenue needed in H2 to hit that guidance • ~$630M — estimated FDV, or roughly 8.4–9.7× FY guidance That guidance requires a substantial second-half acceleratio. But here’s the key distinction: A profitable business does not automatically mean a valuable token. Grass has reported real revenue and says its network is profitable. However, a confirmed, fixed share of business revenue flowing directly to GRASS holders has not been established in the sources reviewed. There’s also a difference between USDC rewards funded by network revenue and GRASS token emissions. They are not the same economic benefit. The market can price in future growth—but token holders still need clarity on how that growth translates into token value. The real question isn’t whether Grass can generate revenue. It’s how much of that revenue, if any, can actually accrue to GRASS holders. #ByXIMPACT #MyByXTake
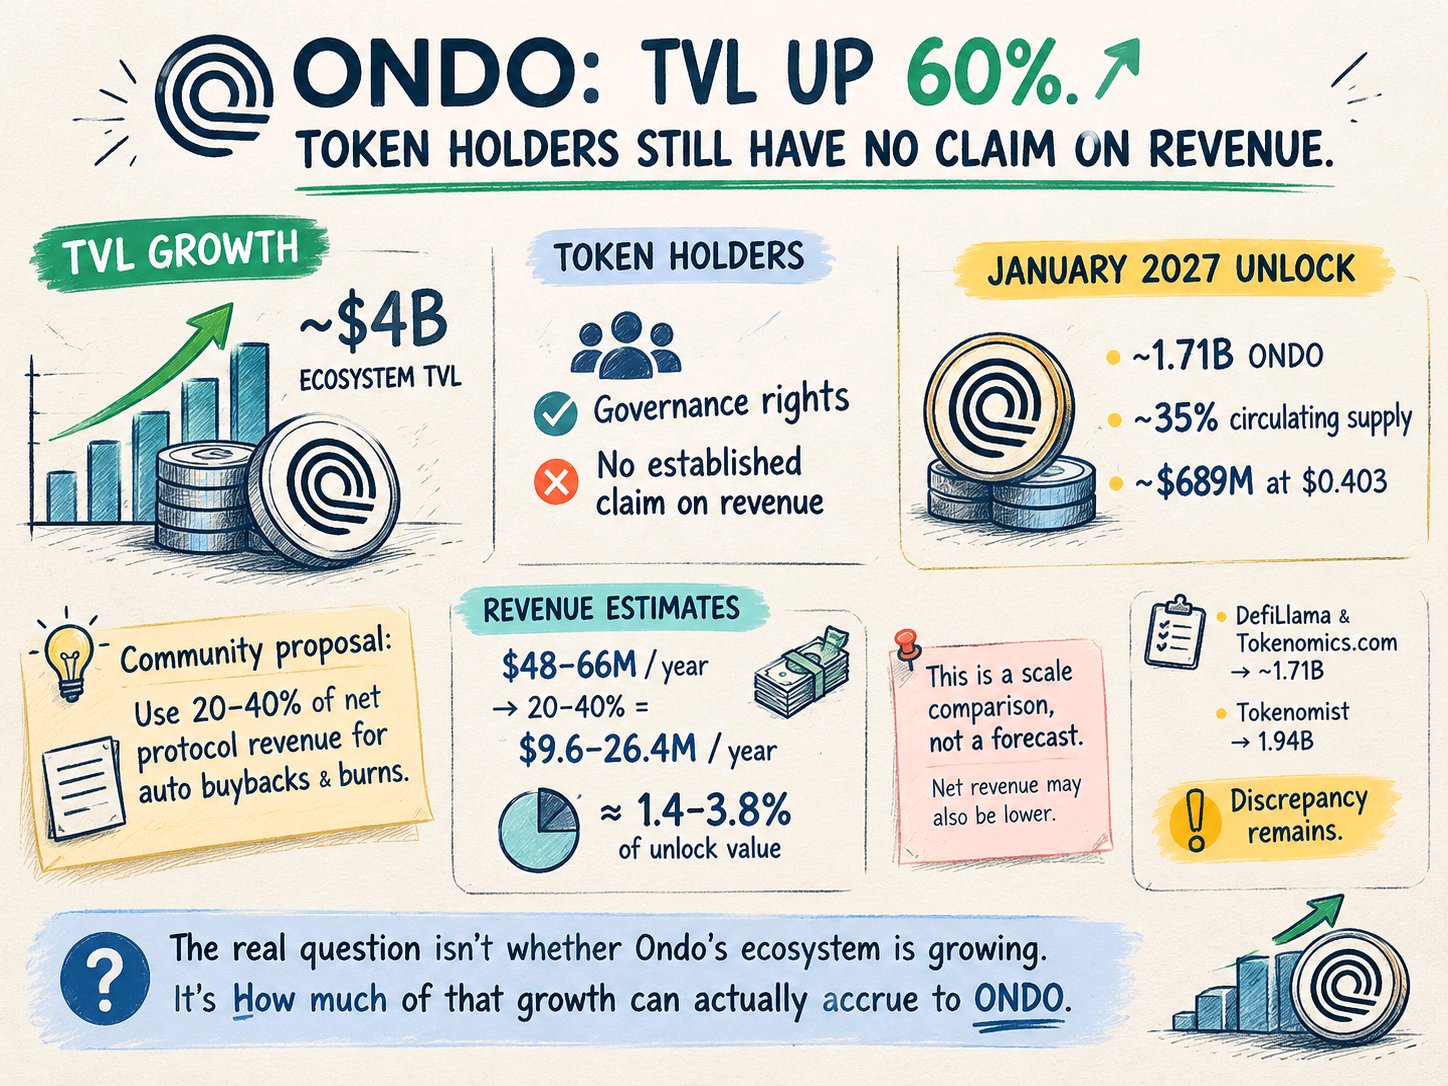
ONDO: TVL UP 60% TOKEN HOLDERS STILL HAVE NO CLAIM
Ondo’s ecosystem TVL has reportedly grown to ~$4B But $ONDOUSDT holders currently have governance rights—not an established claim on protocol revenue Now consider the January 2027 unlock: • ~1.71B ONDO • ~35% of circulating supply • ~$689M at $0.403 DefiLlama and Tokenomics.com support the ~1.71B figure. Tokenomist lists 1.94B, so the discrepancy remains unresolved A community member proposed using 20–40% of net protocol revenue for automated buybacks and burns. But that thread is a non-binding temperature check—not an approved or active fee switch Even using third-party annual revenue estimates of $48–66M, a hypothetical 20–40% allocation would equal roughly $9.6–26.4M per year—about 1.4–3.8% of the reported unlock’s dollar value That is a scale comparison, not a forecast of selling or price impact. Net revenue may also be lower than those estimates The real question isn’t whether Ondo’s ecosystem is growing. It’s how much of that growth can actually accrue to ONDO TVL growth and token value capture are not the same thing. #ByXIMPACT
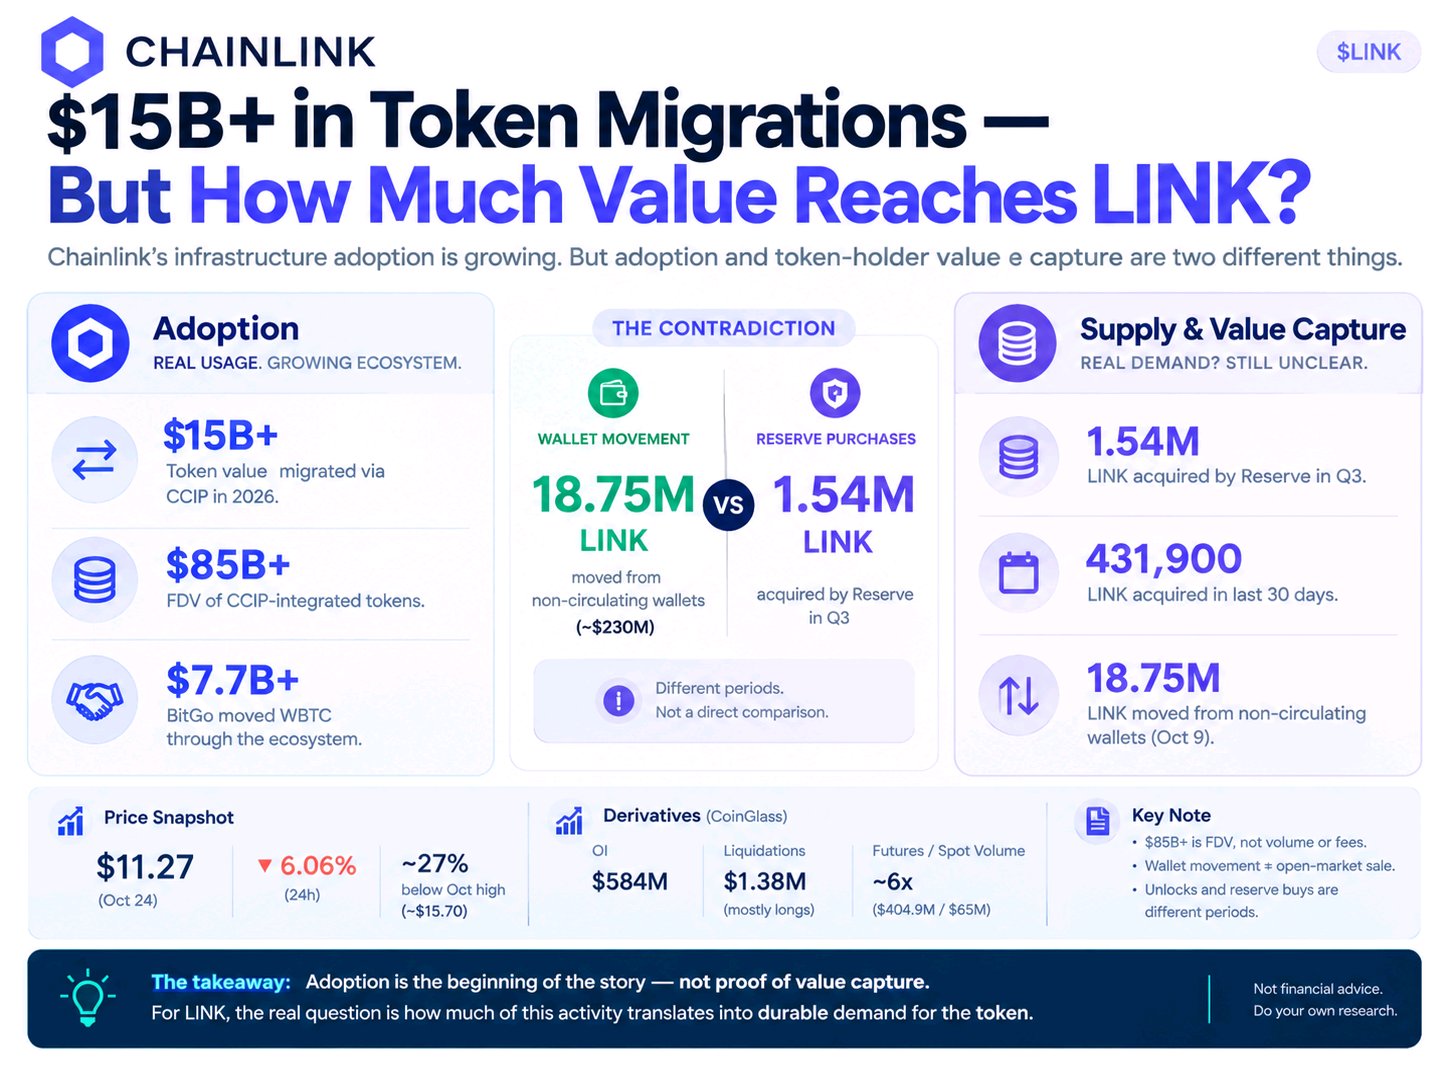
CHAINLINK $15B+ IN TOKEN MIGRATIONS
$LINKUSDT $15B+ IN TOKEN MIGRATIONS — BUT HOW MUCH VALUE FLOWS TO LINK? Chainlink’s infrastructure adoption is growing. But network adoption and token-holder value capture are two different things. Here’s the contradiction 👇 🟢 THE ADOPTION STORY • $15B+ in token value reportedly migrated through CCIP in 2026. • CCIP-integrated tokens represent $85B+ in fully diluted value. • BitGo reportedly moved $7.7B+ in WBTC through the ecosystem. These figures point to growing infrastructure adoption. But there’s a crucial distinction: $85B in integrated-token FDV is not transaction volume, revenue, or fees generated by Chainlink. 🔴 THE VALUE-CAPTURE QUESTION • Chainlink Reserve reportedly acquired 1.54M LINK during Q3. • Another reported 30-day snapshot showed 431,900 LINK acquired. • On October 9, 18.75M LINK reportedly moved from non-circulating wallets—around $230M at the reported valuation. That token movement was roughly 12× the Reserve’s reported Q3 purchases and 43× its reported 30-day purchases. However, these figures cover different periods. Wallet outflows also do not automatically mean tokens were sold. ⚖️ THE REAL CONTRADICTION Chainlink can expand its role in tokenized assets and cross-chain infrastructure without that adoption translating proportionally into immediate LINK buying. The key questions are: • How much actual fee demand does adoption generate? • How much of that demand translates into LINK purchases? • How does new circulating supply compare with sustained demand? 📉 PRICE CONTEXT LINK was reported near $11.27 on October 24—roughly 27% below its October high near $15.70. That decline does not prove weak adoption caused the price move. It highlights the difference between infrastructure growth and token performance. THE TAKEAWAY Adoption is the beginning of the story—not proof of value capture. For LINK, the metric to watch is not just how much infrastructure Chainlink connects, but how that activity translates into durable demand for the token. Figures are source-reported and cover different periods. Token transfers are not necessarily sales. Not financial advice. #ByXIMPACT #MyByXTake
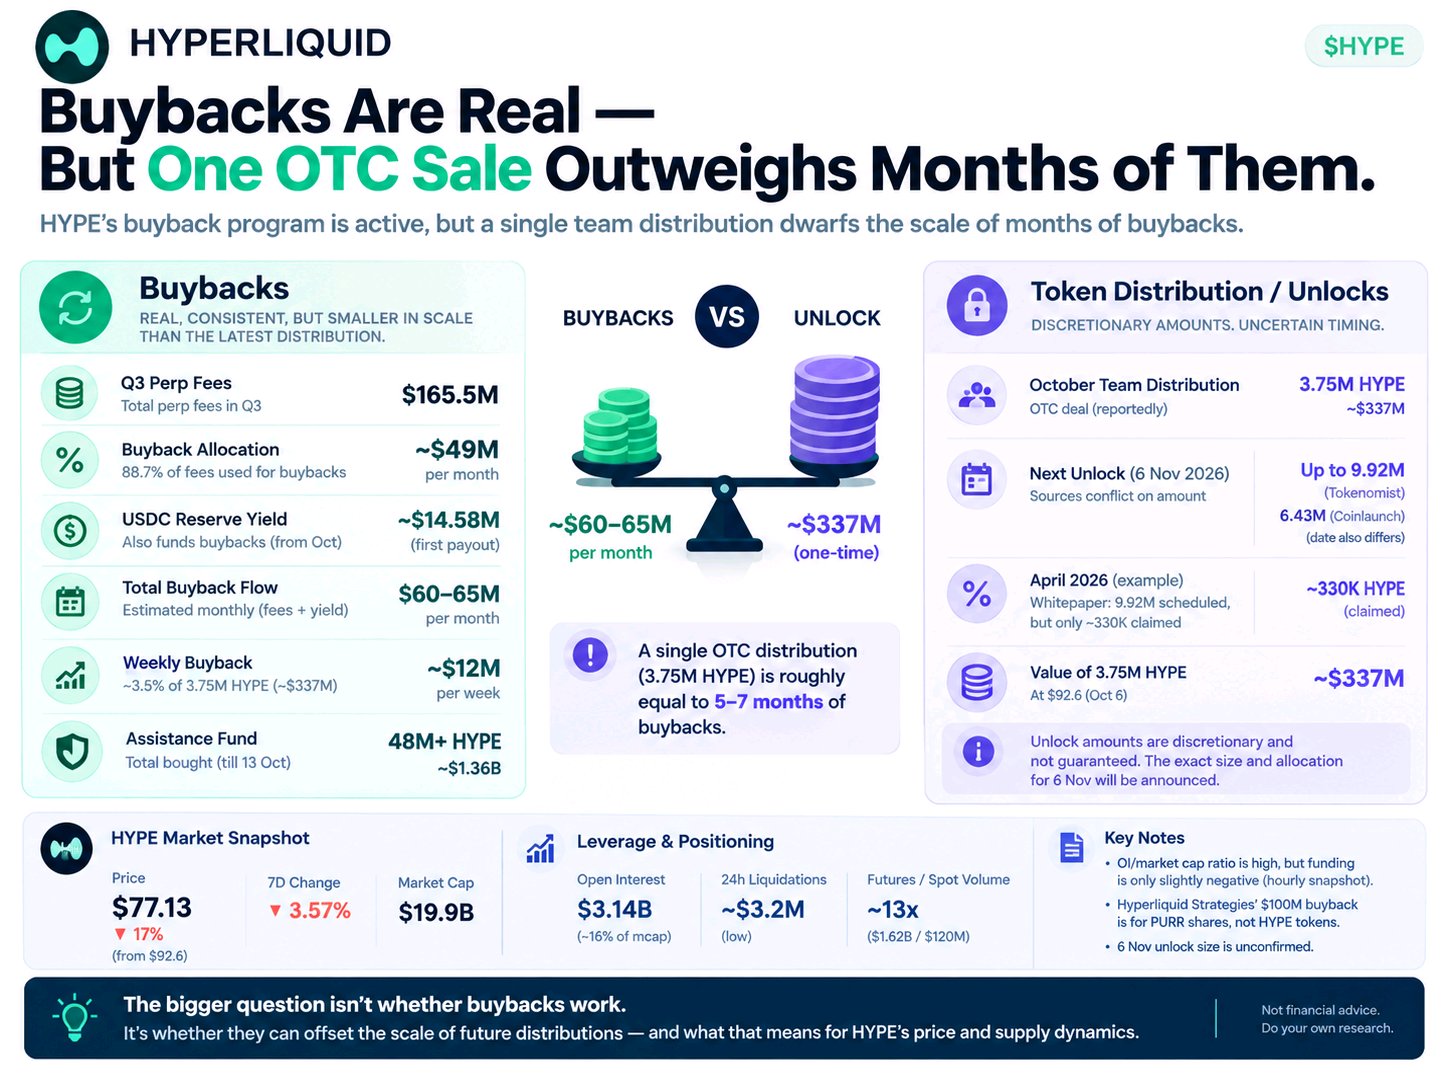
HYPE $60M+ Monthly Buybacks
$HYPEUSDT : $60M+ in Monthly Buybacks — Yet Price Is Down 23% From Its Peak. Hyperliquid has a real buyback engine. But is it large enough to offset the scale of token distributions? Here’s the contradiction 👇 🟢 THE BUYBACK ENGINE • Q3 perpetual trading fees: $165.5M • 88.7% allocated to open-market HYPE buybacks • Estimated fee-funded buybacks: ~$49M/month • USDC reserve yield adds another source of buyback funding • Estimated combined buyback flow: ~$60–65M/month 🔴 THE SUPPLY CHALLENGE • On October 6, 3.75M HYPE reportedly changed hands in an OTC team distribution. • Reported value: ~$337M at the time. • That’s equivalent to roughly 5–7 months of estimated buyback funding. • HYPE has since fallen from ~$92.60 to ~$77.13. ⚖️ THE REAL CONTRADICTION Buybacks create market demand—but a large token distribution can represent a much bigger flow of supply. One important distinction: the reported OTC transaction was not necessarily an open-market sale. And the price decline alone does not prove that the distribution caused the drop. 📊 WHAT THE MARKET DATA ADDS • Open interest: ~$3.14B • Market cap: ~$19.9B • OI / market cap: ~16% • 24h liquidations: ~$3.2M • Futures volume: ~$1.62B vs ~$120M spot volume Despite the price weakness, reported liquidations were relatively small. This snapshot does not show a major leverage flush. THE TAKEAWAY HYPE’s buybacks are substantial—but buyback size alone cannot determine price direction. The key variables are how much supply actually reaches the market, when it arrives, and whether sustained demand can absorb it. Buybacks are real. The question is whether demand can keep pace with supply. Figures are source-reported snapshots and estimates. Unlock schedules are not guaranteed claims or confirmed market sales. Not financial advice. #ByXIMPACT #MyByXTake
BTC vs ETH: The Leverage Imbalance the Market
Bitcoin and Ethereum both came under pressure, but the positioning data reveals a deeper difference. 📉 $BTCUSDT : Down 1.9% 📉 $ETHUSDT : Down 3.8% During the sell-off, reported 24-hour liquidations reached roughly $815M across crypto. ETH liquidations were surprisingly close to BTC’s—even though ETH’s market cap was only around 18% of Bitcoin’s The bigger signal is open interest relative to market size: • BTC: $27.9B OI / $1.6T market cap ≈ 1.7% • ETH: $15.7B OI / $286B market cap ≈ 5.5% That puts ETH’s OI-to-market-cap ratio at roughly 3.2× BTC’s Account positioning adds another layer: 75.9% of ETH accounts were long, compared with 68.7% for BTC Funding, however, was only mildly positive—so this isn’t a simple “extreme funding” story The real risk: ETH carries significantly more open interest relative to its market size. If selling resumes, crowded long positioning could amplify volatility The key question isn’t which asset fell more It’s whether ETH’s leverage clears faster—or continues to magnify every move OI and account-positioning figures are source-specific snapshots, not a complete measure of leverage across every exchange #ByXIMPACT #MyByXTake
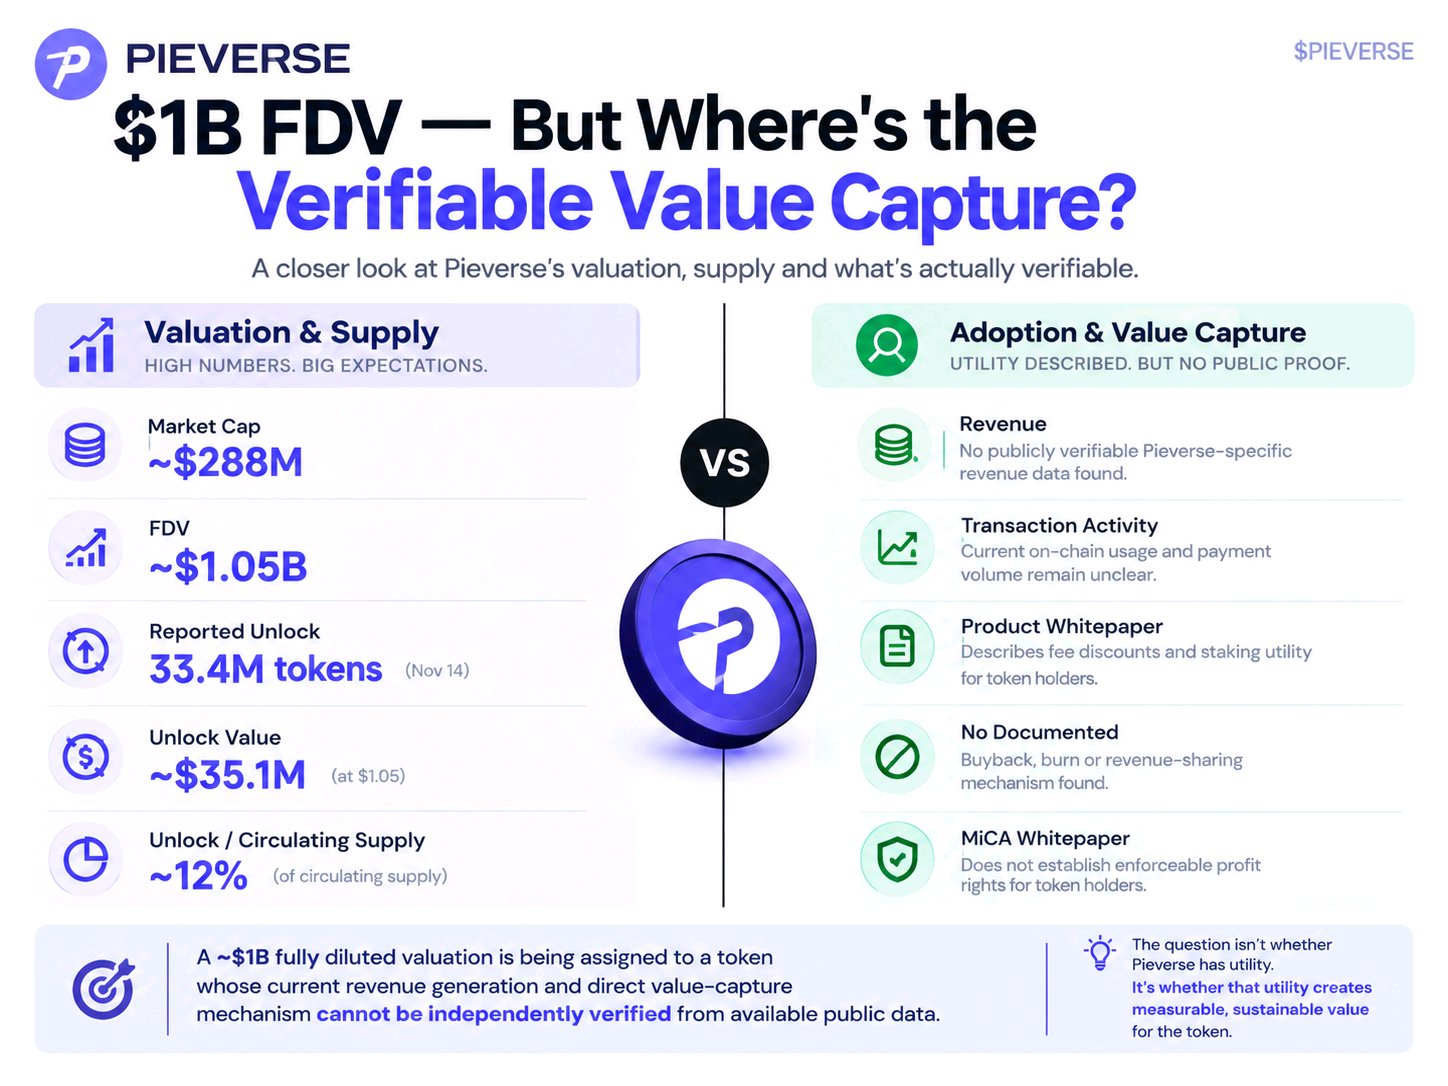
$1B FDV— But Where’s the Verifiable Value Capture?
🧩 $PIEVERSEUSDT has a valuation story worth questioning. 📊 VALUATION & SUPPLY • Market cap: ~$288M • FDV: ~$1.05B • Reported unlock: 33.4M tokens • Unlock value: ~$35.1M at $1.05 • Equivalent to ~12% of circulating supply ⚖️ ADOPTION & TOKEN VALUE • No publicly verifiable Pieverse-specific revenue found • Current transaction activity and payment volume remain unclear • The product whitepaper describes fee discounts and staking utility • But no documented buyback, burn, or revenue-sharing mechanism was found • The MiCA whitepaper does not establish enforceable profit rights for token holders The real contradiction? A ~$1B fully diluted valuation is being assigned to a token whose current revenue generation and direct value-capture mechanism cannot be independently verified from available public data. That does not prove the project has no revenue or adoption. It means investors still need clearer evidence connecting product usage to token demand. The reported November unlock adds another risk—but an unlock is not an automatic sell order, and its exact size and allocation still need confirmation. The question isn’t whether Pieverse has utility. It’s whether that utility creates measurable, sustainable value for the token. Until that link becomes clearer, valuation is easier to observe than value capture. #ByXIMPACT #MyByXTake
📣 LINK: CHAINLINK IS WINNING ADOPTION
$LINKUSDT CHAINLINK IS WINNING ADOPTION. BUT HOW MUCH VALUE FLOWS TO THE TOKEN? Chainlink’s Q3 2026 update revealed an important shift → $15B+ in token value migrated to CCIP during 2026. → CCIP reached $85B+ in total cross-chain token value during Q3. → Chainlink Reserve surpassed 6M LINK, accumulating tokens using offchain enterprise revenue and onchain service revenue But here’s the part worth watching More adoption does not automatically mean proportionally more value for LINK holders Why? 1️⃣ CCIP volume measures value transferred, not revenue earned 2️⃣ The Reserve converts eligible revenue into LINK, creating a direct economic link between network activity and token demand 3️⃣ But Reserve accumulation is not a token burn or a direct dividend to holders. Its long-term impact depends on how much revenue flows into it as adoption grows That’s the real investment question If institutional adoption keeps expanding, will revenue-driven LINK accumulation grow enough to become a meaningful part of the token’s economics? Or will adoption continue to outpace measurable value capture? Chainlink’s infrastructure story is getting stronger. The next thing to watch is how that growth translates into sustained demand for LINK Bullish on adoption ≠ blind to token economics. #ByXIMPACT #MyByXTake