
Shugaba1717
248ლაიქი1წესები 158Fans3გამოწერა
trader
trader
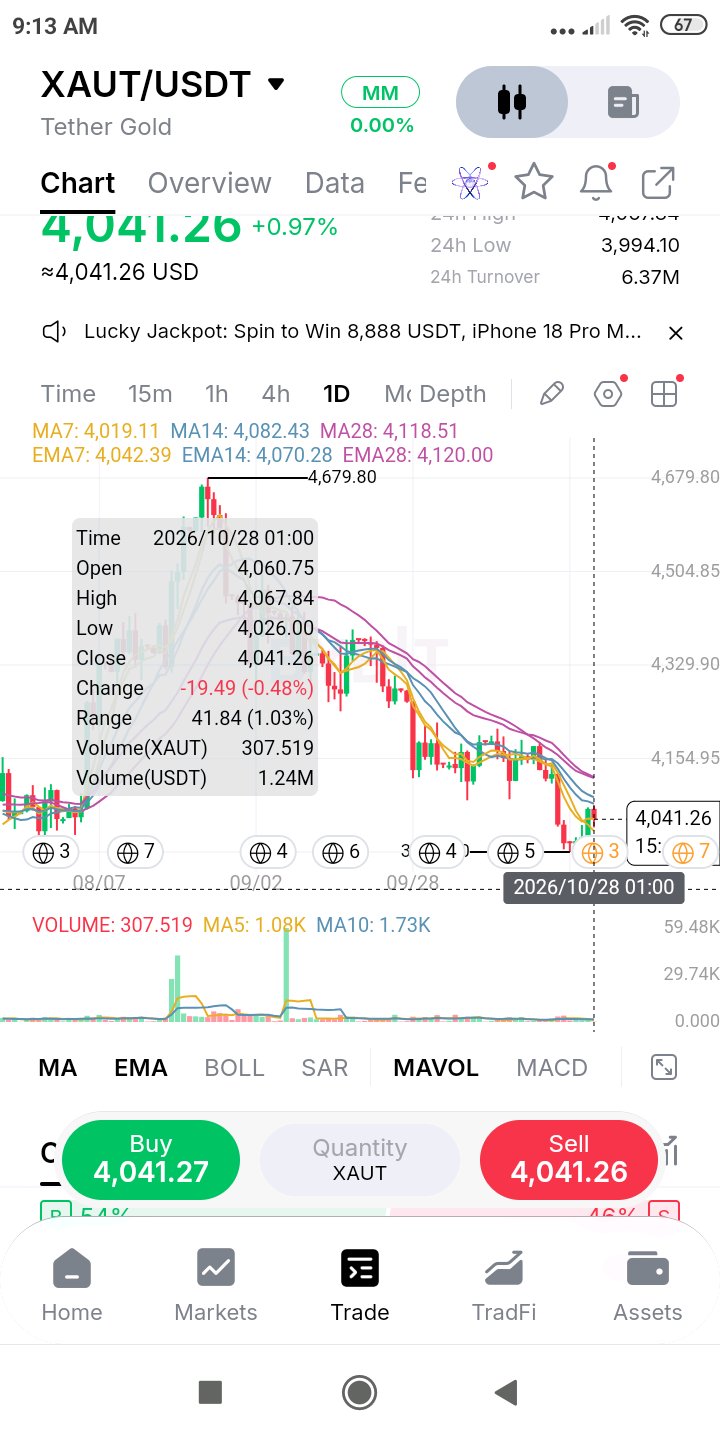
$XAUTUSDT peaked at 4,679.80 in late August and has stepped down in lower highs ever since, to a low near 3,980. It has now steadied around 4,041, above the MA7 (4,019) and sitting right on the EMA7 (4,042). Everything slower is still overhead: EMA14 4,070, MA14 4,082, MA28 4,119 and EMA28 4,120. Volume vs turnover: Volume counts XAUT traded and turnover counts the USDT value. At around 4,000 per token, 300 XAUT is already more than 1.2M USDT, so small-looking volume numbers still carry real money. Turnover is about 6.4M USDT over 24h. What stands out is the shape: there were huge green volume spikes in late August and September, while this whole decline has printed bars that barely register. A slide on thin volume means few sellers pushing, but also few buyers stepping in. A base here is quiet and needs a genuine volume day before I'd call it confirmed. Levels: Resistance: 4,068 (today's high), 4,070-4,082 (EMA14 and MA14), 4,119-4,120 (MA28 and EMA28 overlap), then roughly 4,350-4,400 where the last bounce stalled. Support: 4,026 (today's low), 3,994 (24h low), 3,980 (the low of this leg). Key level: 4,120. A daily close above it puts price over every average for the first time in this decline. Until then, each rally into the 4,070-4,120 band is a test, not a trend change. Trade logic and risk: Buying here risks about 1.5% to the 3,980 low for roughly 1% to the MA14 or 1.9% to the 28s. That's not enough. Waiting for a daily close over 4,120 gives up some of the move, but from about 4,125 a run to 4,350-4,400 is 5-7% up against roughly 3.5% to the low, around 1.6-1.9:1. A daily close under 3,980 removes the base, and I can't mark any support beneath it on this chart. Consideration: Gold reacts to dollar and yield headlines, and a headline can overrule a chart. The daily candle is also still forming. Quiet charts get loud eventually. I'd rather wait for that candle than predict it. #ByXIMPACT
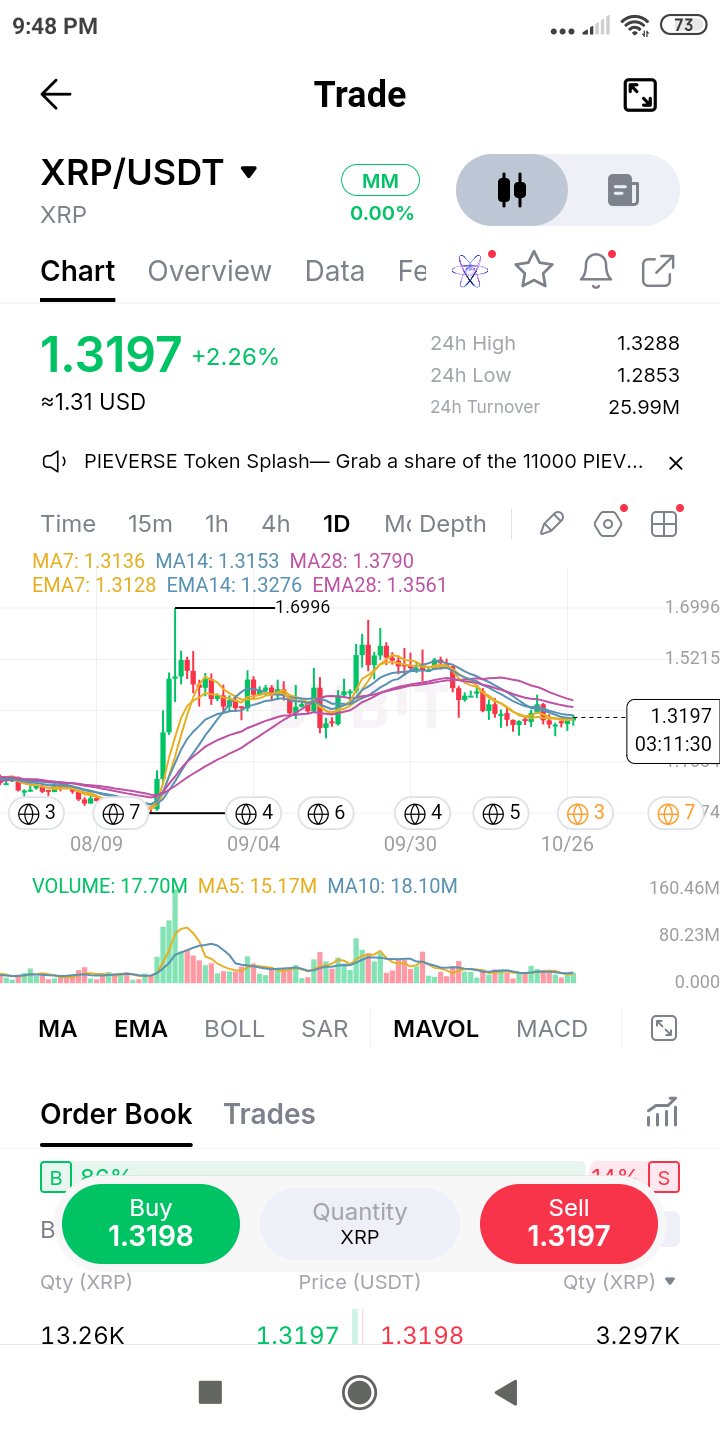
$XRPUSDT Look past the daily noise and focus on the structure. After that massive impulsive run to 1.6996 back in July, XRP has been chopping sideways for months. But the technicals are getting extremely tight, right at the 1.31 level. The Moving Average Squeeze: This is the most important detail on the chart. Look at the MA7 (1.3136), EMA7 (1.3128), and EMA14 (1.3276). They are practically trading as a single flat line. The price is completely tangled in them. When moving averages converge this tightly after a long consolidation phase, it means the market is running out of energy to chop. A breakout (in either direction) is usually violent. Volume vs Turnover: The 24h turnover is a healthy 25.99M, showing there is still liquidity here. But look at the volume pane. The current daily volume (17.70M) is basically matching the MA5 (15.17M) and sitting below the MA10 (18.10M). The volume isn't dead, but it's unenthusiastic. It’s a waiting game. Levels: Resistance: 1.3276 (EMA14). A daily close above this is the first sign of life. The real ceiling is the MA28 at 1.3790. Support: 1.2853 (the 24h low). Below that, the structural floor is around 1.2500. Trade logic: The risk-to-reward here heavily favors waiting for the trigger. Because the price is coiled so tightly, the stop loss on a breakout trade can be placed extremely tight. If we get a daily close above 1.33 with a volume spike, you can long it with a stop right below the moving average cluster (around 1.30). That’s a 2% risk for a potential run back toward the 1.45+ zone. Conversely, if it breaks below 1.28, the compression has failed, and we likely sweep the lower 1.20s. What could go wrong: The longer an asset consolidates, the more likely it is to fake out. A sudden spike to 1.35 that immediately rejects and closes back at 1.31 is a classic liquidity grab. Wait for the candle to *close*, not just the wick. Analysis, not a recommendation. Plan the exit before the entry. #ByXIMPACT
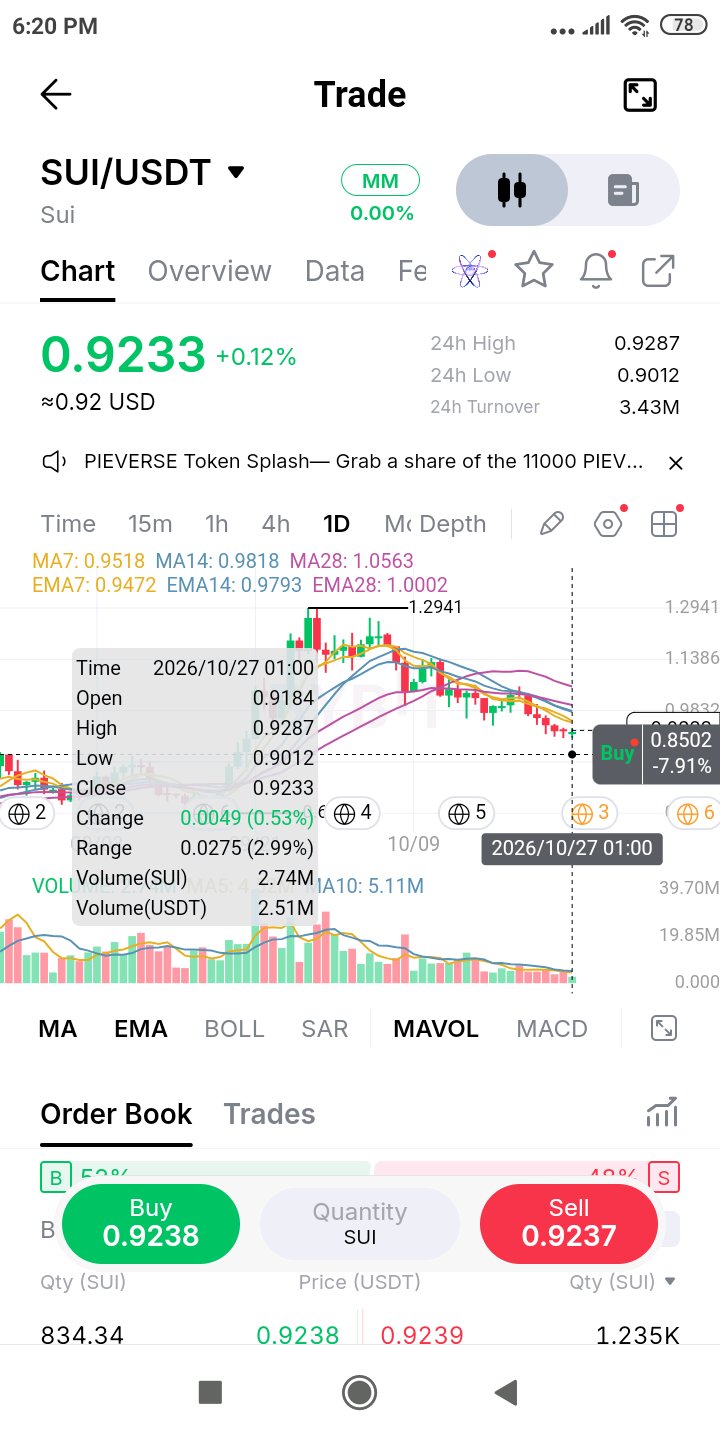
$SUIUSDT has been printing a brutal sequence of lower highs and lower lows. We are currently hovering at 0.9233 (+0.12%), but the daily structure is heavily compromised. The Bearish MA Fan: Look at the moving averages. They are fanned out perfectly bearish. The price is trapped underneath a heavy ceiling of resistance: MA7 (0.9518), MA14 (0.9818), and the EMA14 (0.9793). Above that, the MA28 (1.0563) and EMA28 (1.0002) sit far out of reach. The 1.00 psychological level is now massive overhead resistance. The Volume Void: This is the most concerning metric on the chart. The 24h Turnover is just 3.43M. Look at the current daily volume: 2.74M SUI (2.51M USDT). The volume MA5 (5.11M) and MA10 are sloping down hard, sitting way above the current daily activity. There is zero institutional or whale participation here. The market is bleeding out on low volume, meaning there is no aggressive buyer stepping in to catch the knife. Levels: Resistance: 0.9518 (MA7) and 0.9793 (EMA14). Support: 0.9012 (Current 24h low / local floor). Trade logic: Do not front-run a reversal here. The risk-to-reward for a long is terrible because overhead resistance is clustered right above current price. To find a valid long, I need to see a capitulation sweep of the 0.9012 low, followed by a massive volume spike and a daily close reclaiming the 0.9518 level. Anything less is just a dead-cat bounce that will get sold off. If you are trading this, a short from a rejection near 0.95 targeting the 0.9012 lows is the only logical structure until proven otherwise. What could go wrong: Low volume means the order book is thin. A sudden market-wide pump (e.g., BTC breaking local highs) could easily cause a violent short squeeze here because there aren't enough sellers to absorb a sudden bid. If you are short, keep your stops tight above the MA7. Analysis, not a recommendation. Plan the exit before the entry. #ByXIMPACT
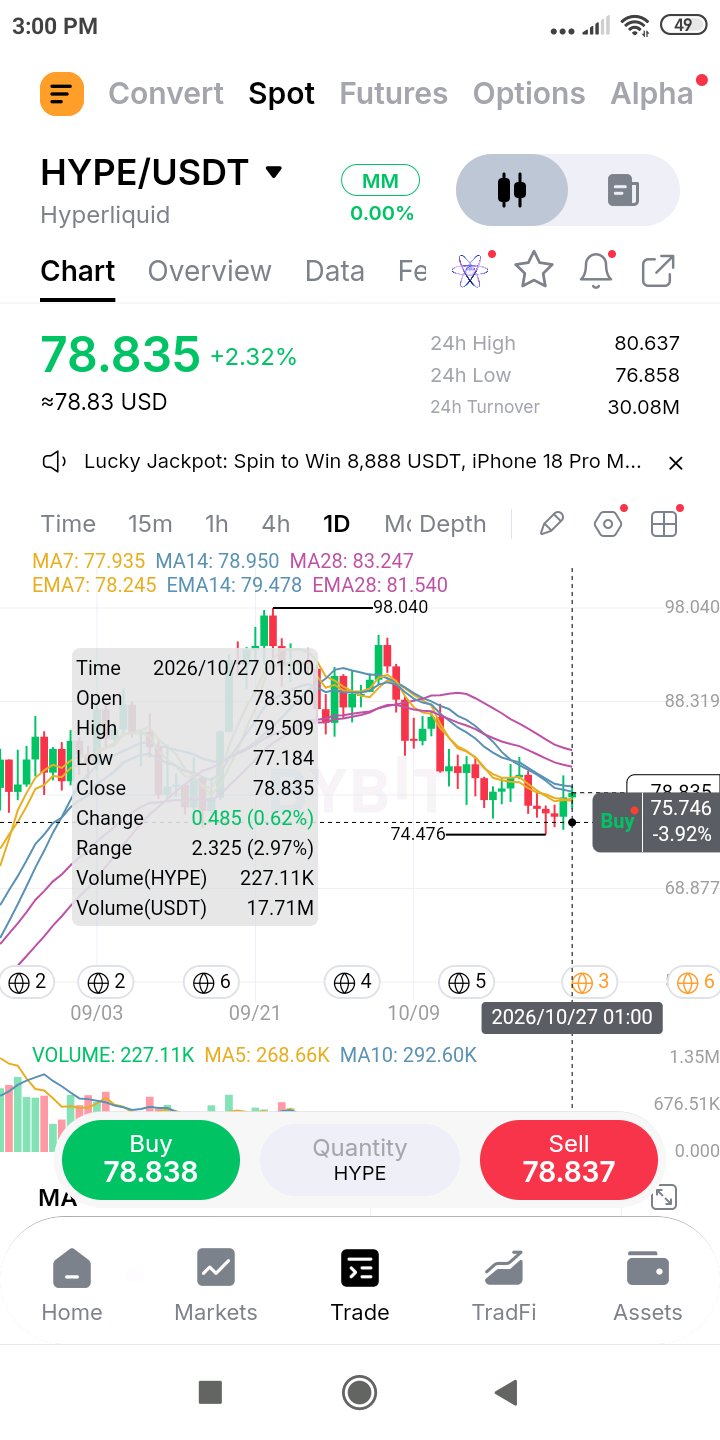
$HYPEUSDT After peaking at 98.040, HYPE has been in a heavy daily downtrend, flushing all the way down to 74.476. We are currently seeing a bounce to 78.835 (+2.32%), but this is where the structural reality sets in. The Moving Average Cluster: This isn't just a random bounce. Price is currently trapped in a dense cluster of moving averages. We are sitting right below the MA14 (78.950) and EMA14 (79.478), while the MA28 (83.247) and EMA28 (81.540) loom heavily overhead. To confirm a trend shift, bulls need to reclaim the 79.5 level and push through the 81.5-83.2 ceiling. Until then, this is just a bounce within a downtrend. Volume vs Turnover: The volume tells a cautious story. The 24h turnover is 30.08M, which is healthy, but look at the moving averages in the volume pane. The MA5 (268.66K) and MA10 (292.60K) are sitting above the current daily volume (227.11K). The bounce is happening on lower-than-average volume. That is the definition of a relief rally—buyers are stepping in, but they aren't showing conviction with size. The line that matters: 79.50. A daily close above this flips the immediate short-term structure back to the bulls. A rejection here confirms the lower high and likely sends us back to test the 74.476 floor. Trade logic: There is no edge buying into this resistance cluster. The risk-to-reward is poor because the stop loss (below 74.476) is nearly 6% away, while the immediate upside target is only to the MA28 at 83.247 (about 5.5% up). The play is to wait. If we reject the 79.5 area, it's a clean short setup targeting a retest of the 74.476 lows. If we get a confirmed daily close above 83.2 with a volume spike, then the trend has actually shifted, and we look for longs on the retest. What could go wrong: If BTC suddenly rips, HYPE will get dragged through these moving averages regardless of its own volume. Thin bounces can become violent short squeezes if the market catches a bid. Always define your invalidation before clicking the button. Analysis, not a recommendation. Plan the exit before the entry. #ByXIMPACT
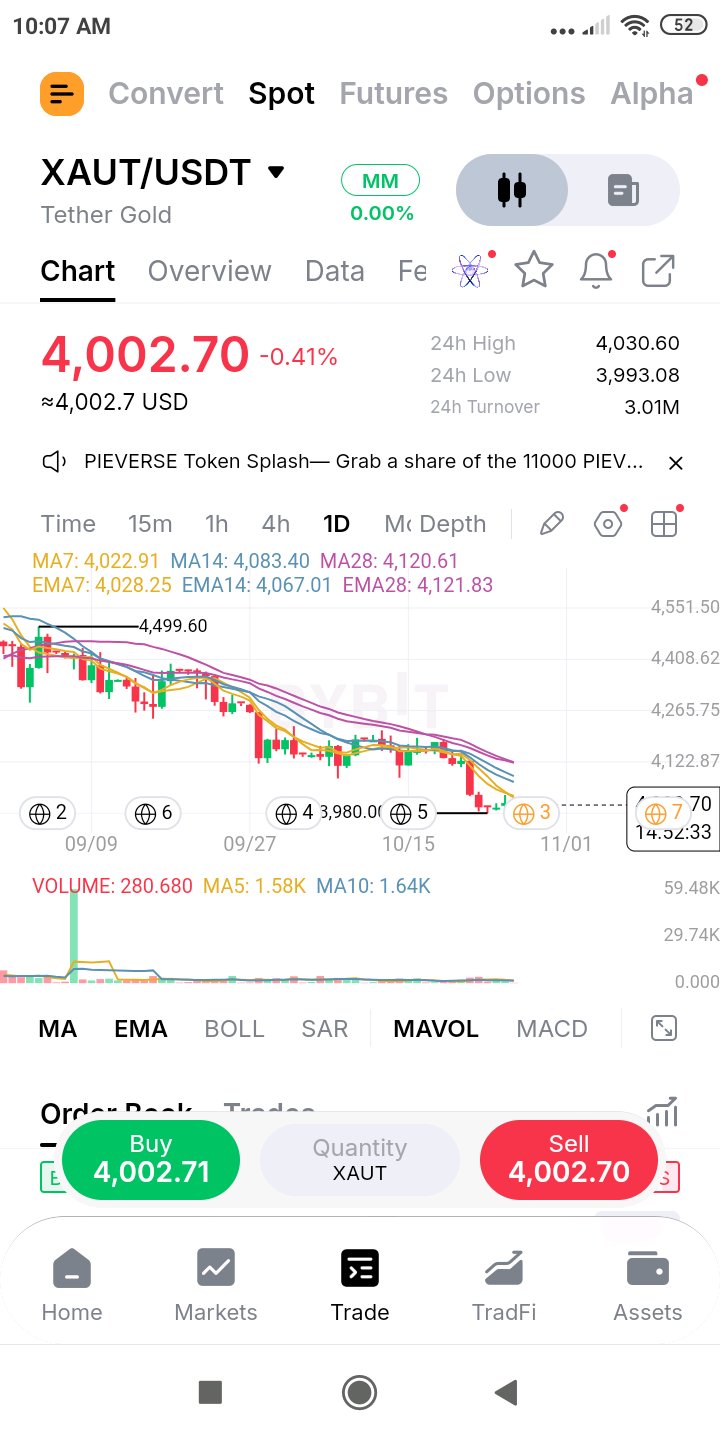
$XAUTUSDT After bleeding down from the 4,499 highs, price found a temporary floor at 3,980. We bounced, but the recovery has completely lost its legs. We are currently at 4,002.70, struggling to hold the 4,000 psychological level. The Volume Void: Look at the volume pane at the bottom. This is the most concerning part of the chart. The volume is practically dead. The 24h Turnover is sitting at just 3.01M. The current daily candle shows 280.68 volume, while the MA5 sits at 1.58K and MA10 at 1.64K. There is zero buying pressure stepping in. A market cannot reverse a downtrend without participation. This is a slow bleed. The Resistance Wall: The moving averages are stacked heavily against us. The daily MA7 (4,022.91) and EMA7 (4,028.25) are acting as immediate overhead resistance, pressing the price down. Above that, the MA14 (4,083.40) and MA28 (4,120.61) form a ceiling. Levels: Resistance: 4,028 (EMA7) and 4,083 (MA14). Support: 3,993 (24h low) and the critical structural floor at 3,980. Trade logic: There is no edge buying this right now. The price is coiled tight against the 4,000 level with no volume to push it through the overhead moving averages. The play is to wait for a reaction: 1. If price sweeps 3,980 and prints a massive volume spike (capitulation), look for a long. 2. If price bounces and rejects the 4,028-4,083 zone, it is a clean short setup back toward the lows. What could go wrong: Because volume is this thin (3.01M turnover), a sudden macro headline regarding the dollar or yields can cause a massive, exaggerated spike in either direction. Thin markets are easily manipulated. Do not use wide stop losses here; the volatility will eat your margin. Analysis, not a recommendation. Plan the exit before the entry. #ByXIMPACT #MyByXTake
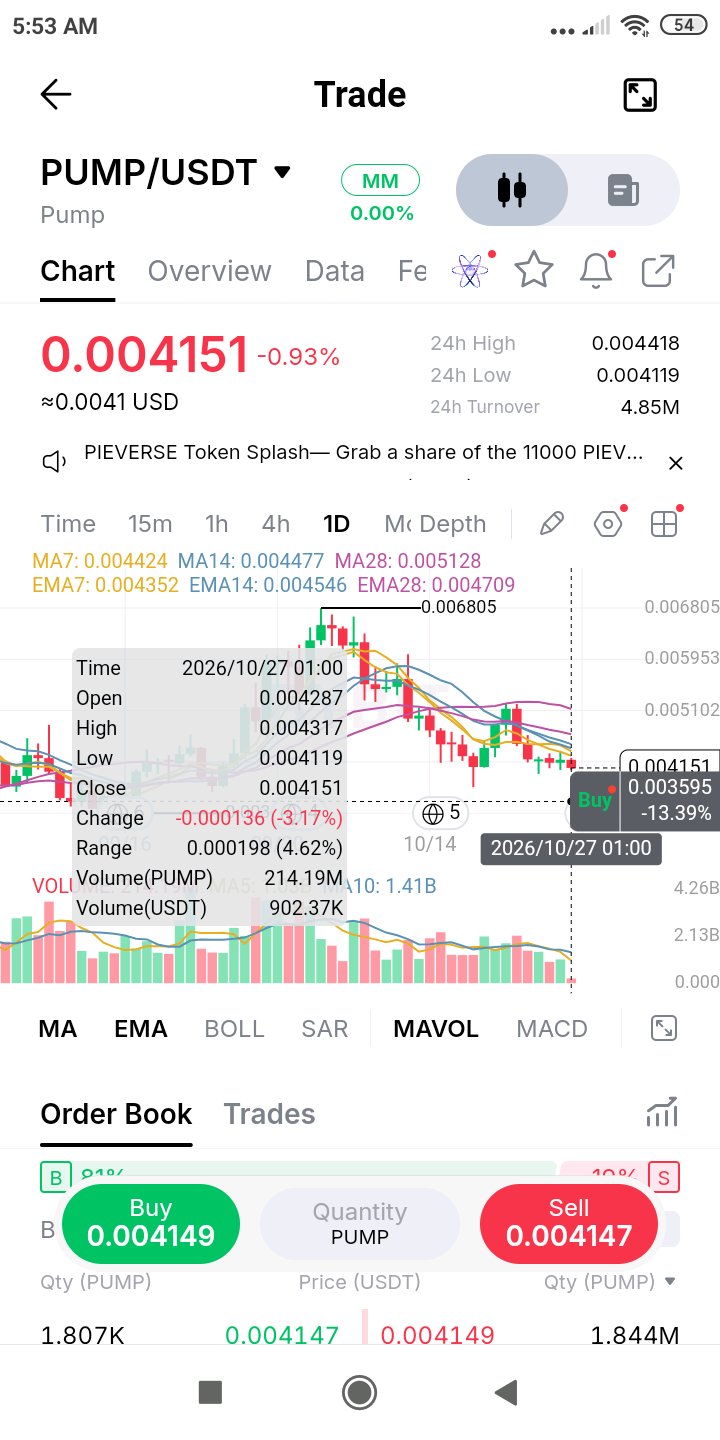
$PUMPUSDT Price peaked at 0.006805 and has been in a relentless, stair-step downtrend ever since. We are currently printing at 0.004151 (-0.93% on the day), which is essentially sitting right on the local floor of 0.004119. Volume vs turnover: Look at the volume pane. During the initial drop from the highs, we saw massive red volume spikes. But as price has continued to grind lower, the volume has completely dried up. The MA5 and MA10 volume lines are sloping down. Turnover is sitting at 4.85M for the 24h. This isn't capitulation selling anymore; it's a slow bleed of liquidity. People are losing interest. The structural problem: The moving averages are acting as a heavy ceiling. We have a clear bearish alignment: the MA7 (0.004424) is below the MA14 (0.004477), and both are far below the MA28 (0.005128). Furthermore, the EMA7 (0.004352) is capping the price action. There is no bullish crossover in sight. Levels: Resistance: 0.004352 (EMA7), then the immediate cluster at 0.004424 - 0.004477 (MA7/MA14). Support: 0.004119 (Current 24h low / local floor). A break and daily close below this level leaves a void underneath. Trade logic: There is no trade here right now. Buying this is catching a falling knife in a low-momentum environment. The risk-to-reward is terrible because overhead resistance is stacked immediately above. I need to see two things before considering a long: 1. A high-volume capitulation wick to sweep the 0.0041 lows. 2. A daily close above the 0.0044 area to break the immediate short-term structure. What could go wrong: The chart looks dead, but a sudden market-wide relief bounce on BTC could easily trigger a violent short squeeze here because the price is so thin. If you are shorting down here, you are late to the party and risking a squeeze. If you are longing, you are early. Stay patient. Let the structure build. Analysis, not a recommendation. Plan the exit before the entry. #ByXIMPACT
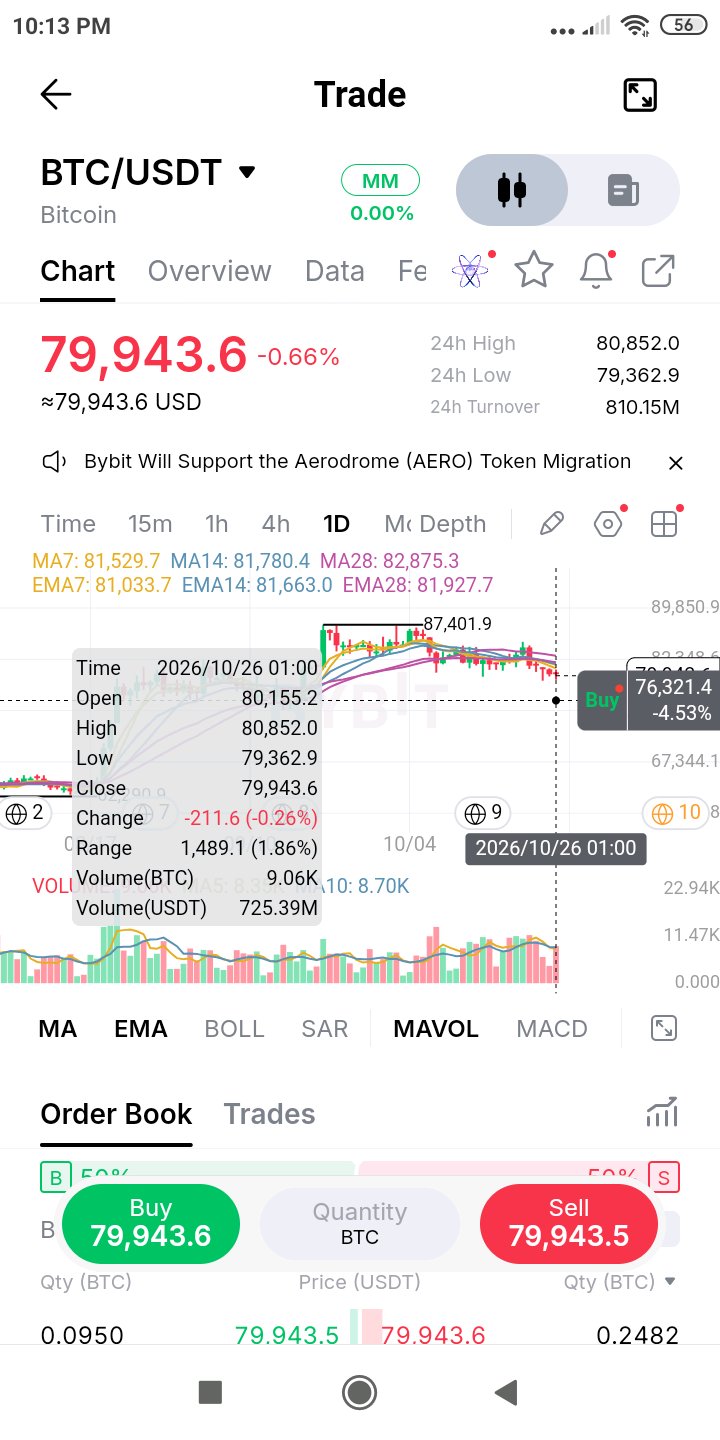
l$BTCUSDT After printing 87,401.9, BTC has slipped about 8.5% to 79,943.6. It now sits under every daily average: EMA7 81,034, MA7 81,530, EMA14 81,663, MA14 81,780, EMA28 81,928 and MA28 82,875. They're stacked in bearish order, fast below slow, and packed into a band about 2.3% wide. That whole zone, from 81.0K to 82.9K, is overhead supply. Volume and turnover: About 810M USDT has traded over 24h. Today's candle already shows 9.06K BTC, a touch above its 10-day average of 8.7K with hours left to run. Heavy turnover while price grinds down under the averages means the move is being sold, not just fading on its own. Key level: 80,000, with 79,363 beneath it BTC opened today at 80,155. Round numbers attract noise, so expect chop around 80K. 79,363 is today's low. A daily close under it prints a lower low, and that's the confirmation I'd wait for. Scenario A, reclaim: A daily close above 81,034 (EMA7) is the first sign sellers are tiring, about 1.4% away. The real tests are the 81.5-81.8K area (MA7 and MA14), and only a close above 82,875 (MA28), about 3.7% up, says the dip is over. Scenario B, break: A daily close below 79,363 and I'd expect more downside. I can't mark a clean shelf under that level on this chart. Risk The nearest downside reference is only 0.7% away, but beneath it nothing is marked, so the real risk is undefined. That argues for smaller size and a plan set before the break, not after. BTC also reacts hard to macro headlines, and a daily candle can flip in minutes. A map, not a call. #ByXIMPACT
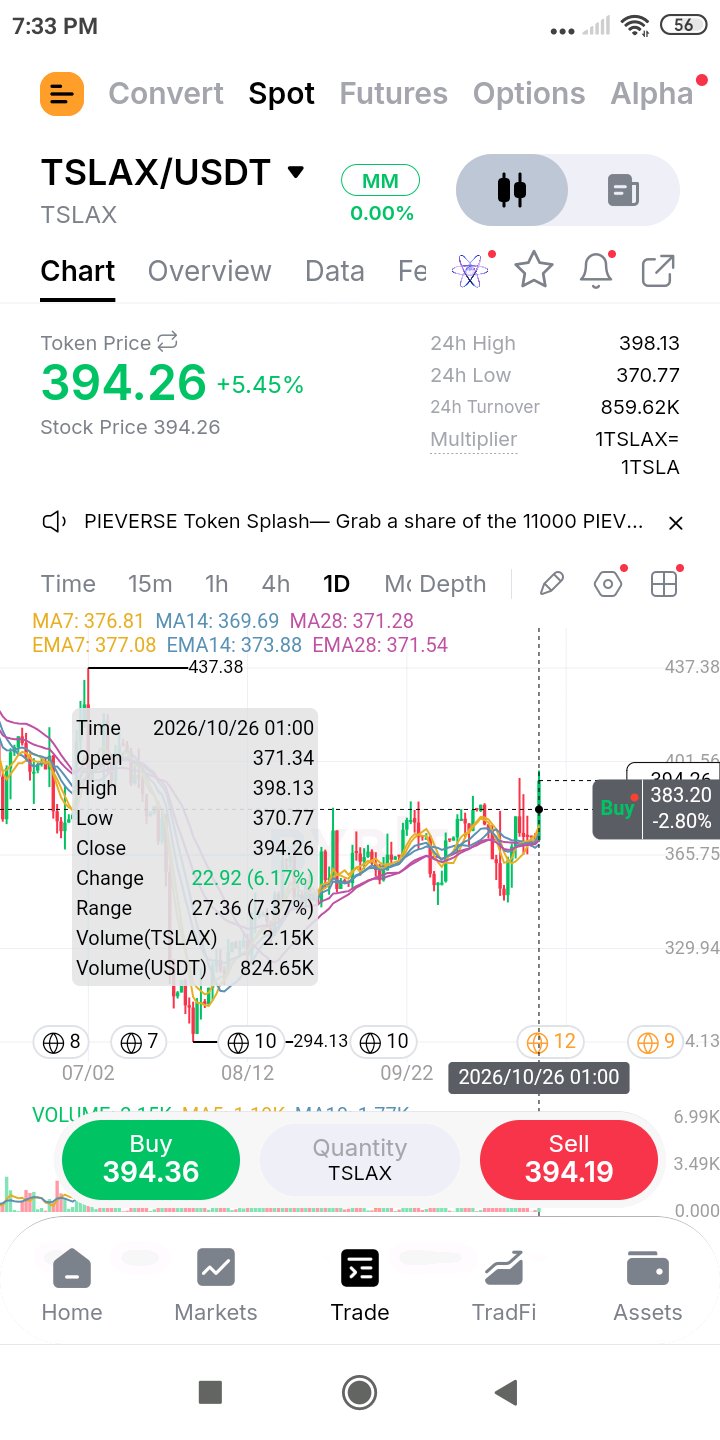
$TSLAXUSDT opened today at 371.34, inside a knot of daily averages squeezed between 369.7 and 377.1, a band only about 2% wide. It's now at 394.26: +6.2% on the day, closing in the top 15% of a 7.4% range. Context: TSLAX bottomed at 294.13 in August, fell from the 437.38 July high, and has been rebuilding in a range since. What the candle says Expansion out of compression. When averages bunch up and price leaves them in a single move, it's usually a decision, not noise. Volume backs it. Today's 2.15K TSLAX is already above both its 5- and 10-day averages, and the day isn't over. The close sits near the high, so buyers were still in control into the evening. What it doesn't say Turnover, the total USDT traded, is only about 860K over 24h. That's thin for a +6% move, so spreads and slippage matter and a breakout on this liquidity can unwind fast. The candle also still has hours to run, and a long upper wick would change the read. A few candles back, a push toward 394 left exactly that kind of wick. And TSLAX trades around the clock while the stock doesn't, so the token can drift from the share price when the US market is shut. Levels Resistance: 398.13 (today's high), 400, then the 437.38 swing high, about 11% above. Support: 377 (top of the average knot), 370-371 (today's open and low), ~347 (the recent wick low), 294.13. How I'd approach it Chasing here puts a stop under 370.77, about 6% away, for about 11% to the swing high: roughly 1.8:1. If it pulls back to 377-383 and holds, the stop tightens to about 3% against the same target, better than 4:1. The retest might never come, and that's the cost of waiting. Risk A daily close back under 377 means the breakout failed and price is back in the knot. Under 370.77 it's negated. Size for the stop, not the excitement. Chart read only, no guarantees on a stock-linked token. #ByXIMPACT
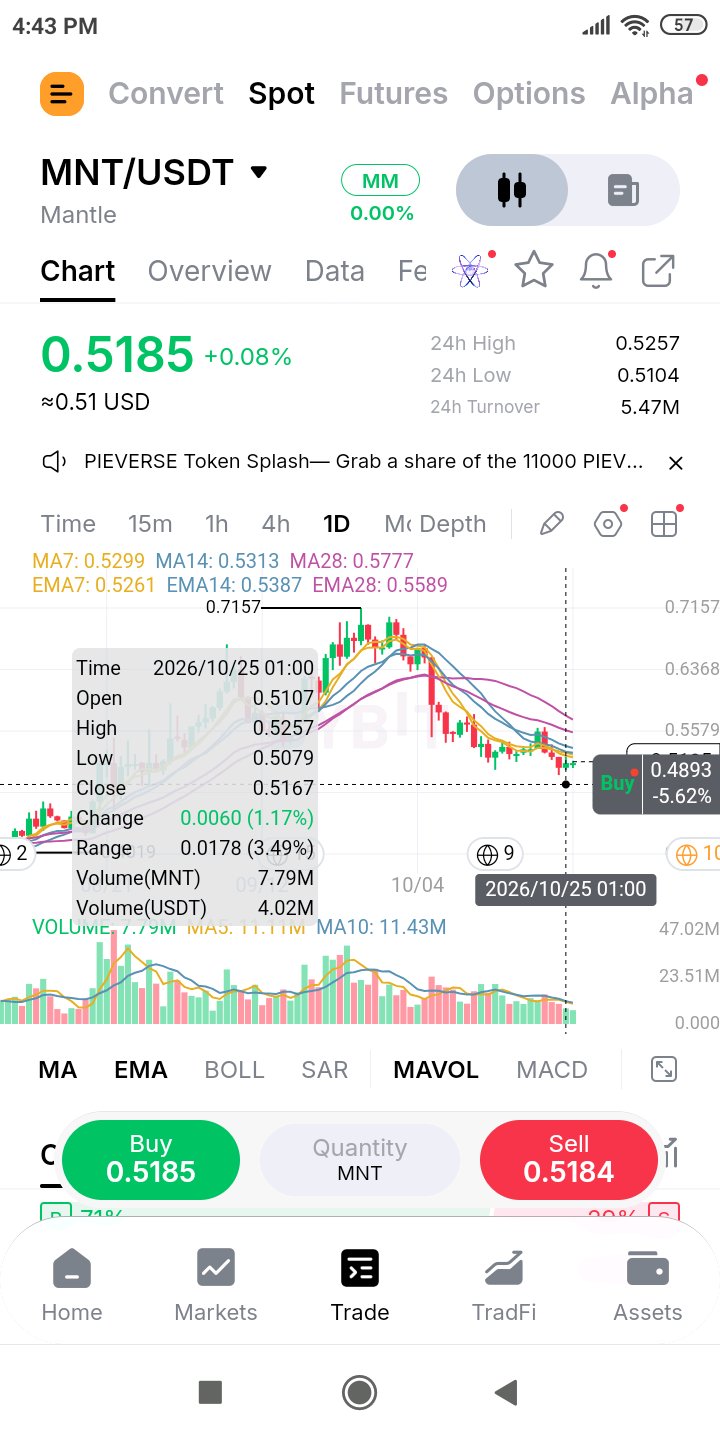
$MNTUSDT is down about 28% from the 0.7157 peak, and at 0.5185 it sits under every average on the daily chart: MA7 and MA14 (0.5299 / 0.5313), EMA14 (0.5387), EMA28 (0.5589) and MA28 (0.5777). That's a full bearish stack. Before calling a bottom, here's what I'd want to see and what the chart shows. Stabilization: partly. Daily candles have shrunk to small ranges near 0.51-0.52, and the last completed one closed green (+1.17%) at 0.5167. Selling has slowed. It hasn't reversed. Volume washout: not yet. The breakdown came on heavy volume, but recent days are quiet. That last green candle traded about 7.8M MNT, roughly two-thirds of its 10-day average. Turnover, the total USDT value traded, is about 5.5M over 24h. Fading volume near lows can mean sellers are tired or that buyers haven't shown up. Without a high-volume reversal day I can't tell which, so it doesn't count as confirmation. Fast averages reclaimed: not yet. MA7, MA14 and EMA7 bunch between 0.526 and 0.531, about 1.5-2.5% overhead. That's the key level. A daily close above 0.5313 would be the first real evidence. Levels Resistance: 0.5257 (24h high), 0.526-0.531 (average cluster), 0.5387 (EMA14), 0.5589 (EMA28), 0.5777 (MA28). Support: 0.5104 (24h low), 0.5079 (the last daily low), then the 0.49-0.50 area where recent dailies found bids. Risk and plan From 0.5185 it's about 2.5% up to the first ceiling and about 2% down to the last daily low. That's no edge. A daily close above 0.5313 opens room toward 0.5589, about 5% higher, against a stop under 0.5079 roughly 4.4% below that entry. Still a modest ratio. A daily close under 0.5079 makes a lower low and exposes 0.49. Daily stops are wide, so cut the size to fit them. Score: one partial, two not yet. Checklist, not a signal. #ByXIMPACT
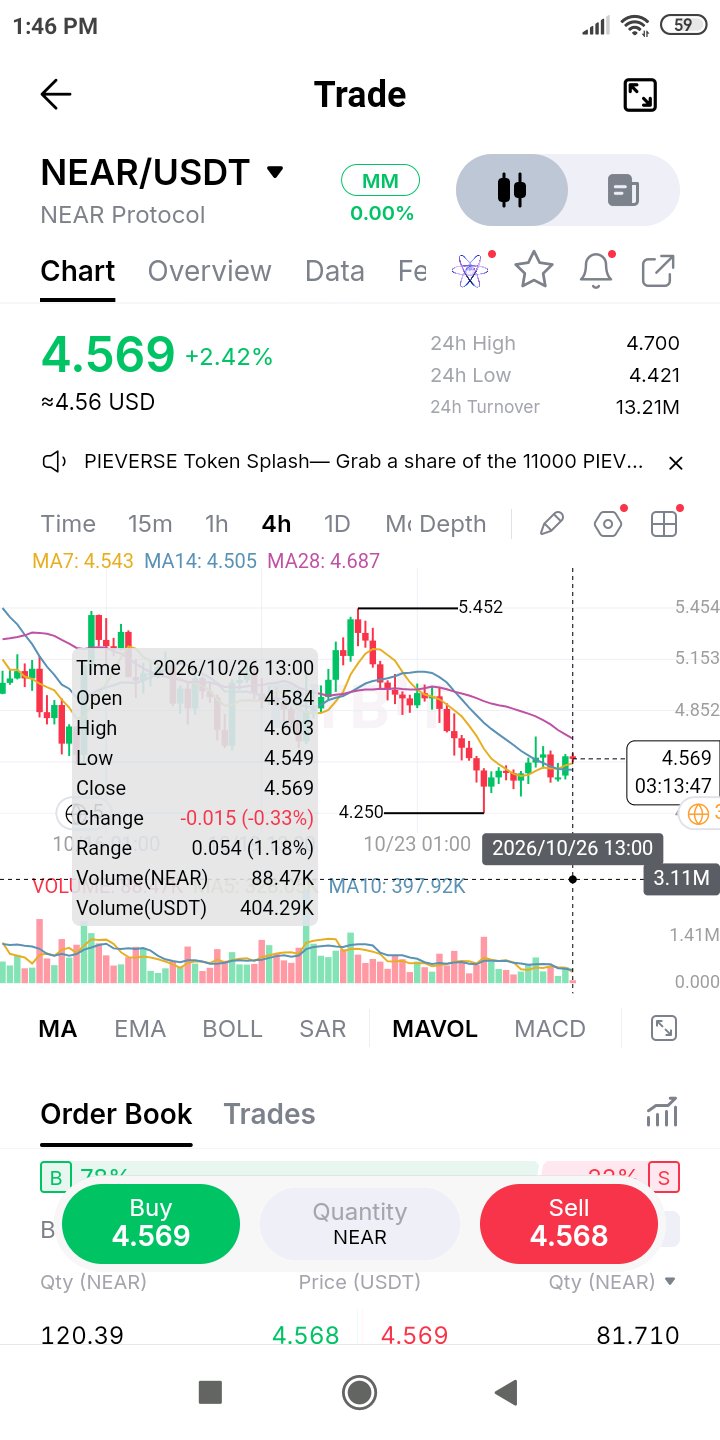
$NEARUSDT has spent nearly two days basing above the 4.25 low while the 28 MA slides down toward it: 4.687 now, with price at 4.569, a gap of about 2.6%. Three things I'm weighing: 1. Time. A sideways grind under a falling average closes the gap without price doing any work. If NEAR keeps holding 4.50-4.60, a 4H close above the 28 MA stops being a stretch. That only works while the base stays above the 7 and 14 MA (4.54 and 4.51). 2. Participation. Turnover, the total USDT traded, is about 13.2M over 24h. That was enough to lift price 2.4% on the day, but volume has been fading while price bases. A breakout candle needs visibly bigger bars than the last day or two, or it's just drift. 3. Positioning. Bids outweigh asks roughly 78/22 in the book. That supports the bounce, but resting orders can be pulled, so I treat it as a hint, not a signal. Levels Resistance: 4.687-4.70 (the 28 MA plus the 24h high), then 5.0-5.2, then the 5.45 swing high. Support: 4.50-4.54 (the 7 and 14 MA), 4.42 (24h low), 4.25 (swing low). Plan and risk The clean trigger is a 4H close above 4.70 on stronger volume. Buying here means about 2.6% to the ceiling against about 3.2% to the 24h low, so you're paying for risk without an edge. Losing 4.42 on a 4H close puts 4.25 back in play, and a stop under it is roughly 7% away, so size accordingly. Analysis only, not advice. If 4.42 goes, the idea goes with it. #ByXIMPACT
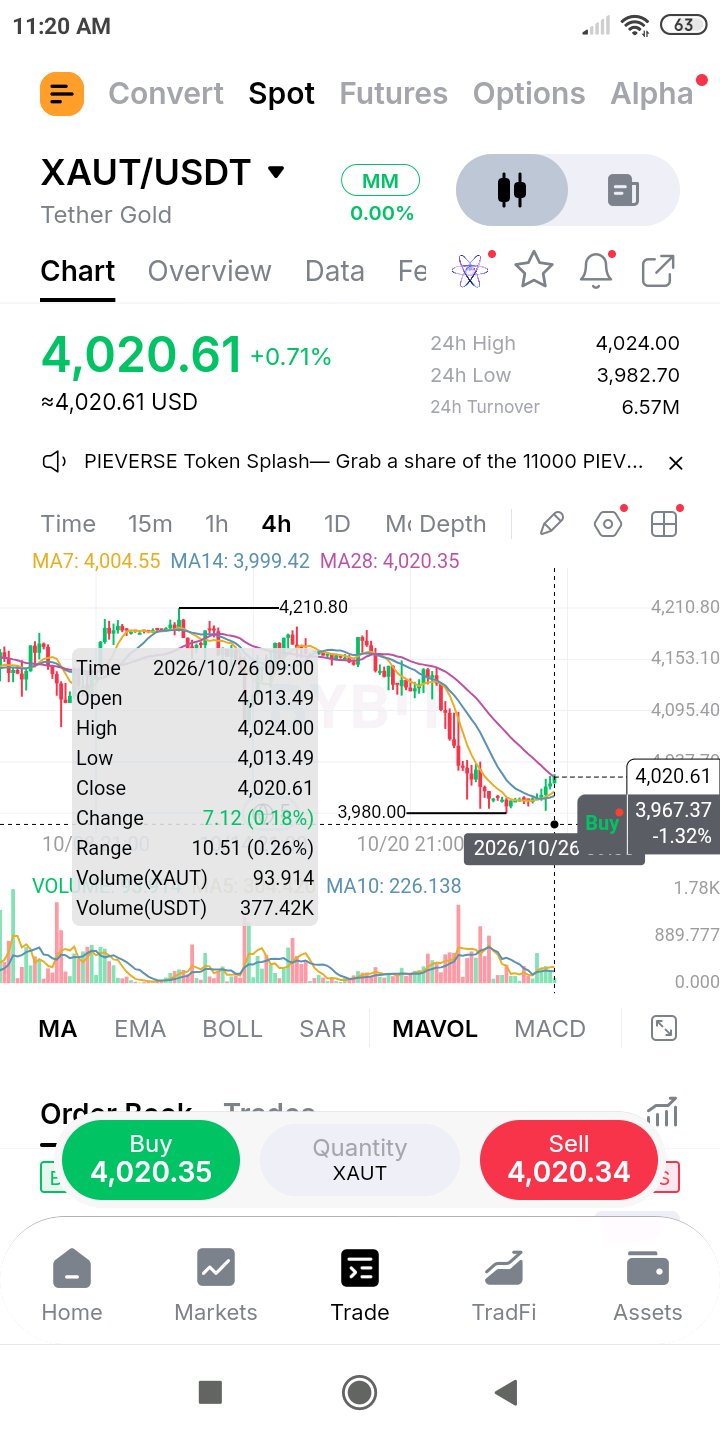
$XAUTUSDT is Tether Gold, a token that tracks spot gold, so this is effectively a gold chart. Price stepped down from 4,210.80 to 3,980, about 5.5%, then built a small base around 3,980-4,000. It's now at 4,020.6, almost exactly on the 28 MA (4,020.35), and the 7 MA has crossed up through the 14 MA. That's momentum improving. It isn't a reversal yet. Volume vs turnover: The selloff printed heavy volume. The bounce so far has been quiet. Turnover, the total USDT value traded, is 6.57M over 24h. That's modest, because this is a tokenized-gold market and not the deep spot gold market, so spikes can overshoot. I'd trust a 4H close over an intrabar poke. The line that matters: 4,020-4,024: the 28 MA and the 24h high sit together. A 4H close above 4,024 flips that zone from ceiling to support. Getting rejected there makes it another lower high. Levels: Resistance: 4,024, then 4,095-4,100, then the 4,150 area that capped the last bounce. Support: 4,000-4,005, where the 7 and 14 MA are bunched, then the 3,980-3,983 base. Trade logic: The case is a reclaim with a defined exit. The base has held, momentum is curling up, and invalidation sits just under 3,980, about 1% below. A move to 4,095-4,100 is roughly 1.9% up, close to 2:1. That only counts once price confirms above 4,024. What could go wrong: Gold reacts to dollar and yield headlines, and a headline can override any chart. If the 28 MA rejects price and it slips under 4,000, the reclaim failed. A close under 3,980 reopens the downtrend with nothing underneath on this chart. Keep size small enough that the stop feels boring. Analysis, not a recommendation. Plan the exit before the entry. #ByXIMPACT
Opportunity (Bullish 📈) Privacy-driven Rally: ZEC, currently priced at 457.99 USDT, is among the most bullish assets in the privacy coin sector. A surge in community optimism and increased trading activity (+1,100% volume growth) indicate strong momentum. Its design offering optional transparency makes ZEC a unique regulatory-friendly privacy asset compared to Monero (XMR), supporting medium-term adoption potential.
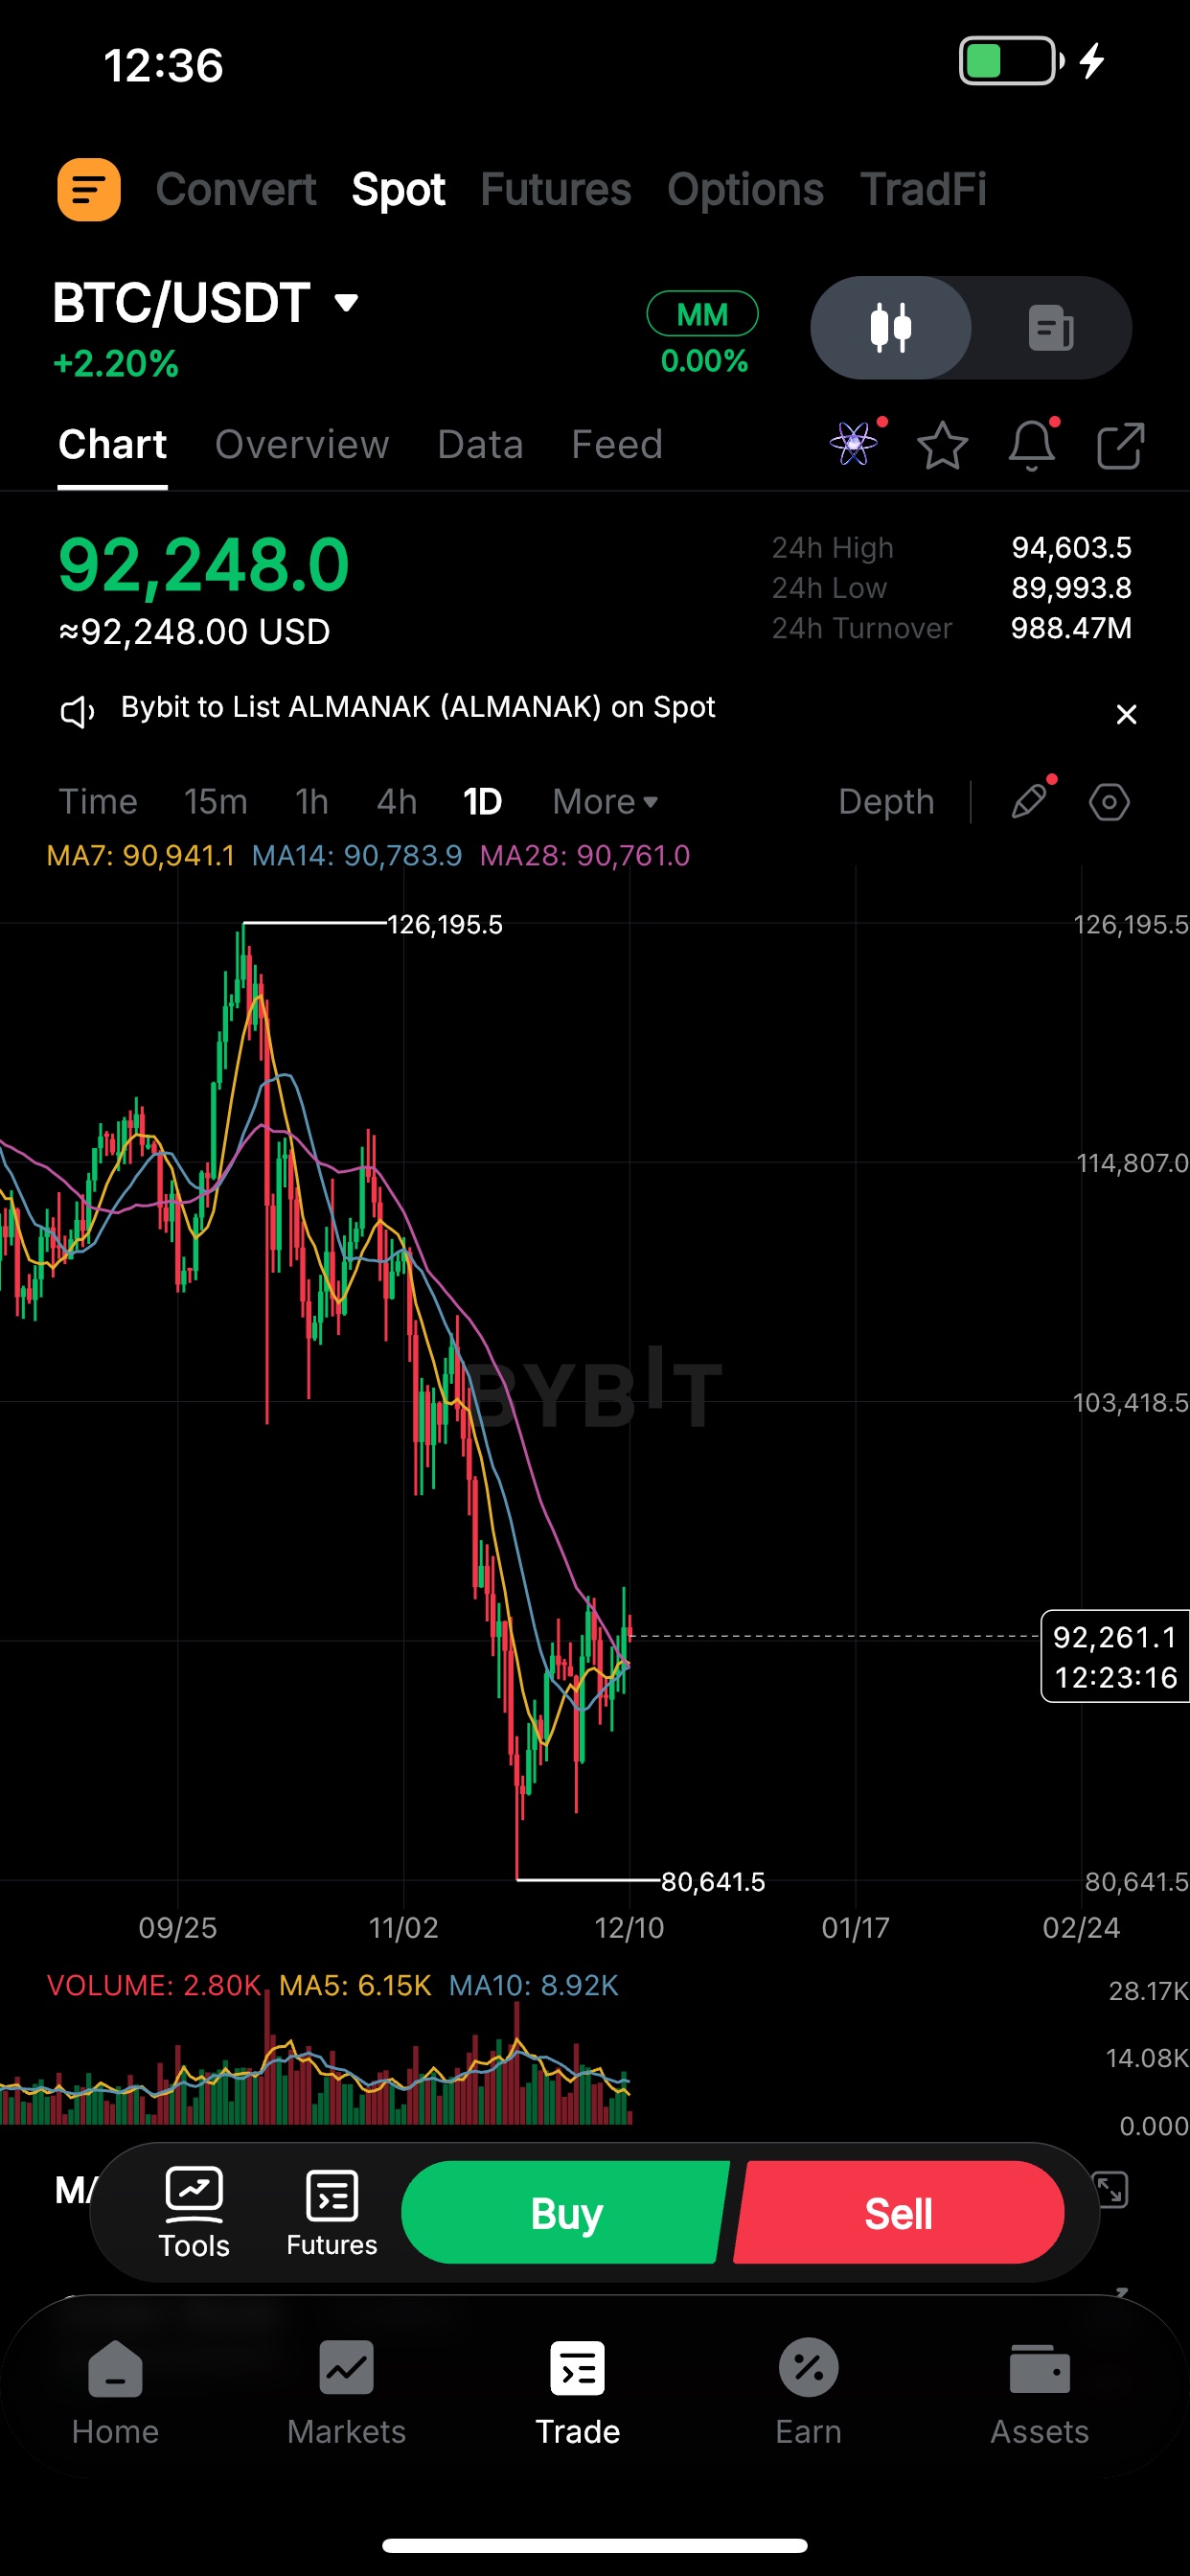
BTC Market Analysis Report Overview Bitcoin (BTC, current price: $92,229.59) continues to command market dominance amid mixed macroeconomic signals and evolving institutional involvement. Despite short-term volatility driven by Federal Reserve policy actions and uneven retail sentiment, the cryptocurrency is supported by solid long-term fundamentals and increasing institutional accumulation. Present market data shows a cautiously optimistic trend, with technical indicators revealing consolidation before possible breakout moves. Short-Term Market Dynamics Price Behavior and Liquidity BTC recently rebounded from below the $90,000 level after brief selling pressure triggered by profit-taking and macro uncertainty. Institutional demand surged, with reports of BlackRock
Opportunity (Bullish📈) Resilient momentum with institutional traction: SOL at 131.08 USDT remains resilient despite market swings, supported by ETF inflows, tokenization initiatives, and network adoption. Institutional entry through Robinhood and Galaxy boosts credibility similar to BTC and ETH, creating long-term potential.
BTC Market Analysis – December 10, 2025 Overview Bitcoin (BTC) is currently trading around $92,210.06, consolidating under heightened macro uncertainty as market eyes the Federal Reserve’s final rate decision of the year. Market expectations price in a 25 bps rate cut with 89–96% probability, fueling risk-on sentiment across digital assets. Despite short-term volatility, Bitcoin remains technically resilient, supported by institutional inflows and regulatory clarity from the SEC’s approval of Bitwise crypto index ETP. In this context, traders should view BTC through three dimensions — macro dynamics, technical strength, and network fundamentals — while monitoring correlated moves from major Layer-1 assets such as Ethereum (ETH) and Solana (SOL), which often reinforce Bitcoin’s
RISK MODERATE: Macro uncertainty and profit-taking risk loom before major Fed announcements. The market’s fear & greed index stands at 25 (fear zone), ETF inflows contrast with overall market caution, and recent BTC flow data shows moderate capital outflow. The combined setup raises short-term volatility before directional clarity emerges. Comprehensive Assessment: Event-Driven Volatility: The upcoming FOMC meeting could trigger sharp fluctuations if a “hawkish cut” tone surfaces, prompting a sell-the-news scenario. Overbought Conditions: Short-term RSI levels (~55) are neutral but may rise rapidly under speculative flows—ETH already shows higher RSI near 63, implying sector-wide froth. Liquidity Risk: Large leveraged accounts remain crowded on the long side; if macro sentiment reverses,
BTC’s current correction phase offers technical support amid a liquidity-driven macro backdrop. With markets pricing in a 25 bps Federal Reserve rate cut (≈87% probability), Bitcoin (BTC) has stabilized near 92,000–93,000 USD, supported by strong ETF inflows (≈287.3M USD daily). Ethereum (ETH) and Solana (SOL) also show bullish crossover signals, suggesting broader market momentum for risk-on assets.
Today's market has three key dynamics closely related to your portfolio and worth paying attention to: 1 Federal Rate Cut Expectations The market expects the Federal Reserve to cut rates by 25 basis points with over 87% probability, increasing liquidity and benefiting risk assets like BTC and ETH, both currently showing short-term bullish patterns. 2 Institutional Capital Inflows 3 Regulatory Breakthrough in Derivatives Markets
see
PYTH Ecosystem Analysis Report The Pyth Network (PYTH), currently trading at 0.0729 USDT, stands as one of the most significant data oracle infrastructures working across multiple blockchains like Solana, Ethereum, and others. Understanding which coins in the PYTH ecosystem deserve close attention requires a simultaneous look at on-chain technical signals, ecosystem expansion, and macro sentiment impacts. Overall Perspective PYTH plays the critical role of connecting real-world financial data to decentralized protocols — making it a backbone for DeFi, synthetic asset platforms, and new generation derivatives. The ecosystem evolves through integrations with partners such as VOOI and Hyperliquid, both of which actively utilize PYTH’s real-time price feeds to enhance liquidity efficiency.