Accurate
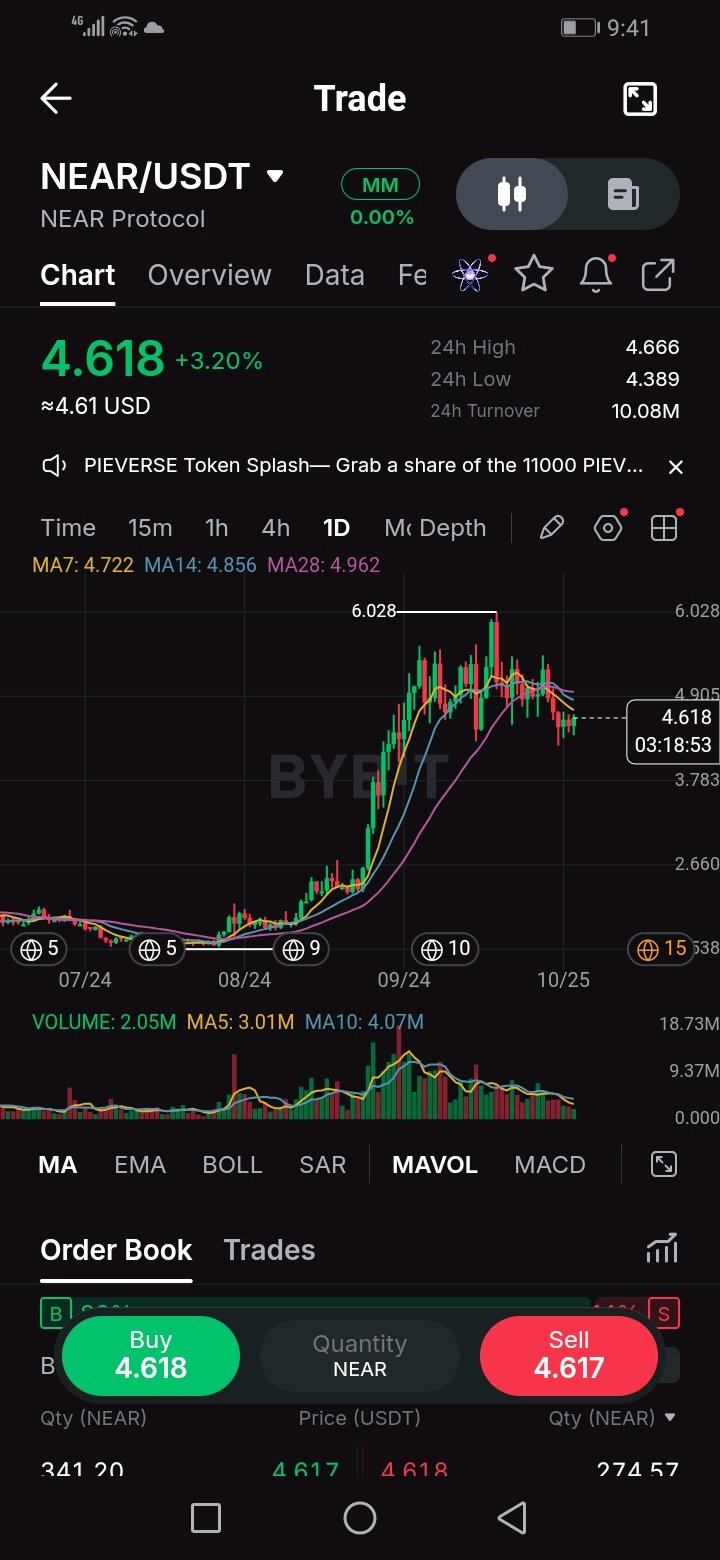
$NEARUSDT is up nearly 4x from its August base, and the 6.03 high was a one-day spike that got fully rejected. The question now is whether this pullback is a pause or the top. Context NEAR ran from about 1.54 to a 6.03 peak, then retraced to 4.62. That's a shallow pullback of only about 31% of the move. Price sits between the 0.236 retracement (about 4.97) and the 0.382 (about 4.31), so the trend has barely been dented. But it's now trading under MA7 (4.72), MA14 (4.86) and MA28 (4.96) and has failed to make a new high since the 6.03 wick. Level to watch 4.31-4.39. The 0.382 retracement and the 24h low (4.389) sit right on top of each other, which makes this zone the line between a healthy pullback and a deeper correction. The first real sign of strength is a daily close above 4.96, because that reclaims all three averages at once. Volume and turnover Turnover is about 10M USDT, which is liquid enough for these levels to matter. Daily volume of 2.05M is well under the 5-day average (3.0M) and the 10-day (4.1M). The pattern is clear on the chart: the rally came with rising volume, and the pullback is happening on shrinking volume. That's what a correction usually looks like, but it also shows buyers aren't stepping in aggressively. The daily candle is still open, so I'd wait for the close before reading too much into it. Consideration The bull case: a shallow, low-volume pullback after a vertical move is how trends rest. The bear case: after a near-4x run, a failed push to 6 with sellers defending 5.5 is a classic place for profit-taking to turn into a lower high. Both fit the chart, so I'd rather react to levels than predict. Support and resistance Support: 4.39, 4.31, 4.0, then 3.78 (50%) and 3.25 (0.618). Resistance: 4.72 (MA7), 4.86 (MA14), 4.96 (MA28), then 5.40-5.50 (the range highs), and 6.03. Plan Pullback: buy a hold of 4.39-4.45, stop under 4.20 (about 0.22 of risk). Targets are 4.96 and 5.45, roughly 2.5R and 4.7R. Breakout: wait for a daily close above 5.00, buy the retest, stop under 4.75, targets 5.50 then 6.03. Invalidation A daily close under 4.20 breaks the 0.382 and the recent low. After that, 3.78 is the next real level, and I'd stay out instead of averaging down. Risk NEAR is a high-beta alt that follows BTC, so a market-wide move overrides any level here. After a run this big, profit-taking can hit fast. Fib levels are zones, not guarantees. Keep size small. Idea only, not financial advice. Healthy pause under 5, or has the top already printed? #ByXIMPACT
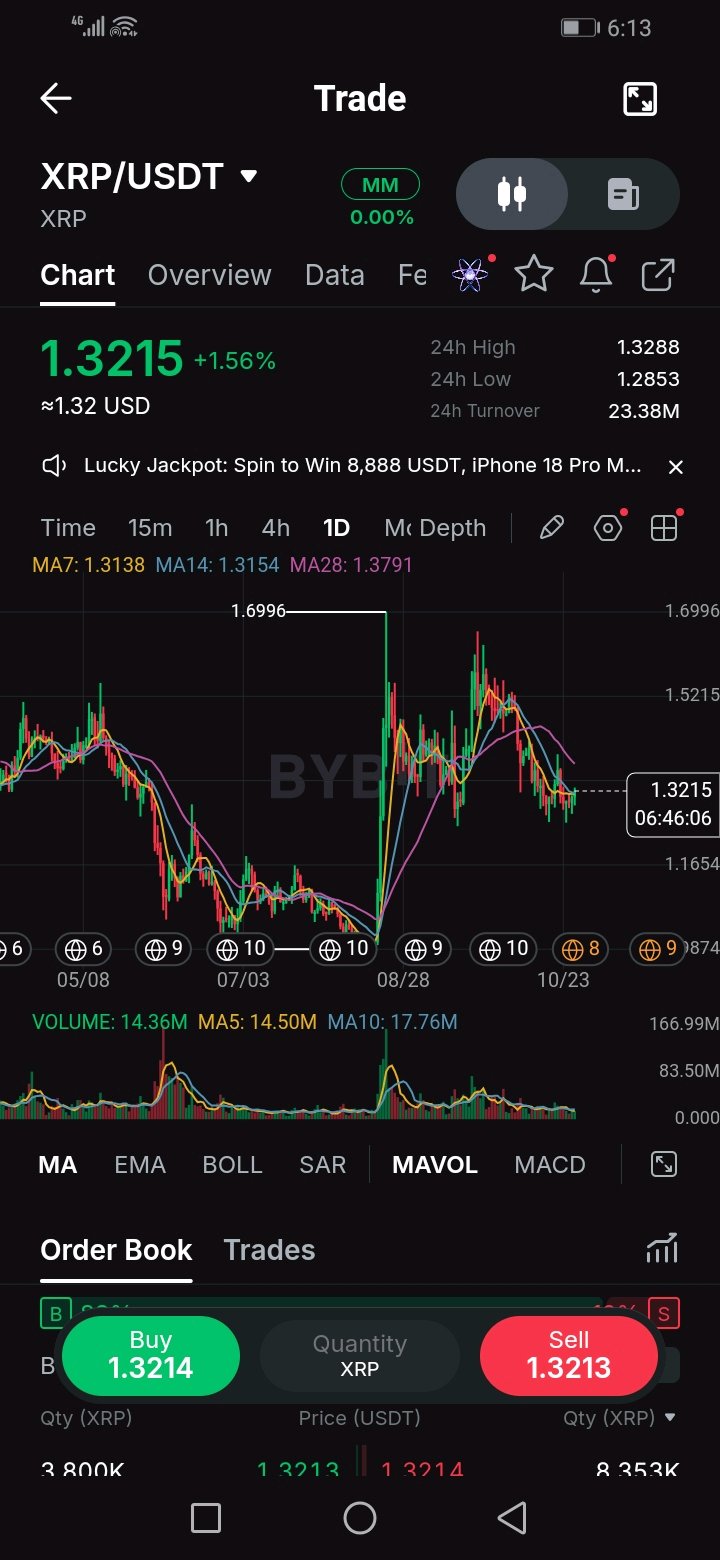
$XRPUSDT is parked on the 50% retracement of its August-September rally, but the lower highs since September say buyers are still not in charge. The read: XRP ran from the 1.00 base to roughly 1.65 (the August spike wicked to 1.70), then began stepping down. The highs since then are lower each time: about 1.65, then about 1.50, then about 1.38. Price at 1.32 sits almost exactly on the halfway retracement of the whole move (about 1.325). This is the level that decides if the pullback is just cooling off or the start of a full unwind. Turnover and volume: 24h turnover is about 23.4M USDT, which is deep enough that these levels are being tested with real liquidity. Daily volume of 14.4M XRP is in line with the 5-day average (14.5M) and below the 10-day (17.8M), and it's a tiny fraction of the August spike. Selling has slowed, but nobody is buying with conviction either. A break of the range on volume above 18M would mean far more than one on a quiet day. The daily candle is still open, so I'd wait for the close. Support and resistance: Support: 1.285 (24h low), 1.25 (0.618 retracement), 1.17, then the 1.00 base. Resistance: 1.329 (24h high), 1.379 (MA28), 1.40 (0.382), 1.50, then 1.65. MA7 and MA14 are flat and nearly identical (1.314 and 1.315), and price is wrapped around them. That's indecision, and the real resistance is MA28 above. Level to watch: The daily range is roughly 1.285 to 1.38. A close outside either side is the first real signal. Consideration: Bulls need a close above 1.38 to break the pattern of lower highs. Bears only need price to keep failing under MA28 and then lose 1.285. Until one of those happens, I'd rather trade the edges of the range than guess the direction. Trade plan: Range play: buy 1.285-1.30, stop under 1.25 (about 0.04 of risk), targets 1.38 and 1.40, roughly 2R to 2.5R. Breakout: a daily close above 1.38, buy the retest, stop under 1.32, targets 1.50 and 1.65, roughly 1.8R and 4R. Defensive: a daily close under 1.285 opens 1.25 and then 1.17, so I'd stay out of longs. Invalidation: For longs, a daily close under 1.25. That's the 0.618, and below it the chart has little structure until 1.17. Risk note: XRP moves hard on news and follows BTC, so a market-wide move will run straight through these levels, as the August spike showed. Fib levels are zones, not guarantees. Keep size small. Idea only, not financial advice. Which breaks first, 1.38 or 1.285? #ByXIMPACT
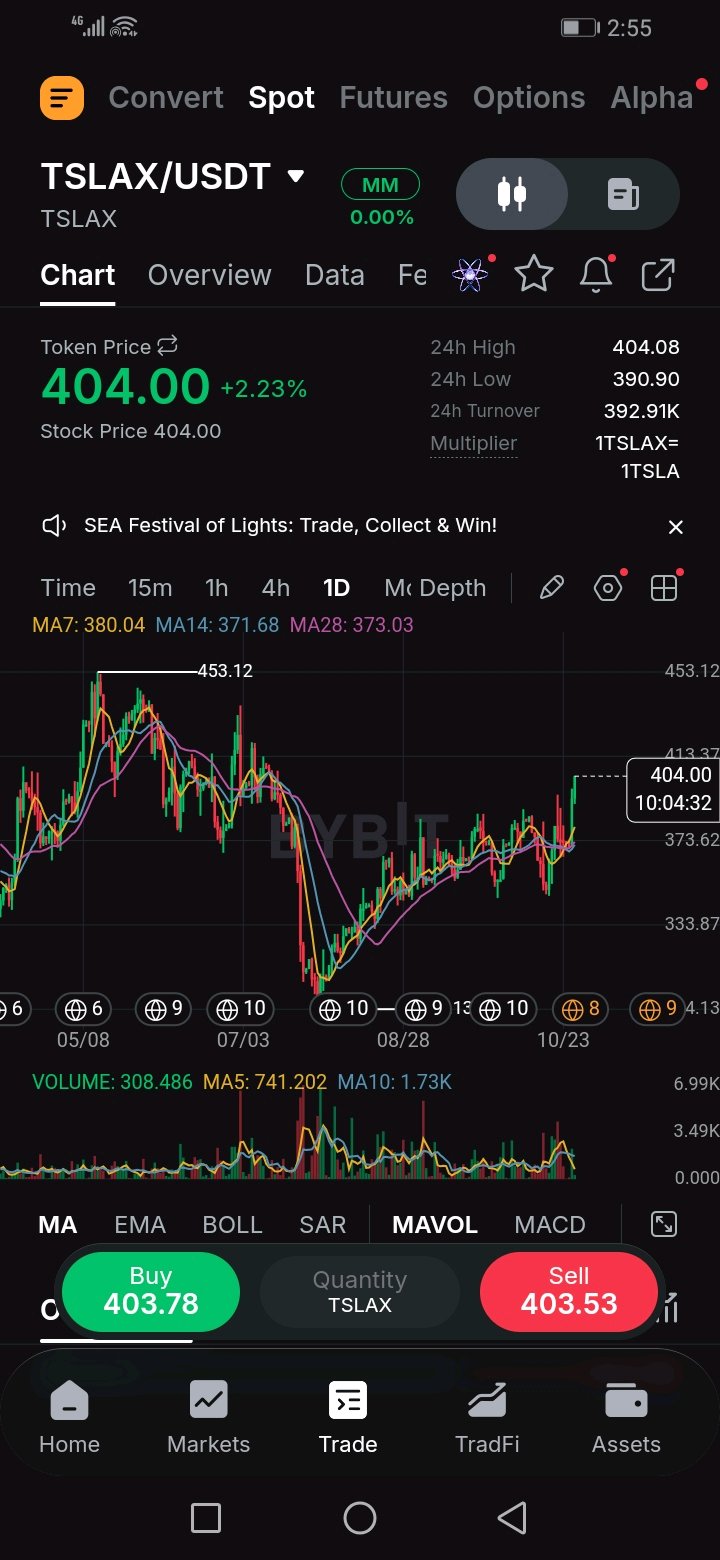
$TSLAXUSDT is trading about 8% above all three moving averages, and the old range top around 390 is now the level that decides whether this move has legs. Situation: After falling from 453 to roughly 294, TSLAX spent months stuck between about 340 and 390. Price is now 404 and has cleared that box. It also sits above the 0.618 retracement of the whole decline (about 392) and is heading toward the 0.786 near 419. MA7, MA14 and MA28 are all flat and tight between 371 and 380, so price has pulled well away from them. Moves this extended often come back to test the breakout level before continuing. Turnover and volume: 24h turnover is only about 393K USDT, and the day's range is a modest 391-404. That's thin for a breakout. Today's volume of 308 is well under the 5-day average (about 741) and the 10-day average (about 1,730), but the daily candle is still open, so I wouldn't read much into it yet. The final volume at the close tells the story. A close with volume near or above the 5-day average confirms buyers. A weak close on thin volume invites a fade. Support and resistance: Support: 391-392 (0.618 and the 24h low), 380 (MA7), 371-373 (MA14 and MA28), then 340-350 (the range floor). Resistance: 404-405 (today's high), 413, 419 (0.786), then the 453 peak. Level to watch: 390-392. This is the old range top and the 0.618 in the same place. If it holds as support on a pullback, the breakout is real. Trade plan: Pullback entry: buy a hold of 391-395, stop under 384 (about 9 of risk from 393). Targets are 413, 419, then 453, roughly 2R, 3R and 6R or better. Continuation entry: wait for a daily close above 413, buy the retest, stop under 404. Chasing 404 here makes the stop wider for the same targets, which is why I prefer the pullback. Invalidation: A daily close below 384 puts price back inside the old range and under the 0.618. That breakout would have been a fakeout, and I'd stand aside. Risk note: TSLAX is tokenized Tesla exposure that trades around the clock while the underlying stock trades only in US market hours. Gaps at the US open are a real risk, especially with turnover this thin. Fib levels are zones, not guarantees. Keep size small. Levels are read off my chart. Idea only, not financial advice. Does 390 hold on a pullback, or does this move fade back into the range? #ByXIMPACT
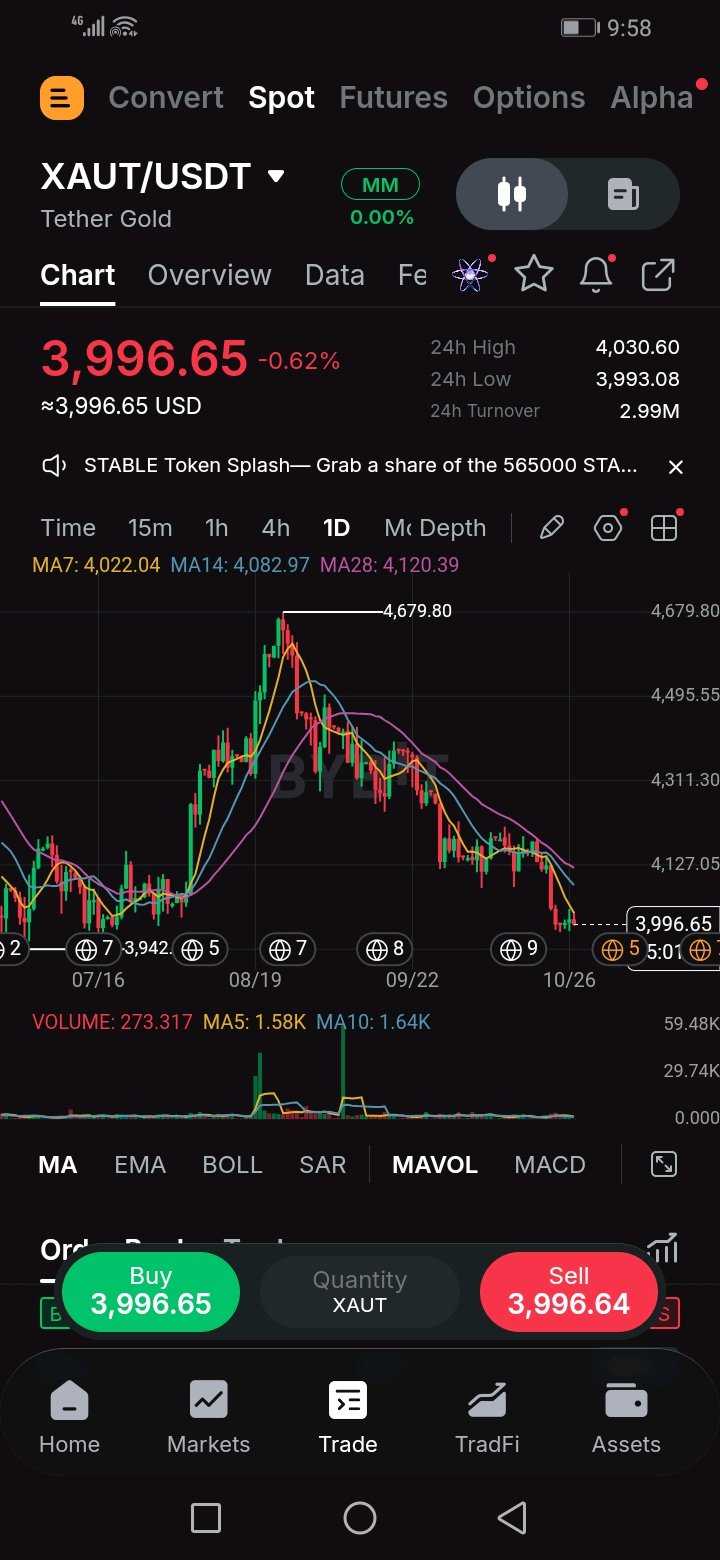
$XAUTUSDT has erased about 93% of its late-summer rally and is hanging on the 4,000 line. Sellers aren't pressing, but buyers haven't stepped in either. Context: Price ran from the 3,940-4,000 base to 4,680 in August and September, then rolled over and retraced almost all of it. At 3,997 it's only about 55 points above where the rally started. The question now is simple: does the base that launched the move hold a second time, or does the market go looking for what's underneath? Turnover and volume: 24h turnover is only about 3M USDT, and today's volume of 273 XAUT is a fraction of the 5 and 10-day averages (about 1,580 and 1,640). The candle is still forming, so I won't over-read it. Still, look at the pattern across the chart: the rally came with huge volume spikes, and the whole decline has happened on almost none. That's a market drifting down rather than being dumped on. It also means a bounce from here has little conviction behind it unless volume wakes up. Support and resistance: Support: 3,993 (24h low), 3,942 (the visible base low), then the 3,900 round number. Below that the chart shows no structure at all. Resistance: 4,022 (MA7), 4,083 (MA14), about 4,100 (0.786 of the rally), 4,120 (MA28), 4,224 (0.618), then 4,311. All three averages are stacked bearishly and sloping down, so every bounce runs into a ceiling quickly. Level to watch: 3,942 is the line that matters. A daily close above 4,125 clears every average and says the base is working. Trade plan: Bounce: long 3,950-3,995, stop under 3,920 (about 50 of risk), targets 4,083 and 4,120 for roughly 2.3R and 3R. Confirmation: wait for a daily close above 4,125, buy the retest, stop under 4,060, first target 4,224. Breakdown: a daily close under 3,940 turns this into a trend continuation. I'd stand aside or look for shorts on a failed retest of 3,940-3,960. Invalidation: For the bounce idea, a daily close below 3,920. After that, 3,900 is a magnet and I wouldn't be catching it. Risk: Gold tracks the dollar, yields and macro headlines, and a gap can run straight through technical levels. Light turnover also means wider moves on small orders. Keep size small. Levels are read off my chart. Idea only, not financial advice. Does this base hold a second time, or is 3,900 next? #ByXIMPACT
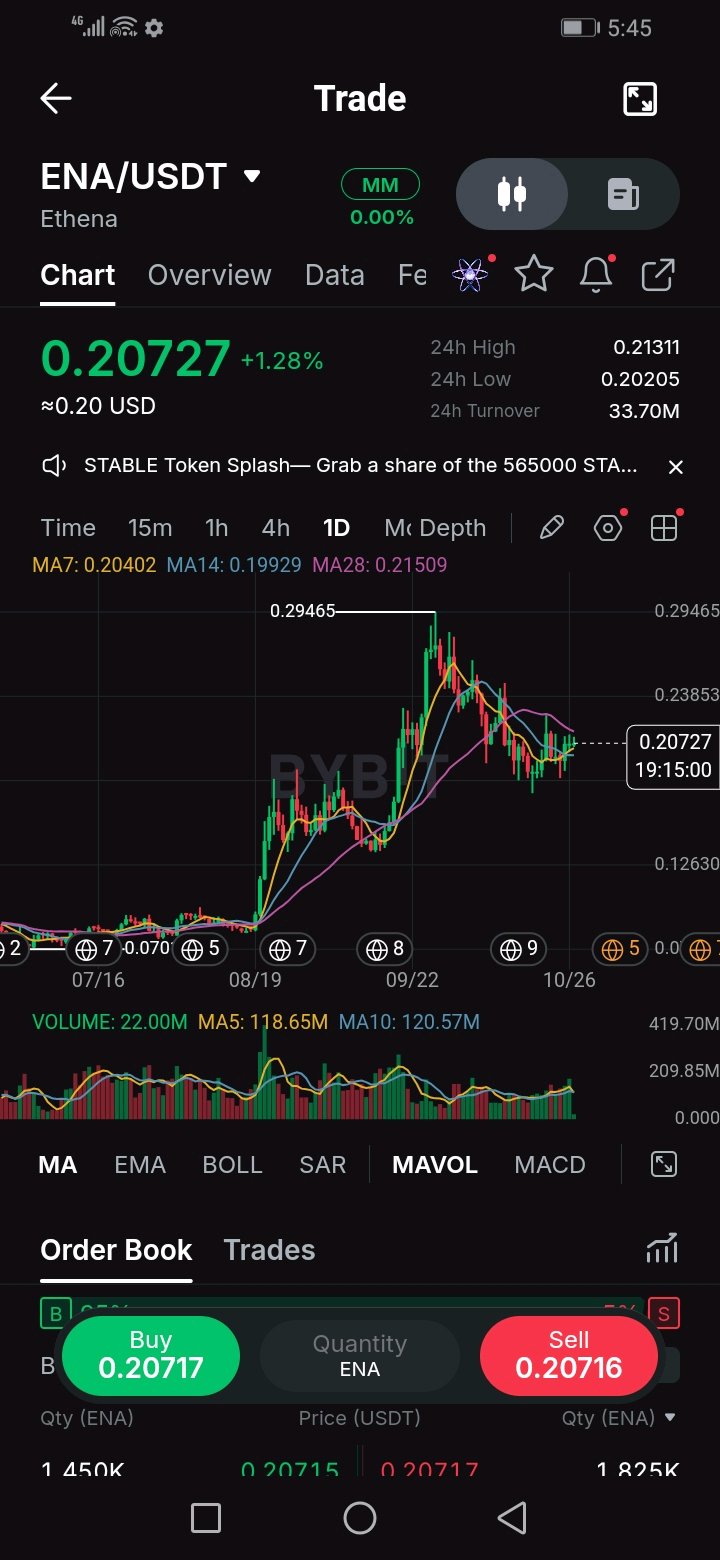
$ENAUSDT ran from about 0.07 to the 0.2947 high, then pulled back and found buyers near 0.18, which is roughly the 50% retracement of the whole move. It has since bounced to 0.207, almost exactly the 0.382 retracement (about 0.209). The bigger trend is intact because the halfway level held, but price is now stuck between MA14 (0.199) and MA28 (0.215), with MA7 (0.204) in the middle. That's compression, and compression ends in a move. Volume check 24h turnover is about 33.7M USDT, which is roughly 160M ENA at this price. That's above the 5 and 10-day volume averages of about 119M and 121M, so participation is picking up while price coils. Today's daily bar still shows only 22M because the candle is unfinished, so I'm not reading anything into it yet. A close above resistance with volume above that 120M average would be far more convincing than one without. Levels Support: 0.202 (24h low), 0.199 (MA14), 0.19, then 0.175-0.18 (the pullback low and 50% retracement), then 0.156 (0.618). Resistance: 0.2131 (24h high), 0.215 (MA28), about 0.225 (the October bounce high), 0.2385, then 0.2947. The level to watch is 0.215. Reclaiming MA28 on a daily close is the first real sign the pullback is over. Playbook Long, patient: a hold of 0.200-0.205 with a stop under 0.192 (about 0.011 of risk). Targets are 0.225 and 0.2385, roughly 2R and 3R. Long, breakout: a daily close above 0.2155 on strong volume, then buy the retest. Targets are 0.225 and 0.2385. Short or defensive: only if price loses 0.199 on a close, because that takes it back below the whole average cluster. Invalidation A daily close below 0.19 breaks the structure. At that point 0.18 comes into play, and I'd stand aside instead of buying the dip again. Risk ENA is a high-beta alt that tends to follow BTC, so a market-wide move will override any level on this chart. Fib levels are zones, not guarantees. Size small. Levels are read off my chart. Idea only, not financial advice. Which way does the squeeze break, 0.215 or 0.199? #ByXIMPACT
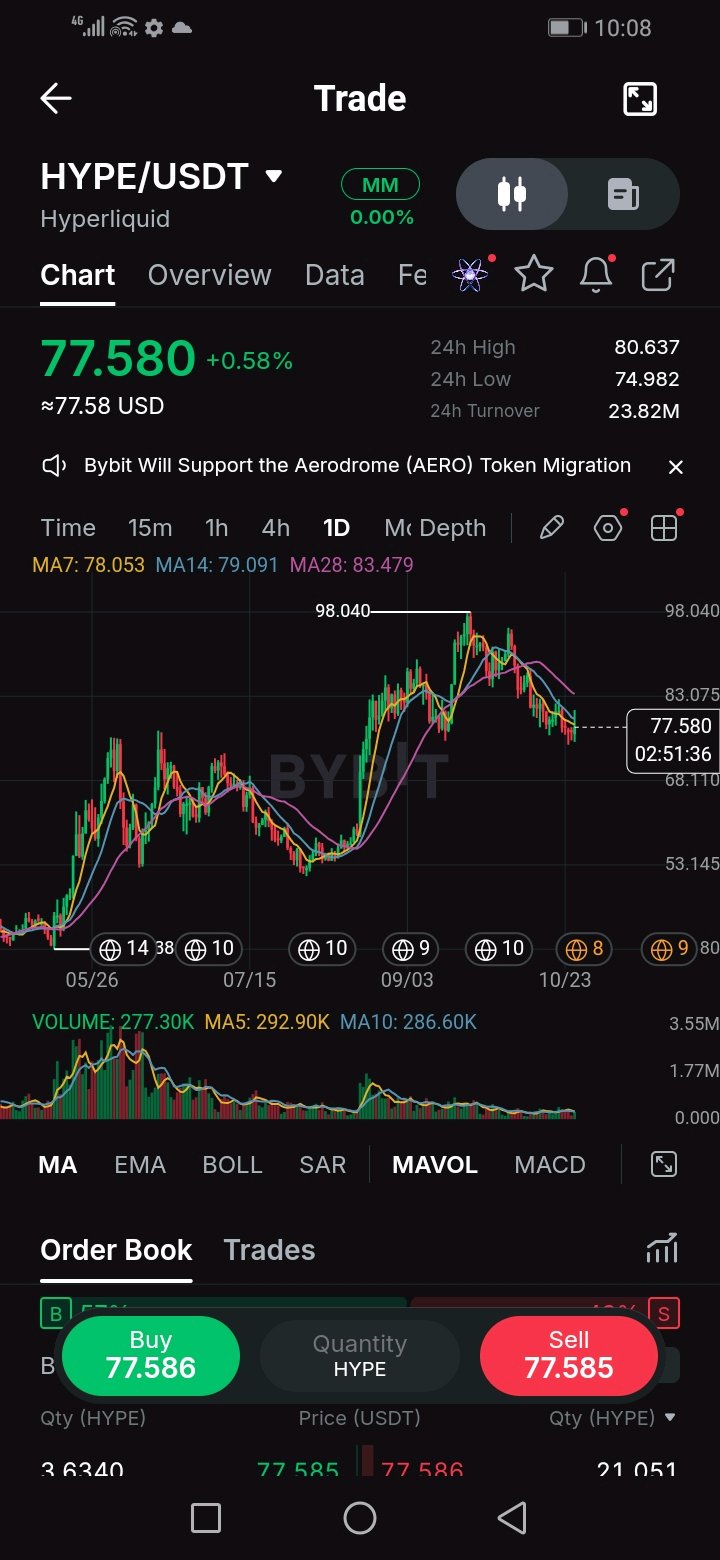
$HYPEUSDT is down about 20% from the 98 high, and it just wicked under the 50% retracement of the whole rally and got bought straight back. Where we are The move from roughly 54 to 98 built the trend, and this pullback is the first real test of it. Today's low of 74.98 poked just under the halfway mark (about 76), and price recovered to 77.58. A wick below a level that closes back above it is worth noting, but one candle doesn't make a bottom. Turnover and volume 24h turnover is about 23.8M USDT, deep enough that these levels are being tested with real liquidity. Daily volume at 277K sits right on its 5 and 10-day averages (about 293K and 287K), but it's far below the late-May to July activity. That tells me the selling has calmed down without a rush of new buyers. A close above resistance with volume above 300K would carry much more weight. Levels Support: 75 (today's low), then 70.8 (0.618), then 68, then 63.4 (0.786). Resistance: 78-79 (MA7 and MA14), 80.6 (24h high), 83.5 (MA28), then the low 90s, then 98. Price is under all three averages, and MA28 is still sloping down, so the short-term trend is lower until that changes. What I'd consider The dip buyer's case is a healthy 50% pullback inside a larger uptrend. The cautious case is a lower high in the low 90s followed by lower closes. Both fit this chart, which is why I'd rather react to levels than predict. Plan Early: buy a hold of 75-76 with a stop under 73.5 (about 2.5 of risk). Targets are 79, 83.5, then the low 90s, roughly 1.2R, 3R and 5R or better. Confirmed: wait for a daily close above 80.7. That reclaims both short MAs and today's high. Stop under 75, first target 83.5. Wrong if A daily close below 74.5 means the halfway level failed. 70.8 becomes the next area, and I'd stay out instead of averaging into it. Risk Fib levels are zones, not guarantees, and the trend hasn't turned yet. Keep size small and don't chase a bounce into the MA cluster. Levels are read off my chart. Idea only, not financial advice. Does 75 hold, or is that wick just a pause before 70? #ByXIMPACT
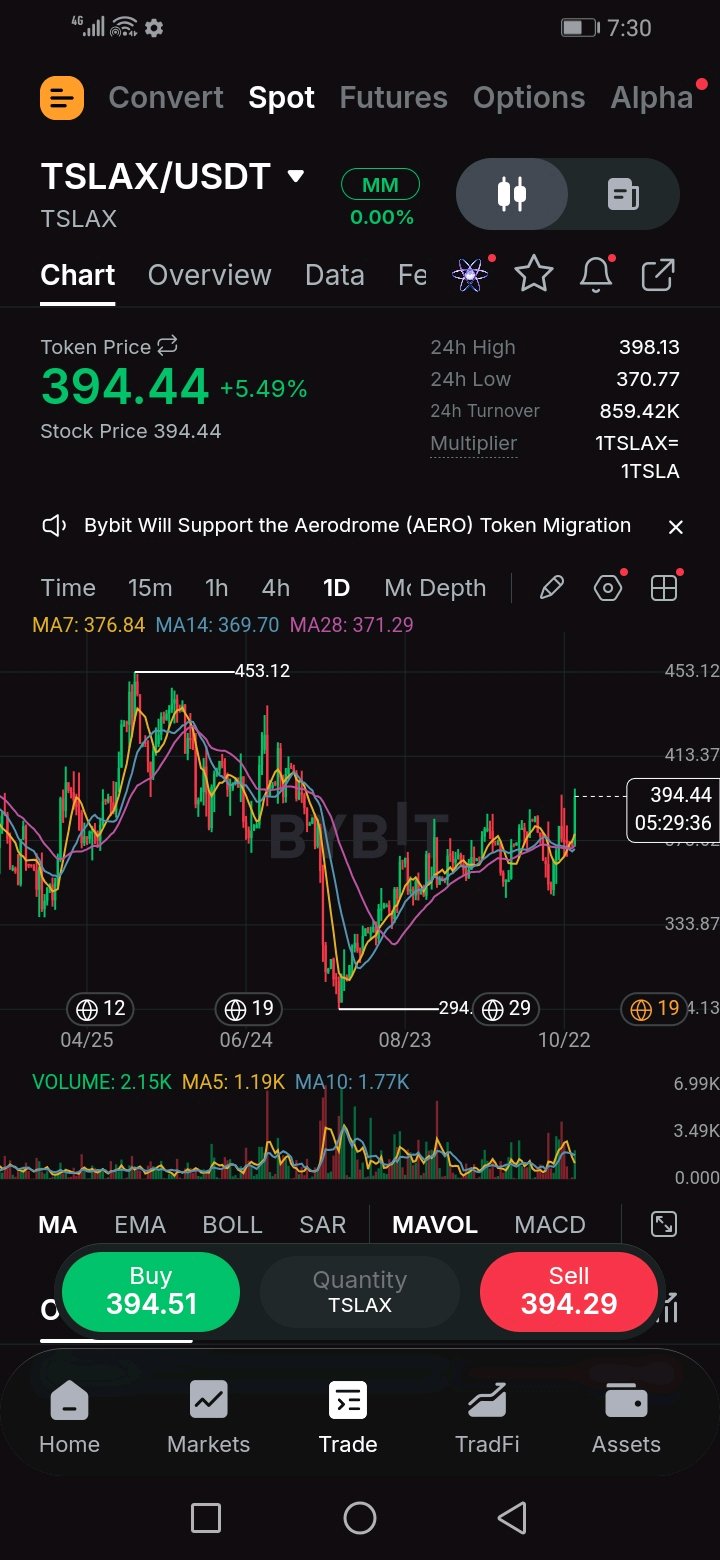
$TSLAXUSDT spent roughly three months grinding sideways between about 340 and 390. Today's candle at 394 pushes through the top of that box and lands almost exactly on the 0.618 retracement of the whole 453-294 decline (about 392). That's a classic decision zone: a base is forming or sellers defend the last big fib. Volume and turnover Daily volume is 2.15K against a 5-day average of 1.19K and a 10-day of 1.77K, so this breakout came with real participation, unlike the quiet drift of the past weeks. Turnover is only about 860K USDT though, which is thin. Thin books move fast, in both directions, so I'd treat today's close as the signal and not an intraday spike. Support and resistance Support: 385-390 (old range top, now a retest zone), then 370-377 where MA7, MA14 and MA28 are bunched together, then 334 and the 294 low. Resistance: 398 (today's high), 413-420 (the 0.786 area), then the 453 peak. All three averages are flat and tight, so a break with volume often travels further than people expect. Level to watch A daily close holding above 390 confirms the breakout. Reclaiming the old range top is the whole trade. Trade plan I prefer the retest over chasing: buy a hold of 385-390, stop under 368, targets 413 then 453. From 388 that's about 20 of risk for 25 to the first target and 65 to the second, so roughly 1.25R and 3R. Chasing 394 stretches the stop for the same targets. Invalidation A daily close under 370 puts price back inside the range and under every average. The breakout is a fakeout at that point, and I'd step aside. Risk This is tokenized Tesla exposure. It trades around the clock while the underlying stock only trades in US hours, so gaps at the open are a real risk, especially with thin turnover. Size small. Idea only, not financial advice. Real breakout or a fake out at the 0.618? #ByXIMPACT
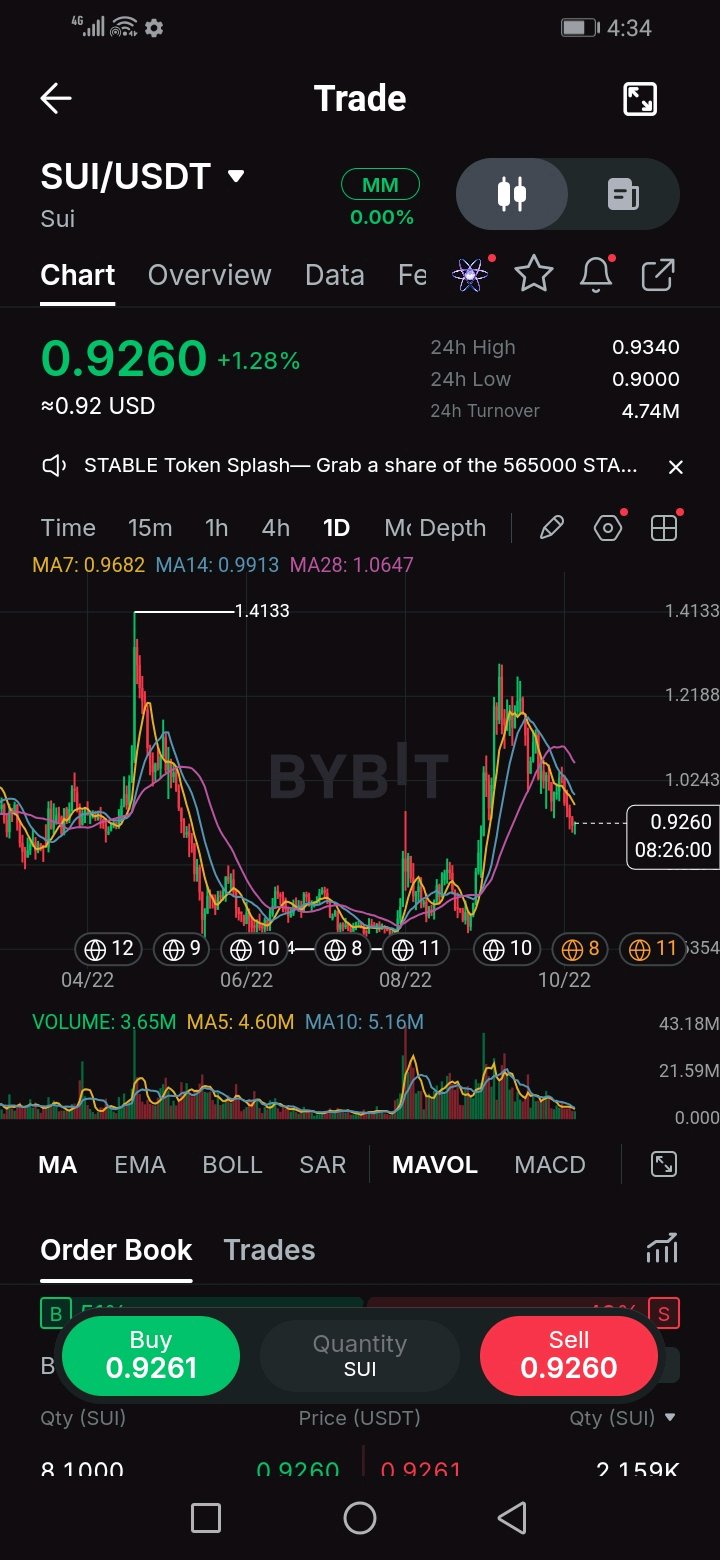
$SUIUSDT ran from the 0.65-0.70 base in August to about 1.30, then lost most of the move. At 0.926 it's back near the 0.618 retracement of that rally, with 0.90 (a round number and the 24h low) right underneath. The April spike to 1.41 is the real ceiling and still far away. Turnover and volume: 24h turnover is about 4.7M USDT. Daily volume is 3.65M against a 5-day average of 4.6M and a 10-day average of 5.2M, so participation is fading as price drops. That reads as a market losing interest in selling, not one that's buying. A bounce needs volume above those averages to be trusted. Support and resistance: Support: 0.90, then roughly 0.81 (the 0.786 retracement), then the 0.70 base. Resistance: MA7 at 0.968, MA14 at 0.991 (which also lines up with the 50% retracement), 1.02, then MA28 at 1.065. That cluster is the problem. A bounce into 0.97-0.99 meets several sellers at once. Two scenarios: Bull: 0.90 holds, price closes above 1.00, and the averages start flattening. Then 1.065 and 1.15 are in play. Bear: a daily close under 0.90 opens the way to 0.81, and the bounce idea is dead. Trade plan: Early: buy a hold of 0.90-0.93 with a stop under 0.88 (about 0.04 of risk), targeting 0.99 and then 1.065. That's roughly 1.75R to 3.5R. Confirmed: wait for a daily close above 1.00, add on the retest, and keep the stop under 0.95. Invalidation: A daily close below 0.88 cancels the setup. I'd step aside there instead of buying the dip again. Risk: Every moving average is sloping down and price is under all of them, so this is still a downtrend until proven otherwise. Size small and don't chase a bounce into the cluster. Levels are read off my chart. Idea only, not financial advice. Do you think 0.90 holds, or does the cluster above cap it first? #ByXIMPACT
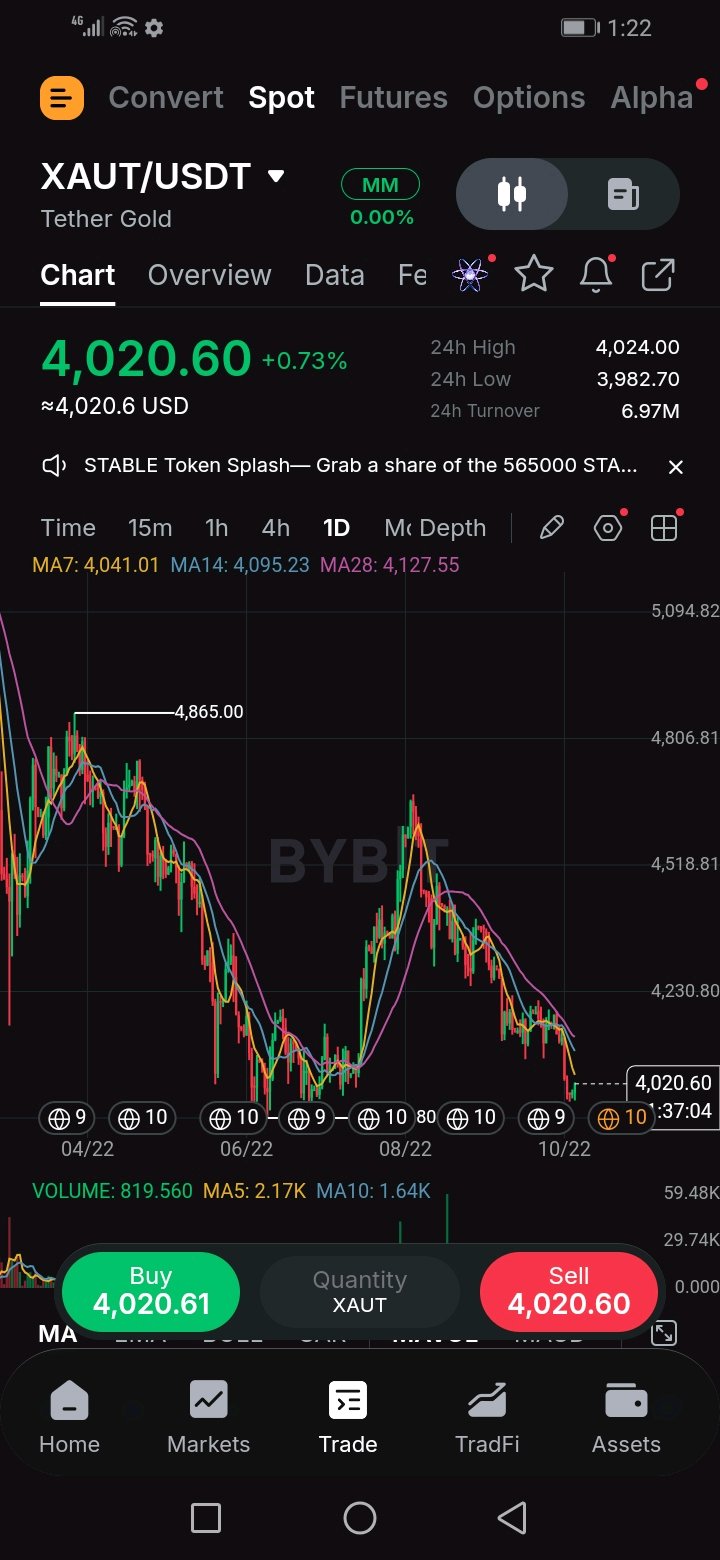
$XAUTUSDT peaked near 4,660 in the late-summer bounce and has bled back to 4,020, almost exactly where the base formed in June-August. The 3,980-3,985 zone has held as the 24h low and as the summer floor. A second touch can build a double bottom, but only if price reacts instead of just sitting there. Turnover and volume 24h turnover is about 7M USDT, and daily volume is 820 XAUT against a 5-day average of 2,170. That's roughly 40% of normal activity at a level this important. Light selling into support suggests sellers are running out of steam. It also means no one is defending the floor yet, and a bounce on thin volume is easy to fade. Levels Support: 3,985, then 3,950, then the lows from the summer base. Resistance: 4,041 (MA7), 4,095 (MA14), 4,127 (MA28), then 4,230 and 4,520. The 4,865 high is the big one far above. Price sits under all three moving averages, and they are stacked in bearish order. What I'm waiting for A daily close above 4,130 would clear all three averages, which hasn't happened since the pullback began. Without it, any bounce is just a relief move inside a downtrend. Plan Patient: long on a daily close above 4,130, stop under 3,960, first target 4,230, then 4,520. That's about 100 to 390 points of reward for 170 of risk. Aggressive: small size near 3,985-4,020, stop under 3,960 (about 50 points of risk), targets 4,095 and 4,127. Invalidation A daily close under 3,960 breaks the floor and the double-bottom idea. I'd stand aside there instead of averaging down. Risk Gold tracks macro, so a sudden move in the dollar or yields can run straight through technical levels. Keep size small. Idea only, not financial advice. Does the floor hold, or is this just a pause before the next leg down? #ByXIMPACT
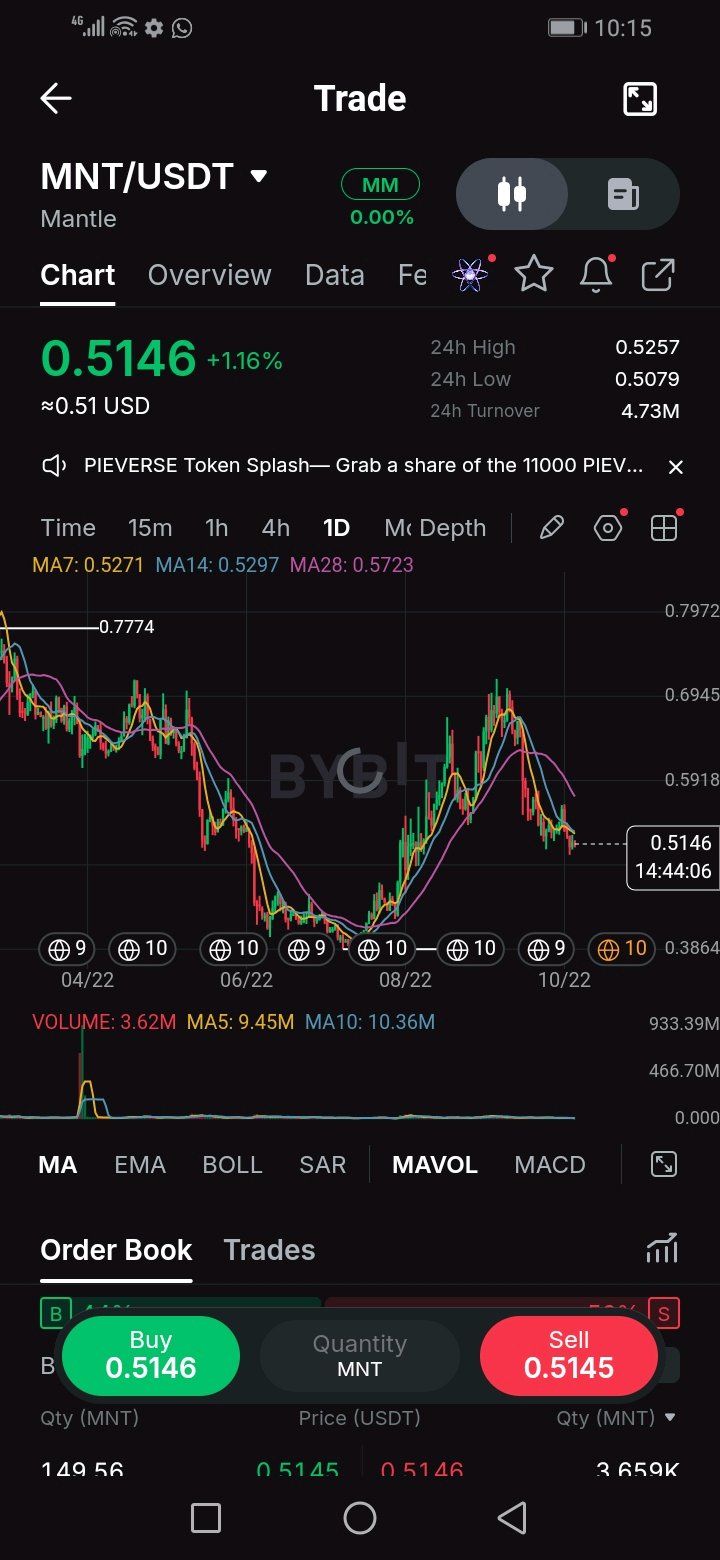
$MNTUSDT tells a longer story than the last few I've posted. MNT fell from near 0.78 down to a low around 0.39, then staged a real recovery back toward 0.69-0.70, and has since pulled back to 0.5146. The last several candles are small-bodied and tightly clustered, basically flat. After a move that size, flattening out isn't nothing, it's usually either accumulation before the next leg, or exhaustion before more downside. The chart alone won't tell you which. MA structure is worth watching closely here because it's mid-flip. The 7-day MA (0.5271) is below the 28-day (0.5723), but still above the 14-day (0.5297), and price is trading just under the 7 and 14. That's a short-term downtrend inside what's still technically a longer recovery. Not fully bearish, not fully bullish, genuinely sitting on the fence. Volume is the clearest signal on this chart. Today's volume is 3.62M, barely a third of the 5-day average (9.45M) and about a third of the 10-day (10.36M). The entire recovery leg was volume-driven, you can see the volume spike on the chart right where price turned off the 0.39 low, and that volume has since dried up almost completely. Low volume during a pullback is normal and not alarming by itself, but it also means there's no strong signal yet in either direction. This is a market waiting, not deciding. Support and resistance: - 0.51-0.53 is where price sits now, bounded by the 7-day and 14-day MAs. It's the immediate pivot. - 0.5079, the 24h low, is the near-term floor. A break opens the door toward the 28-day MA at 0.5723... wait, that's above, so let me redo this. Actually, below 0.5079, there isn't a clean reference level until price gets back toward the base of this pullback leg, roughly the 0.46-0.48 area visible on the chart before the recovery accelerated. - 0.5723, the 28-day MA, is the resistance that matters most. It's the line between "this is a dip in an uptrend" and "this is a failed recovery." - 0.69-0.70, the recovery high, is the level that would need to break for the bigger picture to turn genuinely bullish again. Level to watch: a daily close back above 0.5723 would flip the MA stack bullish and support the "this was just a pullback" read. A daily close below 0.5079 would break the recent low and raise the odds that the recovery leg is over. Consideration: with the MAs mid-crossover and volume this thin, there isn't a high-conviction setup sitting in front of you right now. This is more of a level-to-level chart than a trend to ride. I'd rather wait for the 28-day MA to be reclaimed or clearly rejected than guess which way a flat, low-volume range resolves. Risk note: thin volume during consolidation can snap in either direction once it returns, and the move can be sharp given how compressed these candles are. A stop below 0.5079 protects a long idea; a stop above 0.5723 protects a short idea. Don't trade the middle of this range without a clear trigger. This is my chart read, not financial advice. #ByXIMPACT
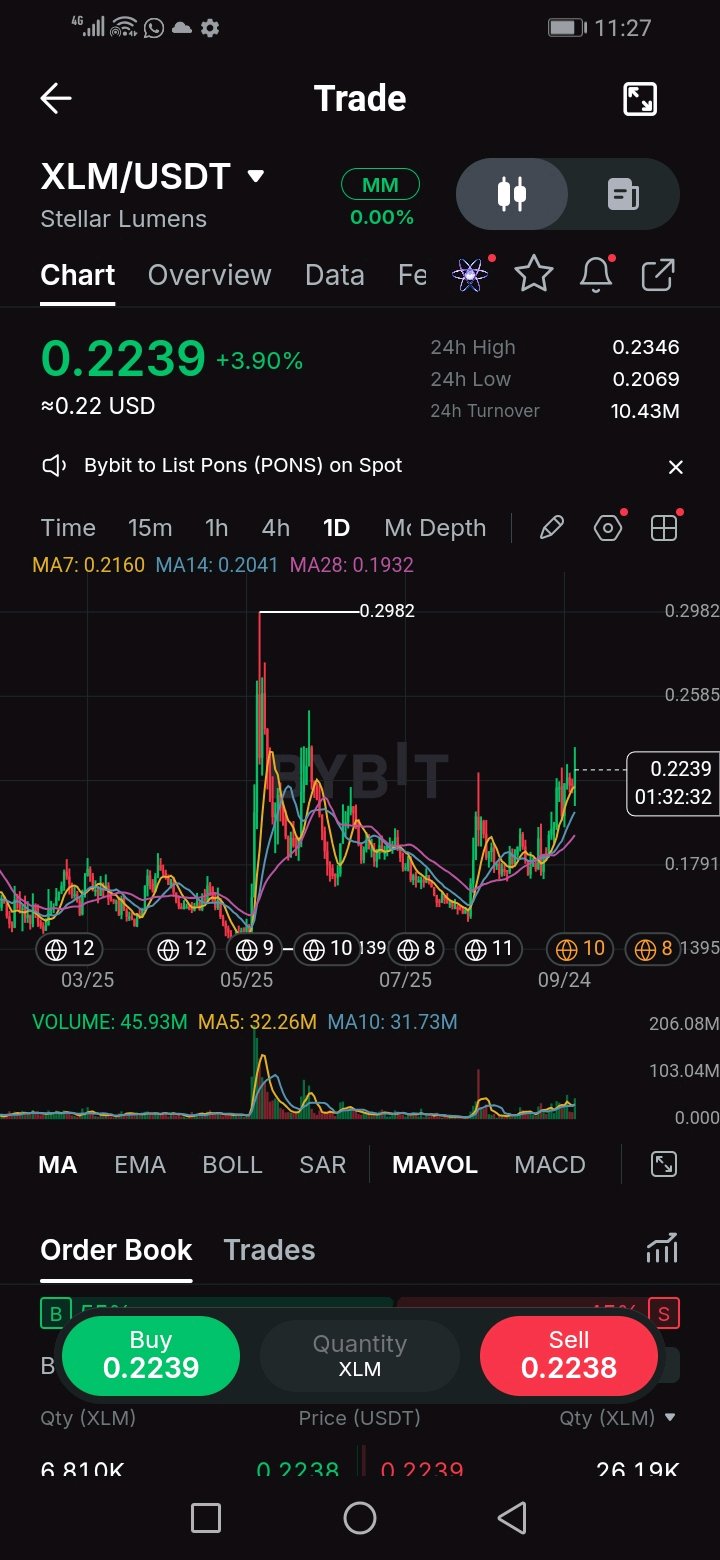
$XLMUSDT is a layer-1 blockchain token focused on fast, low-cost cross-border payments. On this daily chart, XLM is in a recovery phase after a sharp spike to 0.2982 back in May. Price consolidated for months and is now pushing higher again, currently at 0.2239 (+3.90% on the day). The structure shows higher lows forming since the July bottom, with price now approaching the upper range of its recent consolidation. TURNOVER: Turnover reflects the total value traded in the last 24 hours. At 10.43M USDT, liquidity is healthy for a mid-cap altcoin, meaning entries and exits are relatively easy without major slippage. The decent turnover combined with today's green candle suggests real buying interest is returning, not just thin-market noise. VOLUME Current: 45.93M MA5: 32.26M MA10: 31.73M Current volume is significantly above both the MA5 and MA10 averages. This is a bullish signal - rising price backed by rising volume confirms genuine buying pressure. Compare this to the massive spike in May (over 200M volume) which marked the blow-off top. Current volume is much healthier and suggests sustainable accumulation rather than speculative frenzy. MOVING AVERAGES (All Bullish) MA7 - 0.2160 MA14 - 0.2041 MA28 - 0.1932 Price is trading above all three moving averages, which are stacked in perfect bullish order (short > mid > long). The MAs are also sloping upward, confirming the trend has shifted bullish. The MA7 at 0.2160 is now acting as dynamic support on pullbacks. As long as price holds above this level, the short-term uptrend remains intact. LEVELS TO WATCH: Resistance: 0.2346 - 24h high (immediate resistance) 0.2585 - Mid-range resistance from May decline 0.2982 - Major swing high (breakout level) Support: 0.2160 - MA7 (first dynamic support) 0.2041 - MA14 (stronger support) 0.1932 - MA28 (trend-defining support) SUPPORT AND RESISTANCE EXPLAINED Support is where buyers tend to step in and halt a decline. Resistance is where sellers tend to step in and cap upside. On this chart: - 0.2346 is the first resistance - a clean break above with volume opens the door to 0.2585. - 0.2160 (MA7) is the first support - holding above this keeps the bullish structure valid. - 0.2982 is the major resistance - only a break above this would signal a full trend reversal from the May top. These levels define where traders place entries, stop losses, and take profits, shaping the risk/reward of any trade. TRADE CONSIDERATIONS Bias: Bullish while price stays above MA7 - Long Zone: Near MA7 (~0.2160) on a pullback - Invalidation: Below MA14 (~0.2041) - Target 1: 0.2346 (24h high) - Target 2: 0.2585 (mid-range resistance) - Target 3: 0.2982 (major swing high) Alternative scenario: If price rejects at 0.2346 with declining volume, a pullback to MA7 or MA14 is likely. A break below MA14 would weaken the bullish thesis and shift bias to neutral. RISK NOTE: XLM is a mid-cap altcoin with higher volatility than major assets. Moves can be fast in both directions, especially around broader market sentiment and Bitcoin's direction. - Never risk more than 1-2% of your portfolio on a single trade - Always use stop losses below your invalidation level - Do not chase green candles into resistance - wait for pullbacks or confirmed breakouts - Volume confirmation is key - breakouts on low volume often fail Not financial advice. Always DYOR and manage your risk. #XLMUSDT #ByXIMPACT
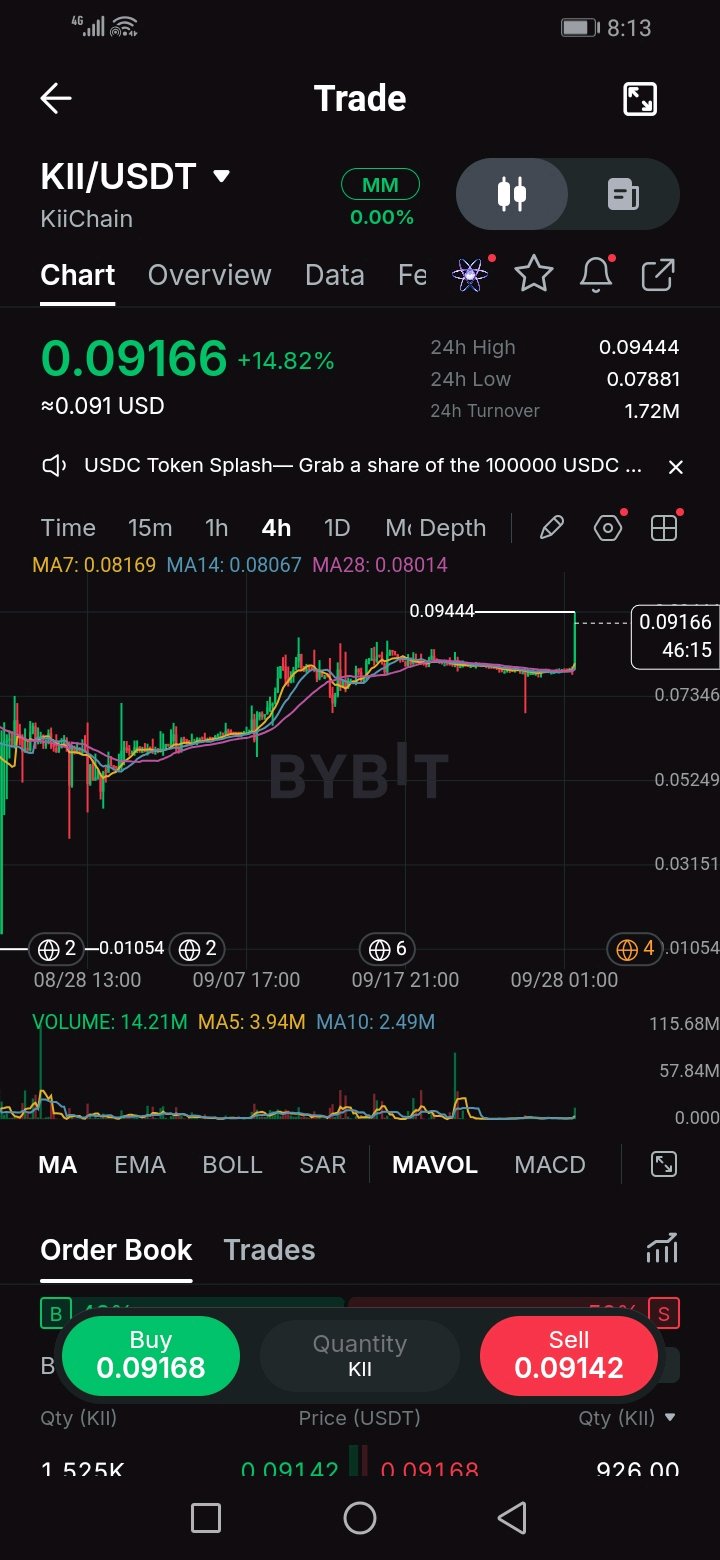
$KIIUSDT The +14.8% isn't what stands out here. The volume is. The breakout candle has printed 14.2M KII against a 5-candle average of 3.9M and a 10-candle average of 2.5M. That's roughly 3.6x and 5.7x normal participation in a single candle, so this move isn't drifting up on thin air. Turnover backs it up. 24h turnover is 1.72M, and this one candle (14.2M KII at around 0.09) accounts for roughly 1.3M of it, close to three-quarters of the day's traded value in one 4-hour window. That's what a real burst looks like. It also says the market was very quiet before it, which makes this a thin book. Thin books move fast in both directions. Context: after the earlier rally, KII went sideways from about 09/17, pinned near 0.08 with candles barely moving. The 7/14/28 MAs (0.0817 / 0.0807 / 0.0801) squeezed into a band about 2% wide. When averages compress like that, the range usually resolves with a burst, and this candle is that resolution to the upside. Price is now about 12% above the 7 MA and 14% above the 14 and 28. Support and resistance: - 0.080-0.082 is the MA cluster and the base of the range. It's where the breakout started, so it's the first place a healthy retest should hold. Below it, 0.0788 (the 24h low) is the last marker before the range is back in play. - Roughly 0.085-0.088 is where a heavy-volume spike got rejected around 09/20. Price is now above it, so the old ceiling becomes a possible floor. - 0.0944 is today's wick high and the immediate resistance. Above it there's no prior reference on this view, since price is at the highest level in the visible window. Level to watch: the close of this 4H candle. A close near the highs shows buyers held the move. A long upper wick with a close back near 0.085 says the breakout got sold into. After that, the question is whether 0.0944 gets reclaimed and held, not just tagged. Consideration: after +15% in one candle, chasing has poor risk/reward, because a stop under the 0.080 base is about 13% away. I'd rather see one of two things: a retest of the 0.085-0.088 zone that holds, or a tight consolidation above 0.0944 with volume staying elevated. If volume fades back toward the 2-4M range while price holds, that's digestion. If volume stays huge and price stalls, that looks like distribution. Risk note: this is a low-liquidity token, so expect slippage and use limit orders. Breakout candles on small caps often retrace fully to the base, and a single wick can trigger stops. Size the position for the distance to your invalidation, and don't size for how strong the candle looks. This is my chart read, not financial advice. #ByXIMPACT
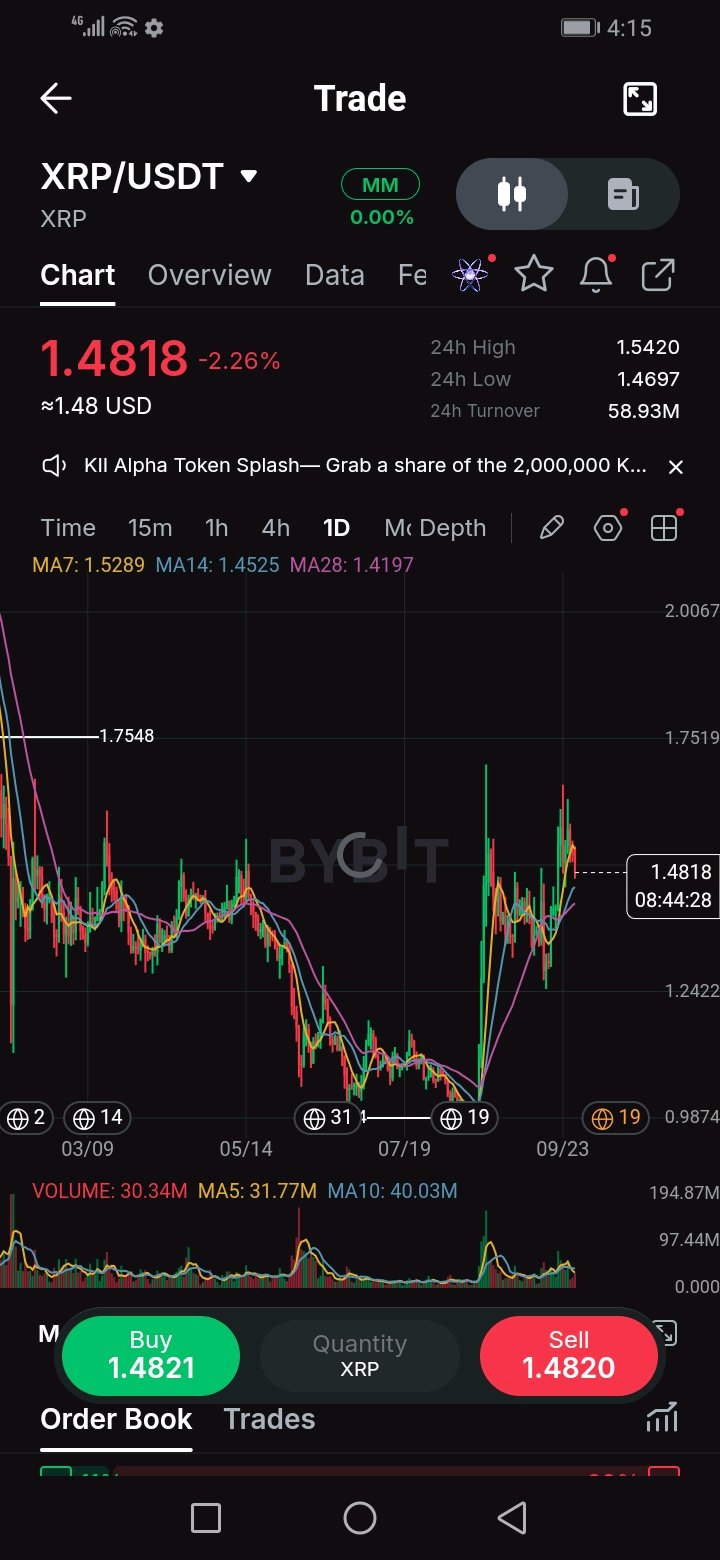
$XRPUSDT tried the upper end of its range twice. The second attempt came in lower than the first. After the run from the ~1.0 low, price spiked into the mid-1.6s to 1.7, pulled back, and built a base above 1.25. The latest push topped out a little short of that first spike and got sold back to 1.48. It's a small thing, but a lower high on a retest is the kind of detail that tells you buyers are getting pickier. What keeps me from turning bearish is the structure underneath. The 7, 14 and 28-day MAs are still stacked in order (1.529 / 1.452 / 1.420) and rising, and price is holding above the two slower ones. This looks like a pause inside an uptrend, not a broken one. The zone I'm watching is 1.42 to 1.47. The 24h low (1.4697), the 14-day MA and the 28-day MA all sit there, so it's the first real test of whether dip buyers still show up. If it holds and price reclaims the 7-day MA near 1.53, the range top is back in play. If daily candles start closing under 1.42, I'd expect the 1.25 to 1.30 base to be revisited before anything constructive happens. Volume isn't confirming the move yet. Today's 30M is below the 10-day average of about 40M, though the candle is still open, so I'm reserving judgment until the close. Until XRP either reclaims 1.53 or defends that MA cluster, I'm treating the middle of the range as no-man's-land, not an entry. #ByXIMPACT
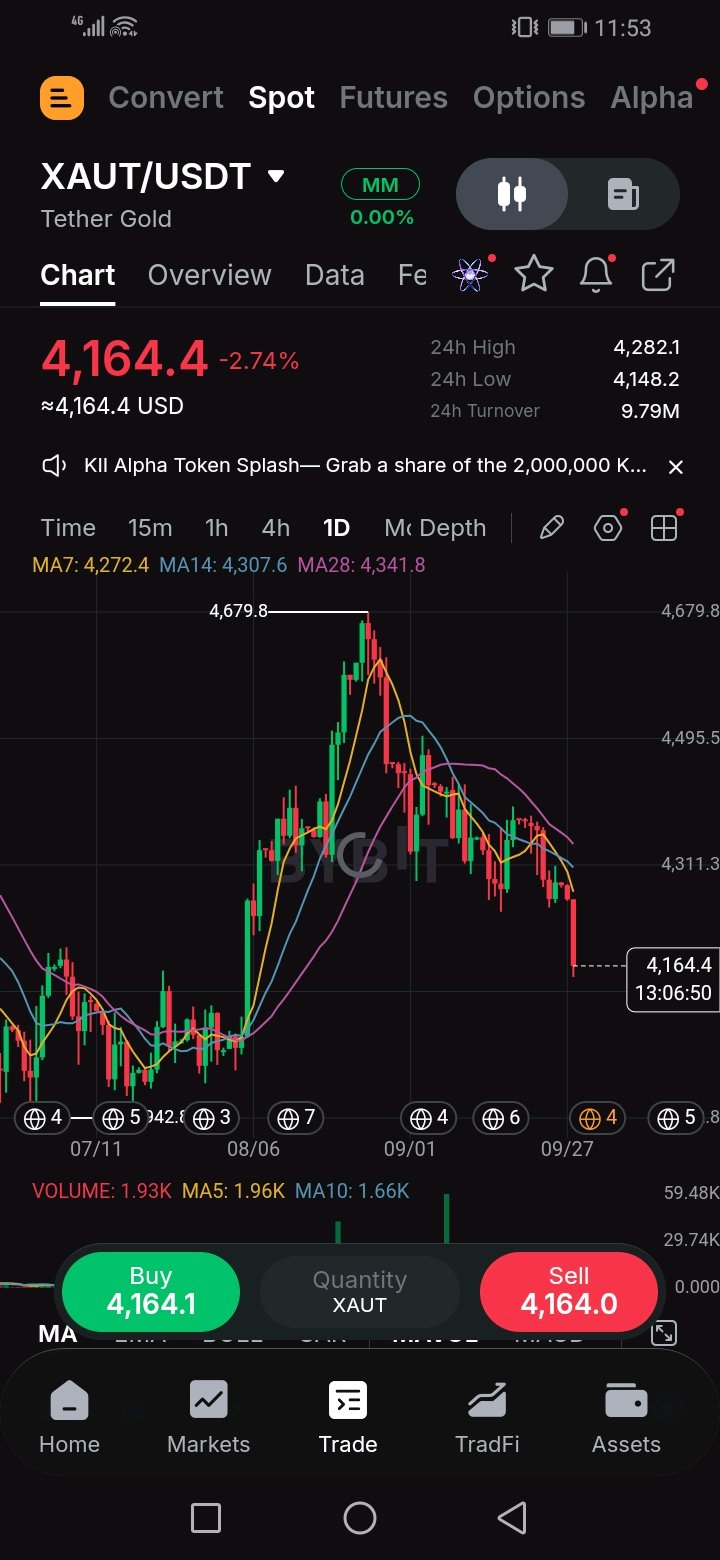
$XAUTUSDT topped out at 4,679.8 and has been in a steady downtrend since. Price is currently making new local lows near 4,164.4, down 2.74% on the day. The structure is clearly bearish with lower highs and lower lows. MOVING AVERAGES (All Bearish) MA7 - 4,272.4 MA14 - 4,307.6 MA28 - 4,341.8 Price is trading below all three moving averages, which are stacked in bearish order (short < mid < long). The MA7 is acting as immediate dynamic resistance. This confirms sellers are in control of the daily timeframe. VOLUME: Current: 1.93K MA5: 1.96K MA10: 1.66K Volume is relatively flat and slightly below the MA5 average. This suggests the current selloff is not driven by panic volume, but the lack of buying pressure means the path of least resistance remains down. KEY LEVELS TO WATCH: Resistance: 4,272.4 (MA7 - first hurdle for bulls) 4,307.6 (MA14 - stronger resistance) Support: 4,148.2 (24h low - immediate support) 4,000.0 (psychological round number) TRADE IDEA Bias: Bearish while below MA7 Short Zone: Near MA7 (~4,272) if price retests Invalidation: Above MA14 (~4,307) Target: 4,148 and potentially 4,000 A clean break below 4,148 with volume could accelerate the drop toward 4,000. Conversely, reclaiming the MA7 would be the first sign of a potential reversal. Not financial advice. Always DYOR and manage your risk. #XAUTUSDT #ByXIMPACT
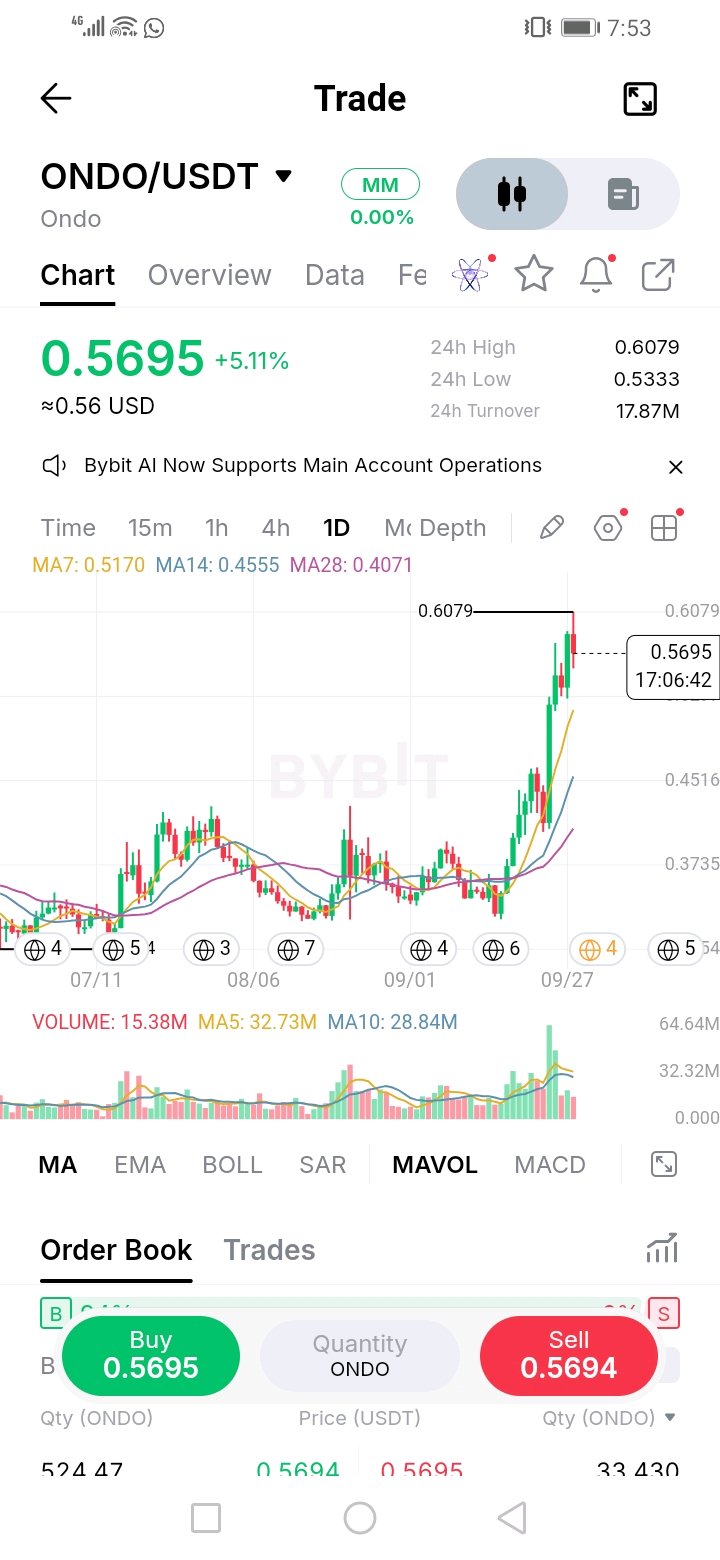
$ONDOUSDT went from months of chop between roughly 0.32 and 0.42 to 0.60 on the daily in under two weeks, and today's candle already shows the first rejection: a wick to 0.6079, then back to 0.57. I'm not shorting that, but I'm not chasing it either. Price is about 10% above the 7-day MA (0.517), 25% above the 14 (0.455) and almost 40% above the 28 (0.407). Moves this stretched usually cool off, either by time or by price, before the next leg. What decides it from here: Holding 0.533 (today's low) and moving sideways is healthy digestion. The bulls keep control. A dip toward 0.517, the 7-day MA, is where I'd want to see buyers step in, ideally on lighter selling than the breakout days. A daily close above 0.6079 absorbs the wick and confirms continuation. A daily close below 0.517 turns this into a spike, and the old range top around 0.42-0.43 becomes the real test. Volume is the tell. Today's 15M is well under the 5-day average of about 33M, but the day isn't closed yet, so I'll judge it at the close. No entry for me on the green candle. I'm waiting for either the pullback or the reclaim. #ByXIMPACT
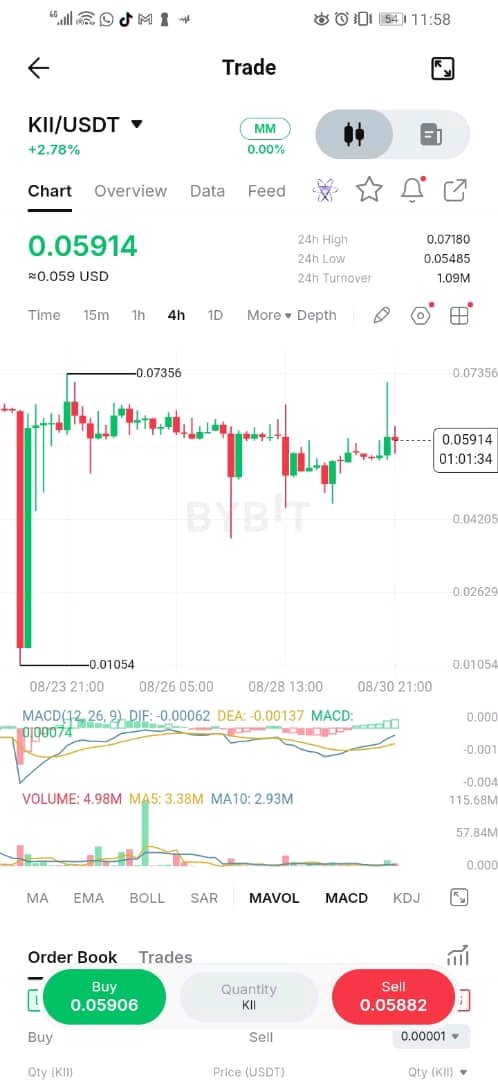
$KIIUSDT — 4H View: Massive Initial Spike Now Fully Cooled, Basing Near Recent Lows 💡 Bias Read: Neutral, early stabilization signs. This 4H chart tells a bigger story than the shorter timeframe — KII exploded from 0.01054 to 0.07356 in an enormous initial move, then spent days grinding lower, and only in the last several candles has it started forming a genuine base rather than continuing straight down. 🔑 Key Point: The scale of the original spike (nearly 7x) makes the multi-day decline since look almost inevitable — parabolic moves this size rarely hold their highs, and what matters now is whether the recent stabilization near 0.055-0.059 represents real accumulation or just a pause before more downside. 📊 Previous Price: 0.07356 (spike high) → 0.01054 (pre-spike low, structurally distant) 📊 Current Price: 0.05914 (+2.78% on the day) 🕯️ Candle Read: The last handful of 4H candles are smaller, mixed green/red bodies after a long stretch of red-dominant decline — the first real sign of two-sided trading rather than one-directional selling. 🟢 Support: 0.05485, then 0.04205 🔻 Resistance: 0.07180, well above current structure and likely a longer-term target only 📈 Volume: Current volume (4.98M) is above both MA5 (3.38M) and MA10 (2.93M) — a notable pickup relative to the recent quiet decline, worth watching as a possible sign of renewed interest at these levels. 📈 Momentum: MACD's DIF (-0.00062) remains below DEA (-0.00137), but the histogram has turned positive (0.00074) — an early bullish shift after weeks of negative momentum, though still far from a confirmed trend change. Scenario Paths: Hold above 0.05485 with continued volume → potential recovery attempt toward 0.07180, though likely gradual given the scale of the prior decline Break below 0.05485 → likely resumes the broader downtrend, opening room toward 0.04205 🎯 Target Zone: 0.07180 (long-term reclaim, not a near-term expectation) 🛑 Invalidation Level: 0.05485 — the level defining whether this stabilization holds ⚠️ Factors to Consider: This coin already gave back the vast majority of an extreme spike — even with stabilization signs present, the base is very young and needs more time and volume before it can be treated as a reliable floor.
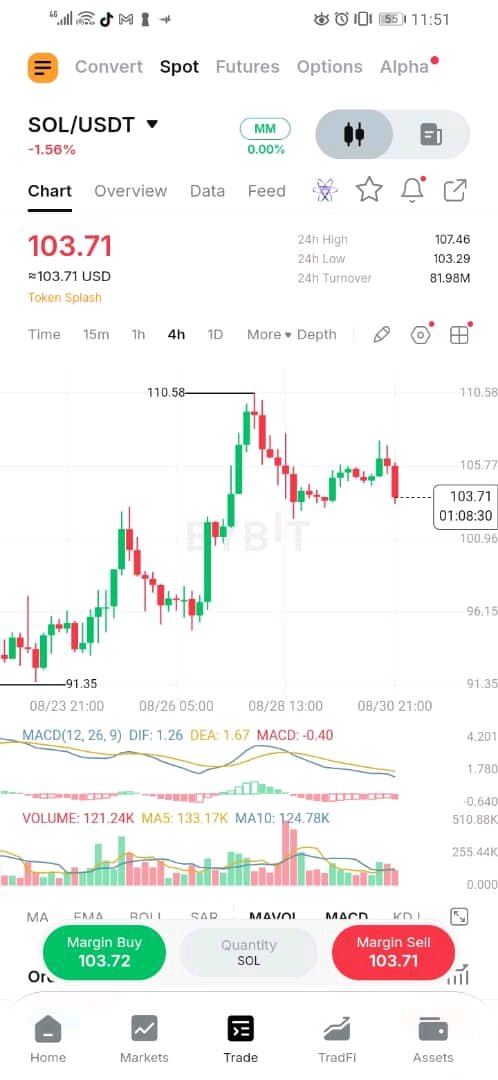
$SOLUSDT — Strong Multi-Week Uptrend Now Pulling Back From the Highs 💡 Bias Read: Bullish trend, currently correcting. SOL has been in a clear, sustained uptrend since late August, climbing from 91.35 to a high of 110.58, and is now working through its first real pullback since the rally accelerated. 🔑 Key Point: The structure here is textbook trending behavior — a steady climb, a sharp acceleration leg into the highs, and now a corrective pullback that's so far respected the broader trend rather than collapsing the entire structure, unlike some of the choppier range-bound charts seen elsewhere today. 📊 Previous Price: 110.58 (recent high) → 91.35 (multi-week low) 📊 Current Price: 103.71 (-1.56% on the day) 🕯️ Candle Read: The pullback candles from the high are steady red bodies with moderate size — controlled selling rather than panic, consistent with profit-taking after a strong run rather than a trend reversal. 🟢 Support: 103.29, then 100.96 🔻 Resistance: 105.77, then 110.58 📈 Volume: Current volume (121.24K) is below MA5 (133.17K) and MA10 (124.78K) — the pullback is happening on lighter volume than the rally itself, which typically favors the broader uptrend continuing rather than a full reversal. 📈 Momentum: MACD's DIF (1.26) has crossed below DEA (1.67) with a negative histogram (-0.40) — the first bearish cross since the trend began, a sign this pullback has some real short-term momentum behind it, worth watching closely. Scenario Paths: Hold above 103.29 and stabilize → likely resumes toward 105.77 and a retest of 110.58 Break below 103.29 → deeper correction likely, testing 100.96 and the strength of the broader trend 🎯 Target Zone: 105.77 (near-term reclaim), 110.58 on full trend resumption 🛑 Invalidation Level: 100.96 — a break below would signal this is more than a routine pullback ⚠️ Factors to Consider: This is the first bearish MACD cross of the entire uptrend — not necessarily a reversal signal on its own, but worth treating this pullback with more caution than a routine dip until price proves it's holding the trendline. #ByXIMPACT
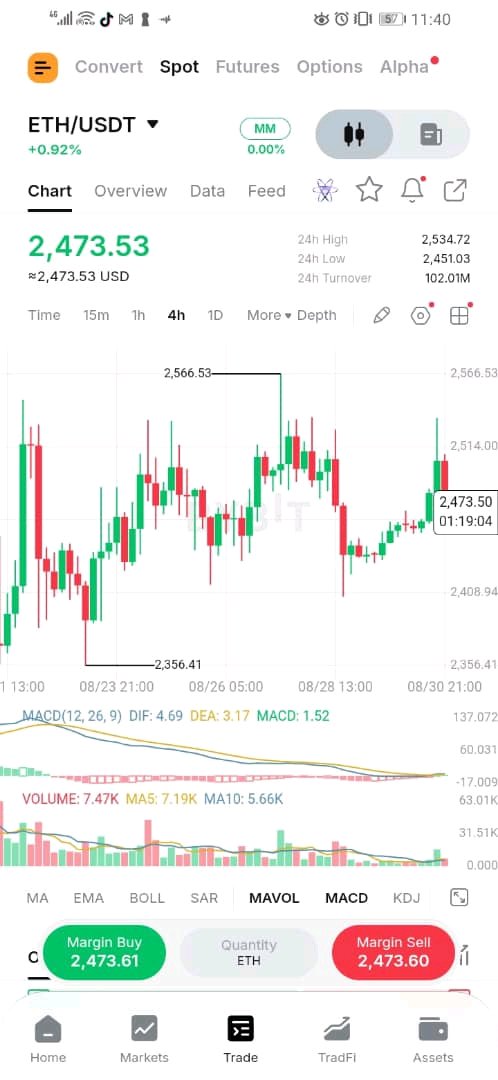
$ETHUSDT — 4H Range Persists, Sharp Bounce Off the Recent Low Now Testing Mid-Range 💡 Bias Read: Neutral-to-bullish. ETH has been trading in a wide, choppy range between roughly 2,356 and 2,566 for over a week, and the current move is a strong bounce off the most recent swing low, now pushing back into the middle of that range. 🔑 Key Point: This 4H chart shows a market that hasn't committed to a clear trend in either direction for days — multiple swing highs near 2,530-2,566 and multiple swing lows near 2,356-2,410, with the latest bounce being one of the sharper legs within that range rather than a breakout. 📊 Previous Price: 2,534.72 (24h high) → 2,451.03 (24h low) 📊 Current Price: 2,473.53 (+0.92%) 🕯️ Candle Read: The most recent 4H candle is a large green body following a stretch of small red candles near the low — a decisive shift after a quiet consolidation phase, worth watching to see if it follows through. 🟢 Support: 2,451.03, then 2,408.94 🔻 Resistance: 2,514.00, then 2,566.53 📈 Volume: Current volume (7.47K) is above both MA5 (7.19K) and MA10 (5.66K) — this bounce is happening with volume actually picking up, a more encouraging sign than some of the lighter-volume recoveries seen in recent charts. 📈 Momentum: MACD's DIF (4.69) sits above DEA (3.17) with a positive histogram (1.52) — the histogram has been compressing over recent candles even as this bounce plays out, so momentum is supportive but not yet accelerating. Scenario Paths: Break and hold above 2,514.00 with continued volume → opens room toward 2,566.53, testing the top of the multi-day range Fade below 2,451.03 → likely returns to chopping through the middle of the established range 🎯 Target Zone: 2,514.00 (near-term), 2,566.53 on a stronger push 🛑 Invalidation Level: 2,408.94 — a break below would suggest the range is breaking down to the downside rather than resolving up ⚠️ Factors to Consider: This is a market that's been range-bound for over a week — strong single candles within a range don't guarantee a breakout, so watching whether the next few candles hold this bounce matters more than the move itself. #ByXIMPACT
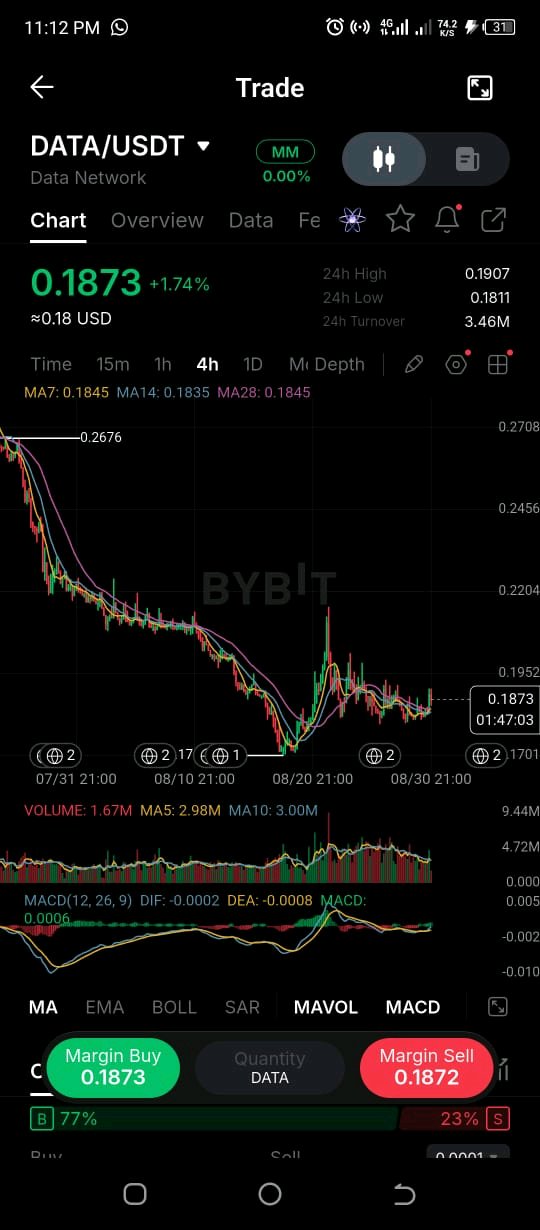
$DATAUSDT formerly Story Protocol rebranded in June from an IP-management chain into infrastructure for verifiable AI training data, with a new on-chain audit layer called Trace tracking where training data actually comes from. That pivot has real usage behind it: the network crossed 100 million on-chain data registrations on July 24. On the supply side, the foundation has now delayed the team/investor/insider token unlock twice first pushed six months earlier this year, then extended another 18 months on August 5, moving the date all the way to February 2028. Total allocations haven't changed, just the timing. That's either a strong signal of long-term alignment, or a tell that the team doesn't think the market can absorb that supply yet reasonable people land on both sides of that read. What hasn't moved: DATA is still down roughly 98.6% from its $14.89 all-time high set last September. A real usage milestone and two consecutive unlock delays haven't been enough to reverse that trend yet they've mostly kept the chart from getting worse. Support/Resistance: $0.1811 (this session's low) is holding right at the base of the recent consolidation range. $0.1907 is the high; the range has been tightening between roughly $0.18 and $0.20 for the past several sessions, meaning a break either direction likely carries follow-through. Volume: Running below both the 5- and 10-period averages this is a quiet consolidation candle, not a decisive move in either direction. Turnover: $3.46M on this window solid, real liquidity for a token at this market cap. MACD:DIF is still marginally negative but the histogram just turned positive an early, tentative momentum shift, not a confirmed one. Genuine product pivot, genuine usage growth, and a supply overhang the team keeps pushing further out rather than resolving. The range is tight enough that the next break will say more than the news has. #ByXIMPACT $BTCUSDT
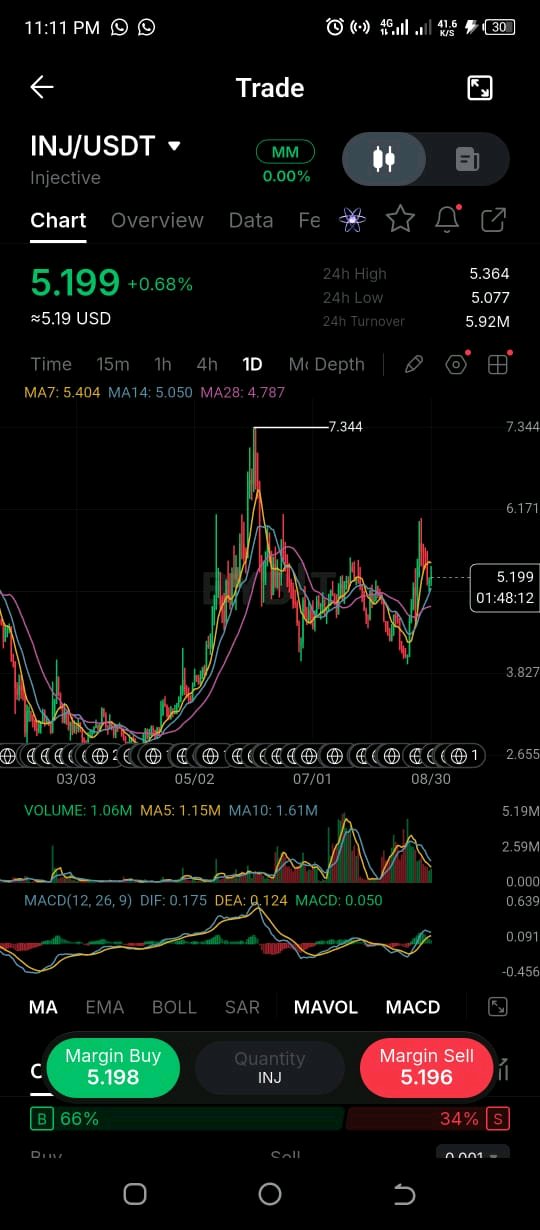
$INJUSDT picked up two real regulatory milestones in the span of a week: its institutional arm became an SEC-registered transfer agent on August 19 meaning it can maintain official on-chain records for tokenized securities, following a pilot with POSCO International and LG CNS and Canary Capital filed for a staked INJ ETF on August 24, now sitting in SEC review. That combination triggered a genuine 39% rally in the days after. Worth noting on the supply side too: INJ's circulating supply is essentially at its 100M cap already there's no meaningful unlock overhang left and the protocol runs a monthly Community Buyback that's permanently burned over 33,000 INJ in August alone, on top of roughly 7.2M burned cumulatively since launch. Rare combination: a fixed-supply asset that's actively shrinking, not diluting. The chart's already caught up to that story, though. Price ran from the low-4s to a recent high near 7.3, and today it's sitting at 5.199 below MA7 (5.404) after pulling back from the highs. This is a rally digesting itself, not a fresh breakout. Support/Resistance: $5.077 (today's low) is the near-term floor; below that, MA14 at $5.050 is the next real support. On the upside, traders have flagged $5.575 as the key resistance reclaiming that would reopen the path toward the recent highs near $7.34. Volume: Today's volume is running below both the 5- and 10-day averages the rally's cooling in terms of participation, consistent with a pause rather than continued momentum. Turnover: $5.92M on the session solid, real liquidity for a token at this market cap. MACD: Still positive with DIF above DEA, but the histogram is well off its recent peak bullish trend intact, momentum fading. Strong institutional narrative, structurally tightening supply, chart that ran hard and is now catching its breath below the last swing high. Not broken, just resting. #ByXIMPACT $BTCUSDT