Mantein
Crypto Expert
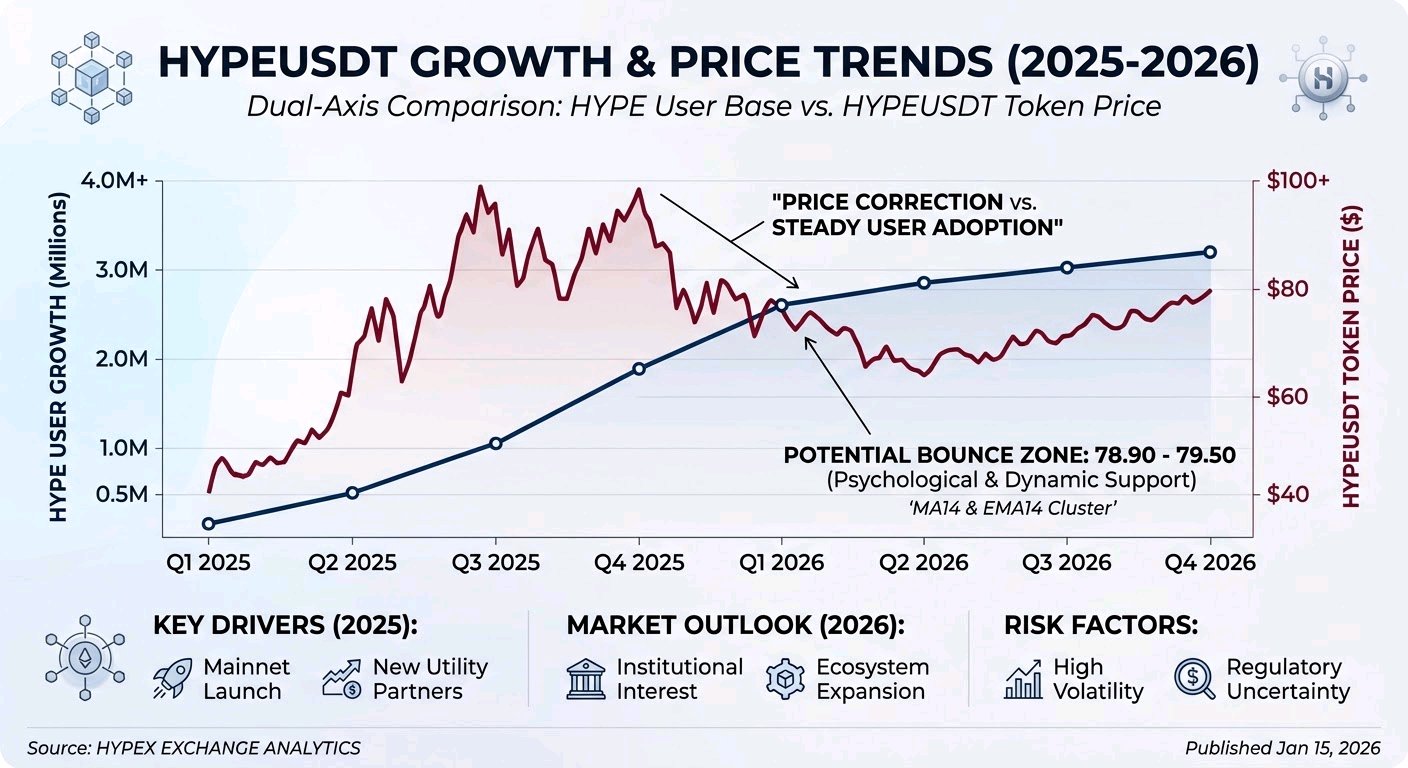
$HYPEUSDT pushed to nearly 98 and has been correcting hard ever since. Now it's drifting into a zone where a bounce has real odds. I'm not telling anyone to long blindly. What matters here is the spot where risk-to-reward starts to tilt your way. Support Price is resting on the psychological 80 level, and the more important detail is how it's squeezing into the MA14 and EMA14 cluster around 78.90 to 79.50. Today's daily candle is fighting to hold that dynamic support. If the zone breaks on a daily close, the structural damage gets a lot worse. Volume Put this latest leg down next to the first dump from the highs. The red candles are shrinking, and volume is clearly thinner than it was on that initial drop. Sellers seem to be running low on ammunition. My take MACD is still under the zero line, but look closely at the histogram. Those red bars are getting shorter, which is a classic early hint that bearish momentum is losing steam. Resistance If the bounce plays out, the first ceiling is the EMA28 at 81.57, then the heavier MA28 at 83.26. I'd expect a strong rejection around 83 the first time price gets there. The plan For a long, I want today's 1D candle to finish strong near its highs, around 79.30 or better. The target is a relief bounce into the 81.50 to 83.00 resistance zone. If price reaches it and looks weak on the lower timeframes, that's a prime area to take profit. What proves me wrong A decisive daily close below the 77.00 local low ends the bounce thesis. If that happens, the next big liquidity pool sits down in the 70s. Risk HYPE is volatile and runs on narrative, so sentiment can turn in a heartbeat. Don't hold blindly through the resistance levels above. Take profits mechanically as it climbs. So are you scaling into this support, or waiting to see if 77 goes first? #ByXIMPACT #BybitStocks
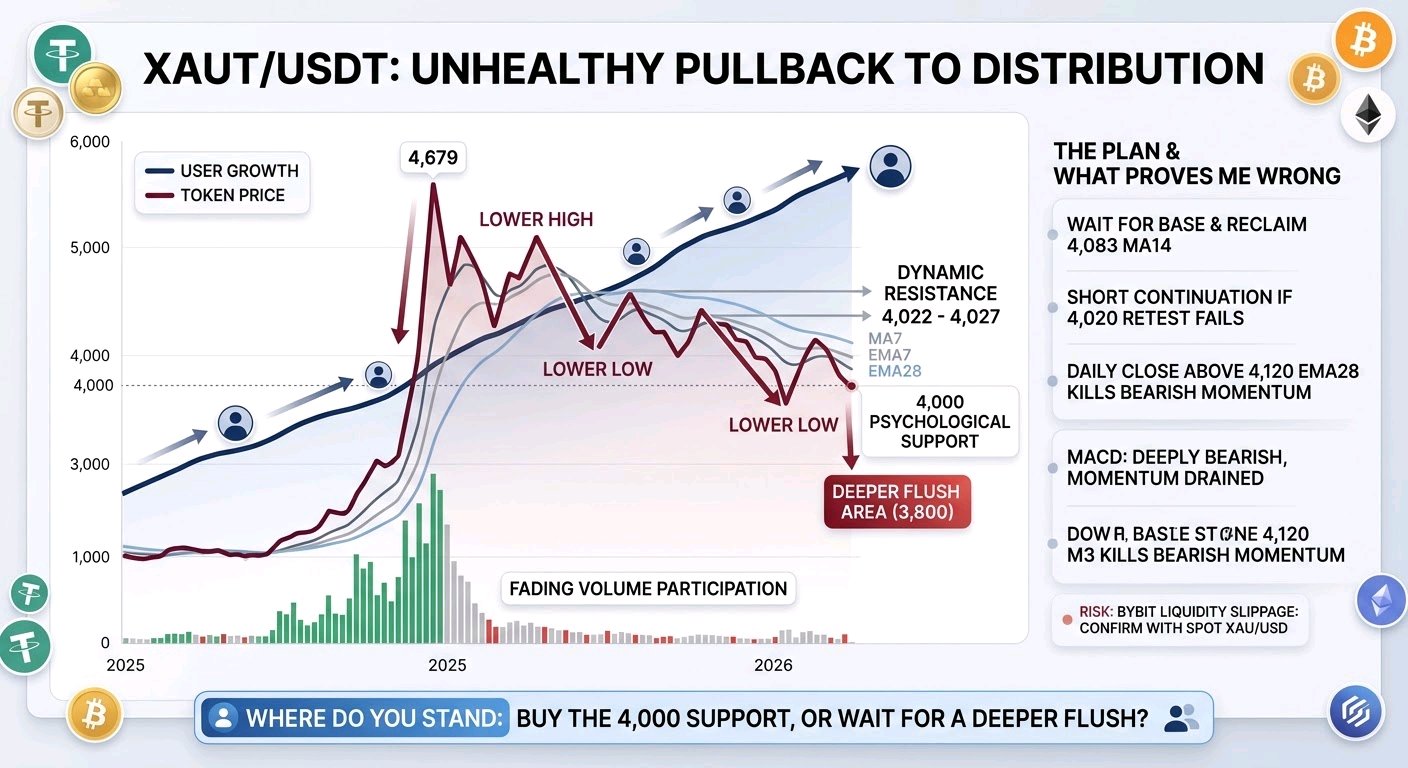
$XAUTUSDT went vertical to 4,679, and the character of this market has flipped since the peak. It's no longer a healthy pullback. What's printing now is distribution: lower highs, lower lows, one after another. **Volume** The green candles on the way up were packed with participation. On the way down, that buying has faded to almost nothing. No one is stepping in to defend dips with any conviction, so the market is still feeling around for a level where it can settle. **Resistance** Every moving average is stacked above price. We're trading well under MA7 and EMA7, which sit around 4,022 to 4,027 and now act as dynamic resistance. Each bounce keeps getting sold into. **Support** Price is parked right on the psychological 4,000 level. A daily close beneath it opens the way to a deeper retracement toward 3,800. **My take** MACD is deeply bearish and the momentum has clearly drained out. Don't buy this falling knife just because it says gold and feels like a safe haven. A chart is a chart, and when the daily trend points down, it points down. **The plan** For now I'm doing nothing. I need to see price consolidate, build a base, and win back the 4,083 MA14 on strong volume. If a retest of 4,020 comes in weak and fails, I'd look to short the continuation. **What proves me wrong** A strong daily close above the 4,120 EMA28 would kill the bearish momentum. Until then, the easiest path is still lower. **Risk** Tokenized gold on Bybit can slip a little away from the real spot price thanks to thin liquidity or platform-specific premiums. Confirm against spot gold (XAU/USD) before committing heavy size. So where do you stand: buying the 4,000 support, or waiting for a deeper flush? #MyByXTake #ByXIMPACT #BybitStocks
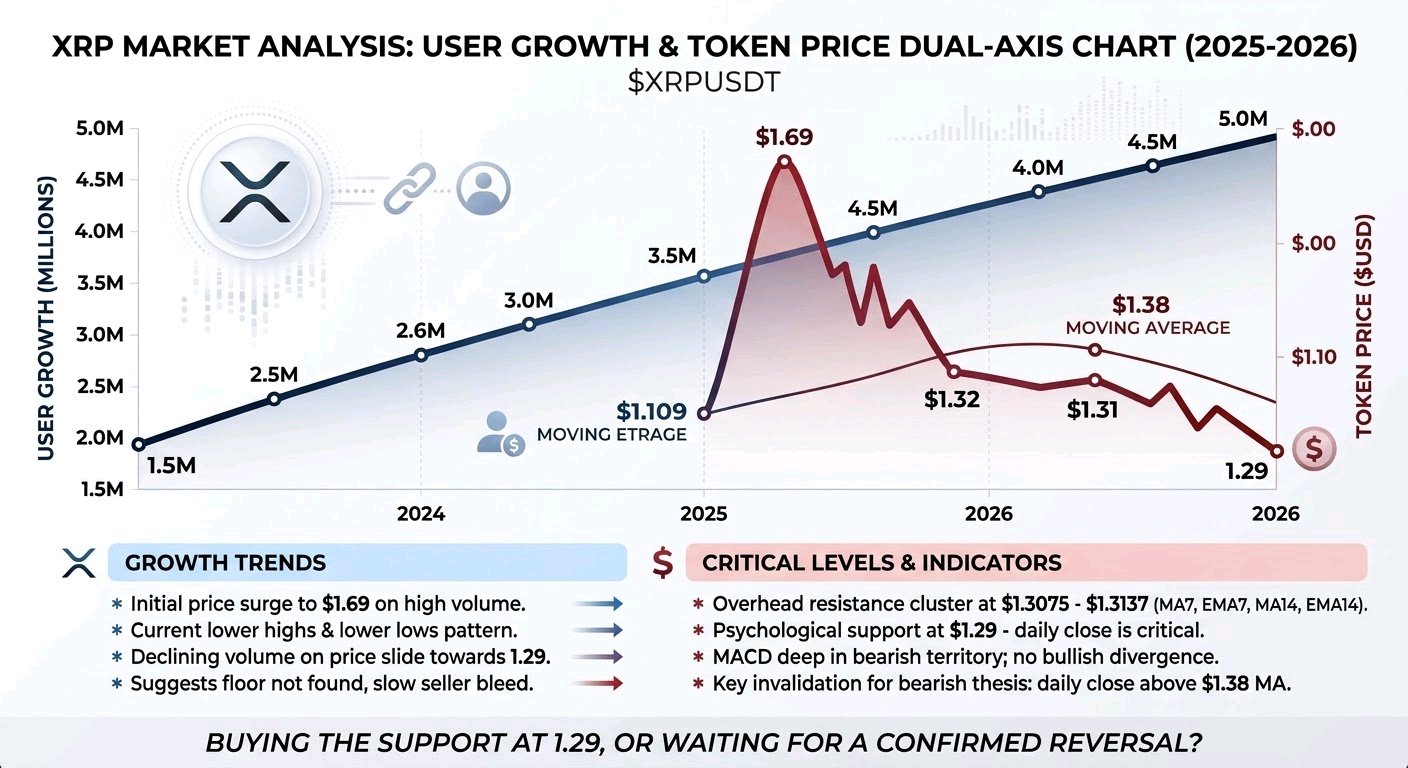
$XRPUSDT shot up to 1.69, and the daily chart has been sliding ever since, one lower high and lower low after another. This latest leg down is just more of the same trend. Volume Look at the bars at the bottom. The first sell-off from the top had real volume behind it. The slow drift toward 1.29 has almost none. It's flat. Nobody is panicking or dumping, and that tells me the real floor probably isn't in yet. Sellers are just letting the air out slowly. Resistance Overhead, the moving averages are stacked up. MA7 and EMA7 sit around 1.3075, and MA14 and EMA14 are just above at about 1.3137. Every time price pokes into that area, it gets pushed back down. Support The level I'm watching is 1.29, a round number traders tend to care about. If it gives way on a daily close, the next big demand zone is a long way lower. My take MACD is still deep in bearish territory, and the histogram isn't showing any bullish divergence. I'm not trying to call the bottom here. Trying to catch a falling knife in a large-cap altcoin rarely goes well. The plan I'm patient for now. I want to see a daily close above the 1.32 resistance cluster, with a real spike in buying volume behind it. If all we get is a weak, low-volume bounce to 1.31, I'd be more tempted to short it than buy it. What proves me wrong A strong daily close above the 1.38 moving average. Risk XRP trades heavily on headlines and can wick violently on SEC rumors or broader market swings. Keep leverage low in this chop, protect your capital, and don't size up until the trend actually turns. So what's your move: buying this support, or waiting for a confirmed reversal? #BybitStocks #ByXIMPACT
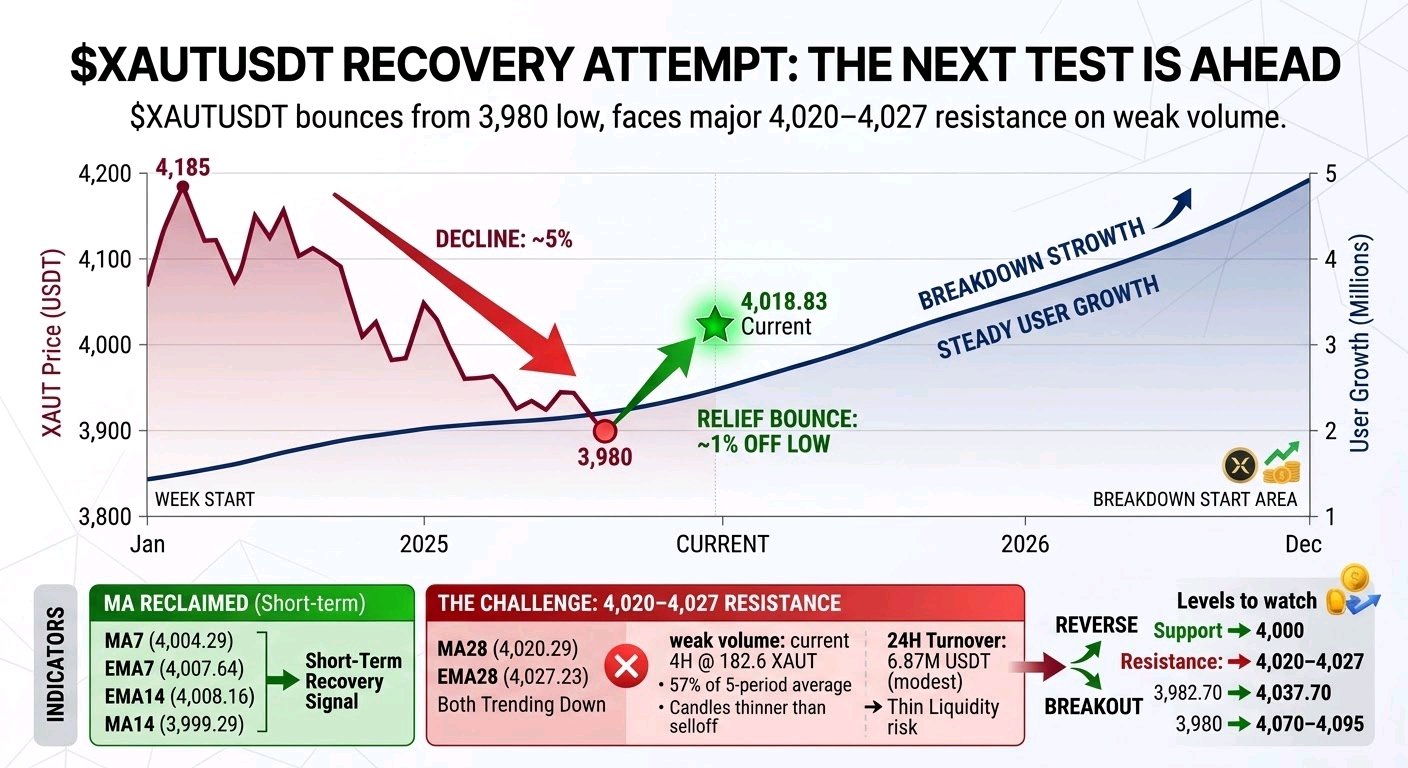
$XAUTUSDT is trying to recover, but the real test is just ahead. XAUT dropped from around 4,185 to 3,980, losing roughly 5% as sellers kept control and pushed all the moving averages lower. Since hitting that low, price has bounced about 1% and is now trading at 4,018.83. There are some early signs of recovery. Price has climbed back above the short-term averages: - MA7: 4,004.29 - EMA7: 4,007.64 - EMA14: 4,008.16 - MA14: 3,999.29 That's encouraging, but I wouldn't call it a reversal yet. The problem is what's sitting just above the current price. MA28 is at 4,020.29, while EMA28 is at 4,027.23. Both are still trending downward, making the 4,020–4,027 area the first major test for buyers. Volume isn't giving bulls much confidence yet. The current 4H candle has traded 182.6 XAUT, worth around 733.6K USDT. That's roughly 57% of the 5-period average volume of 322 and still below the 10-period average of 235. Something else stands out: the candles during the selloff carried noticeably more volume than the candles behind this bounce. 24H turnover is 6.87M USDT, which is relatively modest. With thinner liquidity, price can move sharply in either direction. For now, this looks more like a relief bounce than a confirmed recovery. Stronger buying needs to show up before the picture changes. The levels that matter now Support: - 4,000 — a psychological level, with MA14 at 3,999.29 - 3,982.70 — 24H low - 3,980 — recent swing low Resistance: - 4,020–4,027 — MA28 and EMA28, with the 24H high at 4,024 - 4,037.70 — next resistance - 4,070–4,095 — the area where the breakdown began My plan from here I'm not chasing XAUT at 4,018.83 when price is already pushing into resistance. For a long entry, I'd want to see a 4H candle close above 4,027 with volume recovering above roughly 320. After that, the ideal confirmation would be a retest of 4,020–4,027 that holds. Entry reference: 4,025 Stop-loss: Below 3,995 Targets: - 4,037.70 - 4,070 — around 1.5R - 4,095 — around 2.3R These reward estimates are based on an entry around 4,025. If price gets rejected from resistance and closes a 4H candle below 4,000, I'd step back and watch how price reacts near 3,980 rather than trying to guess where the bottom is. What would change the setup? A 4H close below 3,980 would invalidate the recovery idea and mark a new low. There isn't another lower reference level visible on this chart view. There's also a bigger factor here: XAUT tracks gold, so technical levels aren't the whole story. Dollar movements, yields, and economic data releases can easily overpower a 4H setup. Gold-linked assets can move sharply on macro headlines, too. A stop placed just below a round number like 4,000 can get caught in a quick move, so position size needs to reflect that risk. My take: The bounce is a positive first step, but buyers still need to prove themselves around 4,020–4,027. Until price clears that zone with stronger volume, I'm treating this as a recovery attempt, not a confirmed trend change. No need to rush. I'll wait for the candle close and let price show its hand. #MyByXTake #ByXIMPACT #BybitStocks
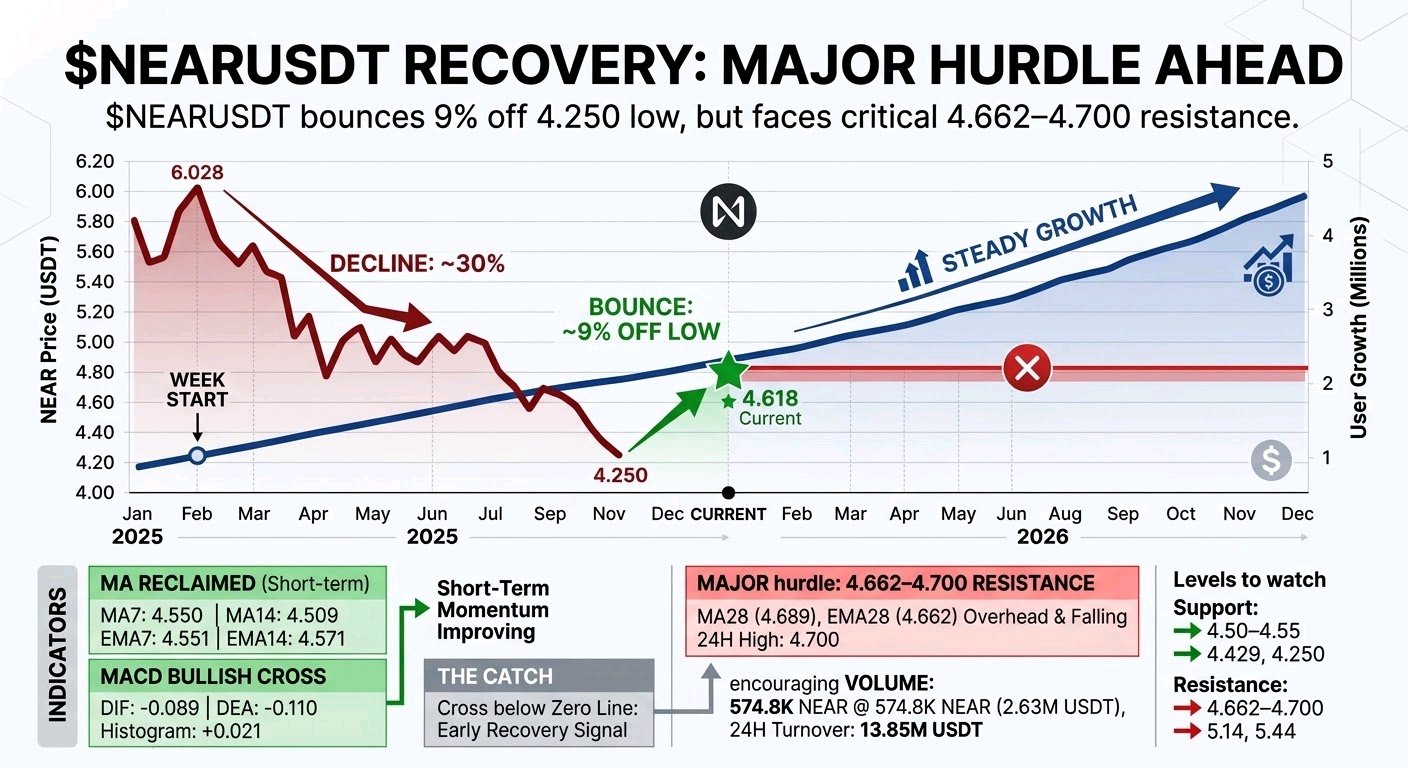
$NEARUSDT : Buyers are back, but can they break the resistance? NEAR dropped from 6.028 to 4.250, losing roughly 30% of its value before finding support. Since hitting that low, price has recovered around 9% and is now trading at 4.618, up 3.22% on the day. There are signs of a recovery, but I'm not ready to call it a trend reversal just yet. Here's what the chart is telling me. Price has climbed back above several short-term averages: - MA7: 4.550 - MA14: 4.509 - EMA7: 4.551 - EMA14: 4.571 MACD has also crossed bullish, with DIF at -0.089 above DEA at -0.110 and the histogram at +0.021. Buyers are clearly showing some interest. However, there's an important detail: the MACD crossover happened below the zero line. That's an early recovery signal, not confirmation that the broader downtrend has ended. The real challenge is overhead resistance. MA28 sits at 4.689 and EMA28 at 4.662. Both are still sloping downward, with the 24H high of 4.700 sitting just above them. In other words, NEAR has recovered, but price is now pressing directly into a resistance zone where sellers could step in again. Volume is supporting the bounce. The current 4H candle has traded 574.8K NEAR, worth approximately 2.63M USDT. That's around 1.3x the 5-period and 10-period average volumes of 425K and 447K, respectively. 24H turnover is 13.85M USDT, suggesting there's meaningful liquidity behind this move. That's a positive difference compared with weaker, low-volume pops that are more likely to fade. Still, the current 4H candle hasn't closed, so confirmation matters. Key levels I'm watching Support: - 4.50–4.55 — MA7, MA14 and EMA7 cluster - 4.429 — 24H low - 4.250 — recent swing low Resistance: - 4.662–4.700 — 28-period averages and 24H high - 5.14 — next upside target - 5.44 — last week's lower high Two possible setups 1. Breakout trade I'd want to see a 4H close above 4.70 with volume exceeding approximately 447K. After that, a retest of 4.66–4.70 that holds would provide stronger confirmation. - Stop-loss: Below 4.49 - Target 1: 5.14 - Target 2: 5.44 From an entry around 4.69, these targets offer approximately 2.2R and 3.7R, respectively. 2. Pullback trade The alternative is for price to revisit the 4.50–4.55 support zone and hold it on the 4H close. - Stop-loss: Below 4.42 - Target 1: 4.70 - Target 2: 5.14 With the tighter stop, a move to 5.14 offers around 5R, while 4.70 provides roughly 1.3R. The trade-off is straightforward: this setup allows an earlier entry, but you're buying before price has cleared the main resistance. When does the recovery start to fail? A 4H close below 4.429 would weaken the current bounce. If price falls below 4.250, the recent low is lost and the structure shifts lower. There's another risk worth keeping in mind: MACD bullish crosses below zero often fail during downtrends, and rebounds into falling 28-period moving averages regularly face selling pressure. My take: NEAR is showing encouraging recovery signals, backed by stronger volume, but the 4.66–4.70 zone is the real test. Until that ceiling breaks, this could still be a relief bounce within a broader downtrend. I'd watch the 4H close, wait for confirmation, and consider taking profits in stages rather than expecting one straight move higher. #MyByXTake #ByXIMPACT #BybitStocks
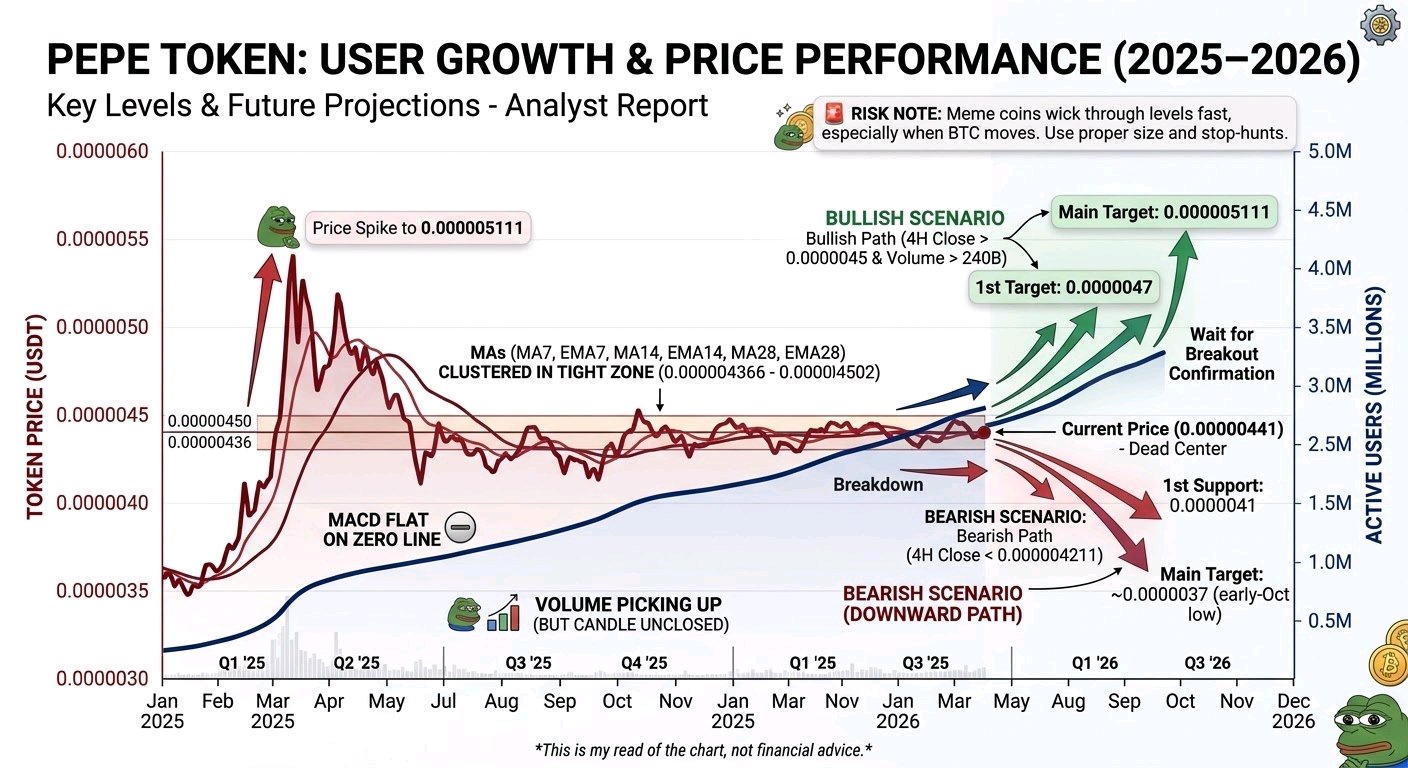
$PEPEUSDT : The next move could be getting closer. PEPE surged to 0.000005111 earlier this week, but most of those gains have faded. Since then, price has been moving sideways in a tight range, with neither buyers nor sellers taking full control. Now, things are getting interesting. Price is caught in a narrow zone MA7, EMA7, MA14, EMA14, and EMA28 are all clustered between 0.000004366 and 0.000004429. MA28 sits slightly higher at 0.000004502, while the current price of 0.000004414 is almost right on EMA14. When moving averages bunch together like this, the market is usually struggling to pick a direction. The next confirmed 4H candle close outside this range could provide a clearer signal. Volume is picking up, but there's a catch The current 4H candle is up 3.13%, with 369B PEPE traded and approximately 1.62M USDT in turnover. That's around 1.5 times the 5-period and 10-period average volume of roughly 239B. Buyers are showing some interest, but the candle hasn't closed yet. It's too early to call this a confirmed breakout. Meanwhile, 24H turnover stands at 6.13M USDT, which remains modest. Compared with the much heavier volume during the earlier spike, this recovery still lacks strong conviction. Key levels I'm watching Resistance: - 0.000004488 — 24H high - 0.000004502 — MA28 - 0.0000047 — previous post-spike shoulder - 0.000005111 — earlier spike high The 0.000004488–0.000004502 zone is the first hurdle bulls need to clear. Support: - 0.000004211 — 24H low - 0.0000041–0.00000414 — next support area Momentum isn't giving a clear answer MACD remains flat around the zero line, with DIF at -0.000000026 and DEA near zero. There's no strong momentum advantage for either side right now. Rather than trying to predict the next move, I'd prefer to wait for price to confirm it. What I'm watching for next Bullish scenario: A 4H close above 0.0000045 with volume exceeding approximately 240B would be the first signal. Ideally, price would then retest 0.000004488–0.0000045 and hold that zone. - Stop-loss: Below 0.000004211 - First target: 0.0000047 - Main target: 0.000005111 The first target offers only around 0.7R, so I'd treat it as a partial-profit level. The larger potential reward comes near 0.000005111, at roughly 2R. Bearish scenario: A 4H close below 0.000004211 could open the way toward 0.0000041, followed by the early-October low near 0.0000037. There's also a clear invalidation signal to watch. If price breaks above resistance but slips back below the 0.00000437–0.00000441 moving-average cluster, the breakout may have failed. A 4H close below 0.000004211 would invalidate the current compression setup. My take PEPE is sitting at a decision point. Volume is improving, but the market hasn't confirmed its direction yet. I'd rather wait for a clean breakout or breakdown than enter based on hope. The closing candle and the reaction around these key levels matter more than a temporary spike. Keep risk under control. Meme coins can produce sharp wicks when BTC moves, and the 4H structure can change quickly. Position sizing matters when the market gets unpredictable. Patience first. Confirmation second. Execution last. #MyByXTake #ByXIMPACT
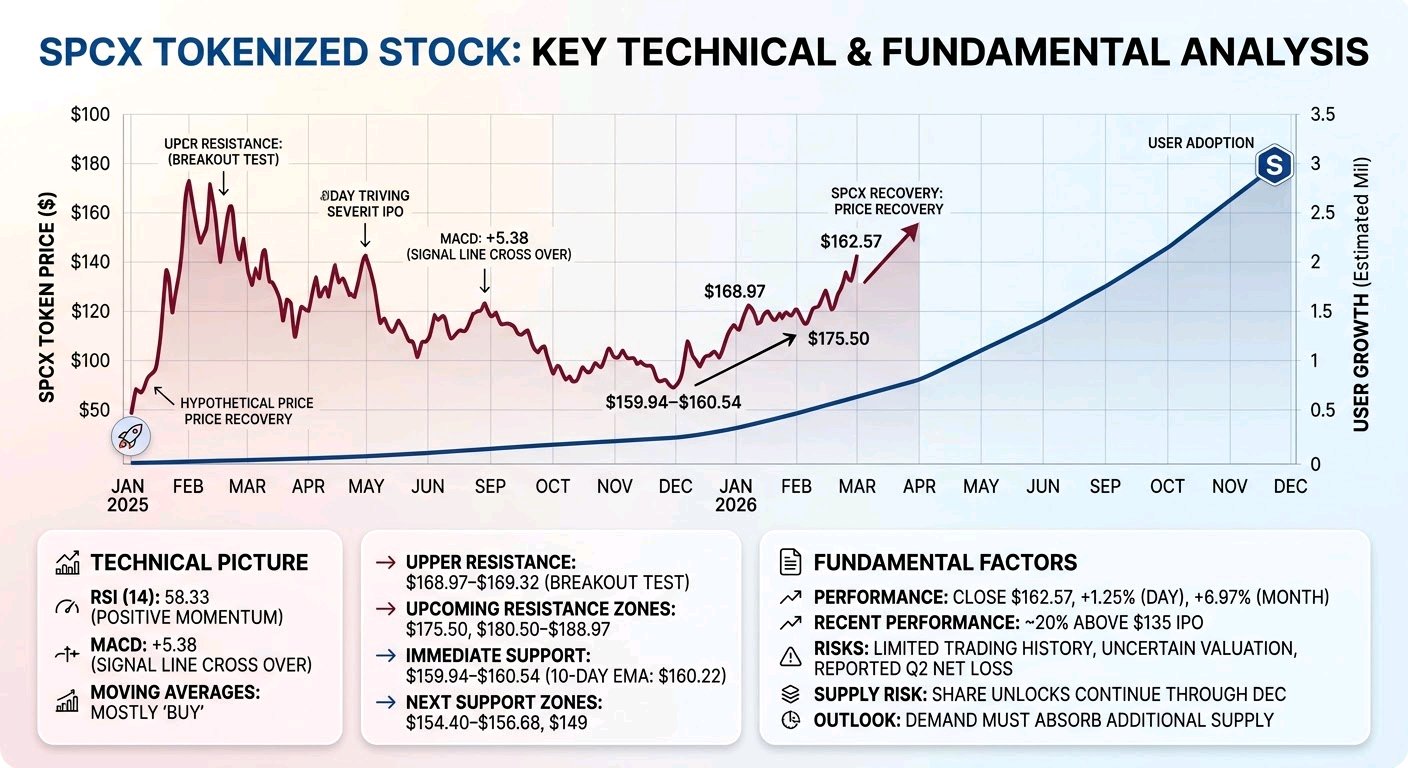
$SPCXXUSDT is back above $160. The next big test? $169. SpaceX tokenized stock ($SPCX) has been recovering, but whether the move can continue may come down to how it handles the next resistance zone. It closed at $162.57, up 1.25% for the day and 6.97% over the past month, according to the supplied data. That puts it roughly 20% above its $135 IPO price, though it’s still well below its post-listing high near $225.64. The technical picture is encouraging. RSI is at 58.33, pointing to positive momentum without being in overbought territory. MACD is positive at 5.38, and most available moving averages signal Buy. The 10-day EMA at $160.22 is a useful level to keep an eye on. Here are the key price zones: Resistance: $168.97–$169.32. A convincing break above this range could bring $175.50 into focus, with the $180.50–$188.97 zone next. Support: $159.94–$160.54. If SPCX slips below this area, the next levels to watch are $154.40–$156.68 and then $149. There’s also a supply risk to consider: share unlocks are expected to continue through December. Earlier unlocks reportedly came alongside resilient price action, but that doesn’t guarantee future demand will absorb the additional supply just as well. SPCX also has a limited trading history, an uncertain valuation and a reported Q2 net loss. Analyst targets are spread widely, so the average target on its own doesn’t say much about the potential downside. For now, $160 is the immediate support test and $169 is the breakout level. If neither gives way convincingly, consolidation remains a reasonable scenario. Can demand carry SPCX above $169, or will the growing supply weigh on its recovery? #ByXIMPACT #BybitStocks #BybitAIBestReplies
$LINKUSDT trade is up 6.94%—here’s what’s behind it I don’t buy a coin just because it’s trending. I want the chart, momentum, and fundamentals to give me a reason to consider the trade—and I keep an eye on what could change that view. My Chainlink position is showing +6.94% cumulative P&L, with an average cost of $12.106 and an index price of $12.947. On the weekly chart, $LINKUSDT bounced back from the $7 area and moved above $10.60, creating a stronger bullish structure. The moving averages turned upward, and MACD remained positive, with DIF at 0.906 above DEA at 0.356. RSI readings of around 54–59 showed buyers had momentum, without reaching extreme overbought levels. There’s a fundamental story behind the trade, too. Chainlink’s CCIP is taking on a bigger role in cross-chain infrastructure. CCIP 2.0 went live for institutions and digital asset issuers on September 28, and the network reported more than $84B in cumulative cross-chain token value. Still, I’m keeping the risks in view. $LINKUSDC recently ran into resistance around $15–$15.77, and a token release recorded on October 9 adds another supply factor to watch. If momentum weakens, the bullish setup needs another look. My takeaway: a good trade needs a reason to enter and a reason to reconsider. A positive P&L alone doesn’t mean the process was right. When you assess a trade, what do you focus on most: the chart setup, the fundamentals, or risk management? #ByXIMPACT #BybitStocks #BybitOdds
$GRASSUSDT is up 48%—here’s the trade I’m holding This is a real position for me, not just a chart idea. My average entry is 0.52, the index is at 0.771, and my cumulative P&L is +48.26%. Here’s what got me into the trade and what I’m watching from here. $GRASSUSDT is at 0.7720 on the 1D timeframe, down 5.76% after touching 0.8244. Over the past 24 hours, it has traded between 0.7344 and 0.8244, with turnover of 11.23M. Price reached 0.8905 before sellers took over. Even after the pullback, the underlying structure is still intact. Before entering, I was watching the moving averages: MA7 at 0.7086, MA14 at 0.7050, and MA28 at 0.5877. The EMAs are 0.7336, 0.6914, and 0.6052. Price is still above all of them. I entered at 0.52, below MA28 and EMA28, while price was building a base before the breakout. The signs I was looking for were there: higher lows above 0.35, a daily MACD beginning to turn, and growing traction around the AI data narrative. MACD is still positive, with DIF at 0.0809, DEA at 0.0796, and the histogram at 0.0012. RSI6 is 62.11, RSI12 is 63.41, and RSI24 is 63.92—no overbought signal so far. The Bollinger mid is 0.6721 and the upper band is 0.8503, with price above the mid. The project’s shift is what made me more confident in the position. Grass started as a bandwidth-sharing DePIN and is now positioning itself as the “read layer” for AI. On September 30, Multicoin Capital invested through both its hedge fund and venture arm, betting on inference-time retrieval as the next market. The Contents API went live around October 8–9. Grass says it achieved a 97% retrieval success rate across 100 tested sites. The project claims $17M in revenue for 2025, another $17M in H1 2026, and $75M in training-data revenue guidance for the full year. That guidance comes from Multicoin and the project itself; it hasn’t been independently audited. I’m still holding the trade, but I’m treating those figures with caution. Levels I’m watching 0.80–0.82: The first reclaim zone, which price lost on this pullback. 0.89: The swing high. A break and hold above it would change the structure. 0.70–0.71: The MA7/MA14 cluster and first support. 0.59–0.60: The MA28/EMA28 area. Below it, the trend behind my trade would be broken. Bullish scenario: Reclaim 0.80 and the path back to 0.89 opens up. If the AI data story keeps building, the 0.52 base could become the accumulation zone. Bearish scenario: If 0.70 fails and 0.59 goes, the setup is invalidated. The unaudited revenue figures remain the main risk to the narrative. Would you hold through a pullback to 0.70, or take profit if price reclaims 0.80? #ByXIMPACT #BybitStocks
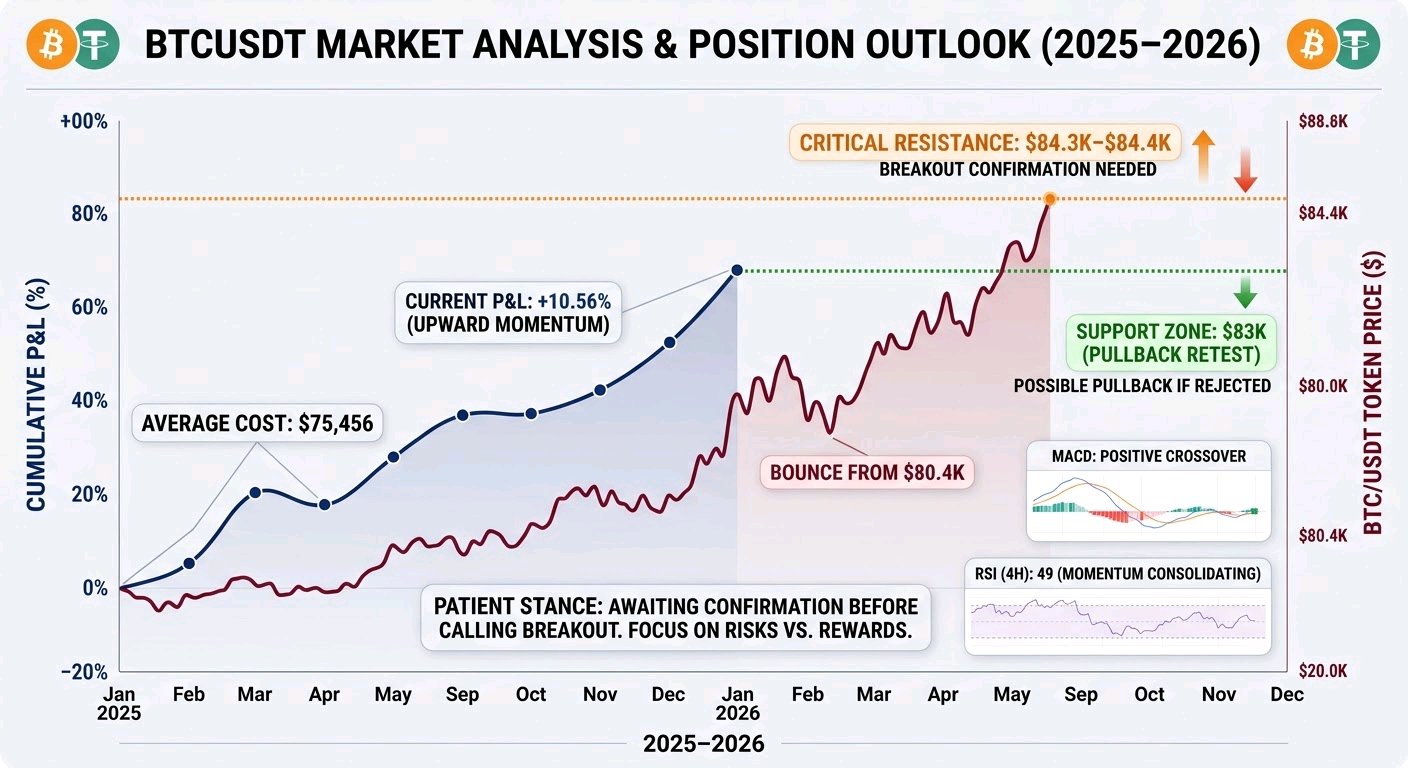
$BTCUSDT is giving my position room to breathe, but I’m not ready to call this a breakout yet. My average cost is $75,456, with cumulative P&L up 10.56%. On the 4H chart, BTC has bounced from the $80.4K area and climbed back above the short-term moving averages. MACD has turned positive, but RSI is around 49—so momentum still needs to show it can hold. I’m watching $84.3K–$84.4K closely. A clean break and hold could lead to another move up. If price gets rejected, we could see a pullback toward $83K and a possible retest of support. For now, I’m staying patient and letting price confirm the move. There’s no need to chase green candles when protecting a solid position matters just as much as finding the right entry. What do you see here: a breakout continuing, or another rejection at resistance? #BybitStocks #BybitOdds
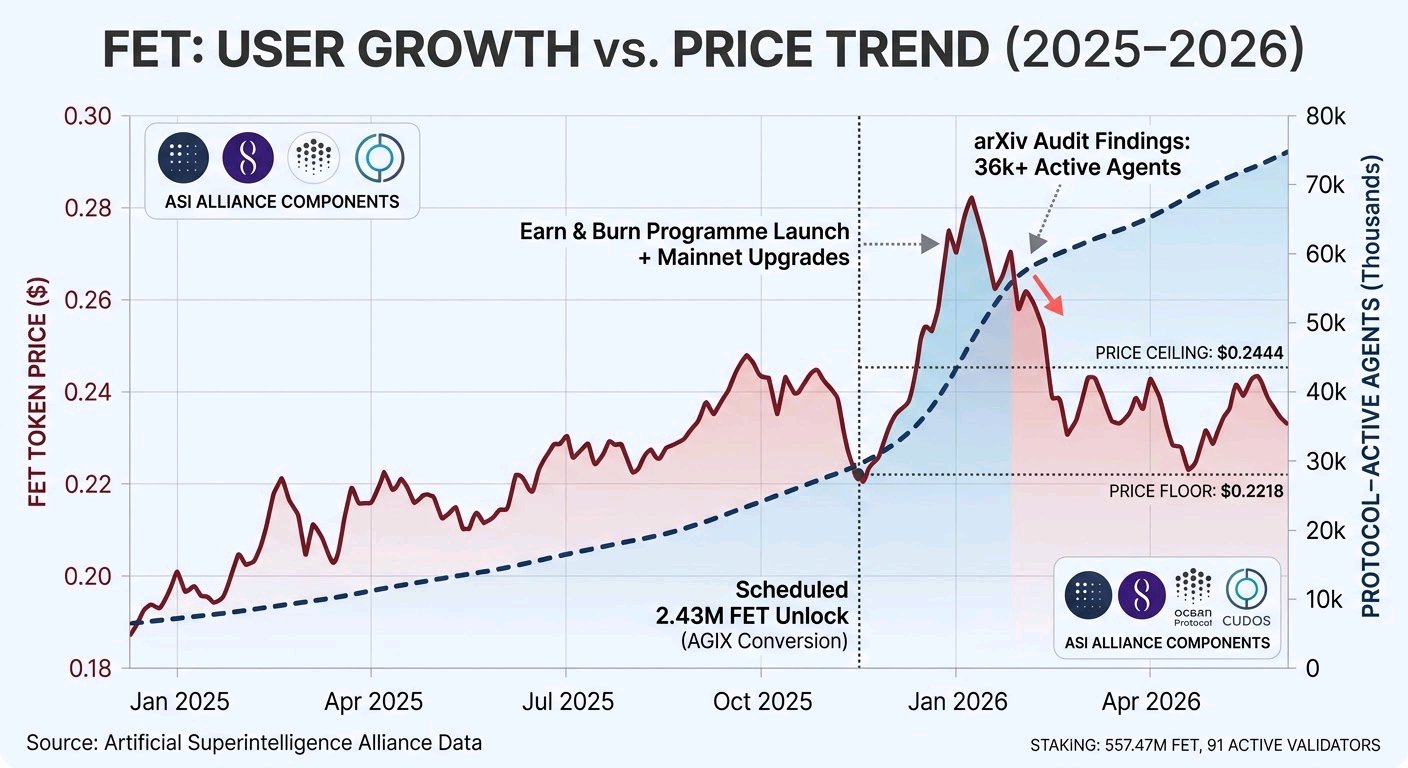
$FETUSDT is back above 0.23, but 0.2444 is the level to watch $FETUSDT is moving up again, and the green candle is only part of the story. FET is trading at 0.2339, up 4.51% today. Its 24-hour range is 0.2218–0.2444, with 3.41M in turnover on the Bybit pair. On the 4-hour chart, the structure is starting to turn. MA7 sits at 0.2354, MA14 at 0.2299 and MA28 at 0.2255. Price is hovering around MA7 and holding above MA14 and MA28. That’s not a confirmed trend, but the setup hasn’t broken down either. The EMAs show a similar picture: EMA7 is 0.2341, EMA14 is 0.2310 and EMA28 is 0.2295, with the short-term average above the longer-term ones. FET is also trading above the Bollinger midline at 0.2262. The upper band is 0.2426 and the lower band is 0.2098. MACD has just crossed bullish, with DIF at 0.0021, DEA at 0.0001 and a positive histogram reading of 0.0019. RSI6 is 55.81, RSI12 is 55.63 and RSI24 is 52.42—all neutral, with no overbought pressure. WR14 is -36.97 and WR20 is -31.25, so momentum has room to run before it becomes a concern. There’s a bigger story behind FET, too. It’s the unified token of the Artificial Superintelligence Alliance, formed through the 2024 merger of Fetch.ai, SingularityNET and Ocean Protocol, with CUDOS joining later. Combined supply is capped at roughly 2.7 billion tokens. In 2025, the network processed over 34 million transactions, while 557.47 million FET was staked across 91 active validators and around 25,000 delegators. The Earn & Burn programme adds a deflationary element. Launched in January 2026, it directs roughly 25% of ecosystem revenue to open-market buybacks and permanent burns. Its first burn was about 5 million FET on January 10, 2026. Over 90 days, buyback-and-burn volume slightly exceeded unlock emissions, making the token net deflationary on that measure. There’s a concern to keep in mind: an independent arXiv audit in early 2026 found only 36,000+ protocol-active agents in the Almanac, a significant gap from the 2.7 to 3 million agents Fetch.ai has touted. The audit also identified 62 missing capabilities across agent memory, observability and security—factors that matter for long-term value capture. A 2.43 million FET unlock is scheduled for October 28, 2026, as part of the ongoing AGIX-to-FET conversion. It represents about 0.09% of total supply. That’s small, but it’s on the calendar. Levels I’m watching: 0.2444 (24-hour high) and 0.2426 (Bollinger upper band): The immediate ceiling. A 4-hour close above this area could open the door. 0.2354 (MA7) and 0.2341 (EMA7): First support if the pullback deepens. 0.2299 (MA14) and 0.2262 (Bollinger midline): The reclaim zone that matters. 0.2218 (24-hour low) and 0.2255 (MA28): The line in the sand. Below this, the bounce structure breaks. Bullish case: If FET gets back above 0.2444 and holds on a retest, the MACD cross and neutral RSI leave room for a push toward 0.265–0.270, where price was rejected earlier. The Earn & Burn mechanism and staking demand provide a fundamental floor. Bearish case: RSI is neutral, not oversold, so there’s no forced-bounce signal. If price loses 0.2299 and then 0.2255, the 4-hour structure turns bearish again. The agent-count discrepancy and October 28 unlock could weigh on upside if volume doesn’t show up. #BybitOdds #BybitStocks #BybitAIBestReplies
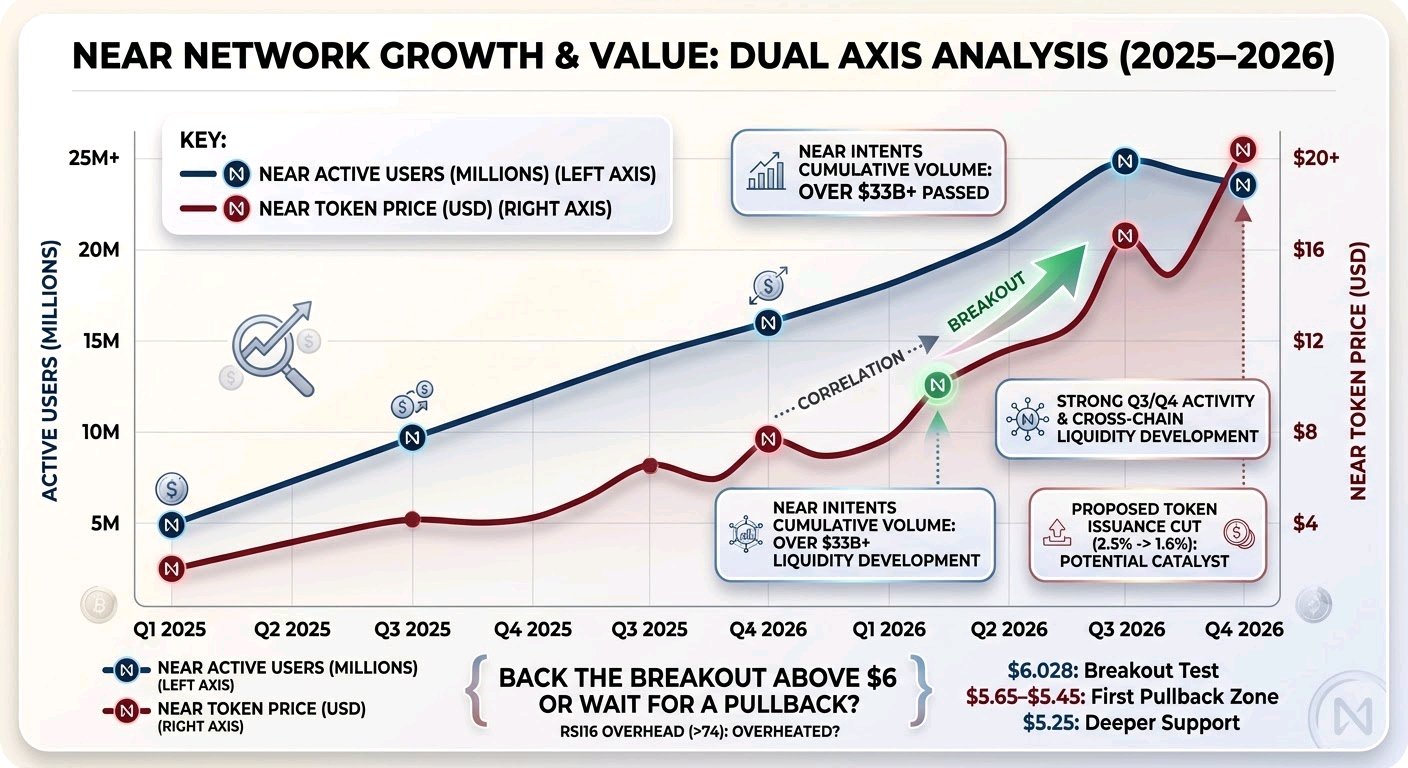
$NEARUSDT is up more than 11% — now comes the real test $NEARUSDT is trading around $5.84 after reaching $6.028. The rally looks strong, but the next move matters more than the green candle. On the 4-hour chart, NEAR is holding above MA7 ($5.654), MA14 ($5.446) and MA28 ($5.186), with MACD still positive. That keeps the trend in buyers’ favour. But RSI16 is at 74.07, a sign the short-term move may be overheated. Here are the levels to keep an eye on: $6.028: The next breakout test $5.65–$5.45: First pullback zone $5.25: Bollinger midline and deeper support There’s more to the NEAR story than the chart. NEAR Intents has passed $33B in cumulative volume, and recent reports point to strong September activity. The network is also developing its position in cross-chain liquidity and AI-agent infrastructure. A proposal to cut maximum annual token issuance from 2.5% to 1.6% over two years could be another catalyst if adopted. Still, fast rallies can turn just as quickly. If NEAR is rejected near $6 and loses short-term support, the chart could shift quickly. Would you back a breakout above $6, or wait for a pullback to see whether support holds? #BybitAIBestReplies #BybitOdds #BybitStocks
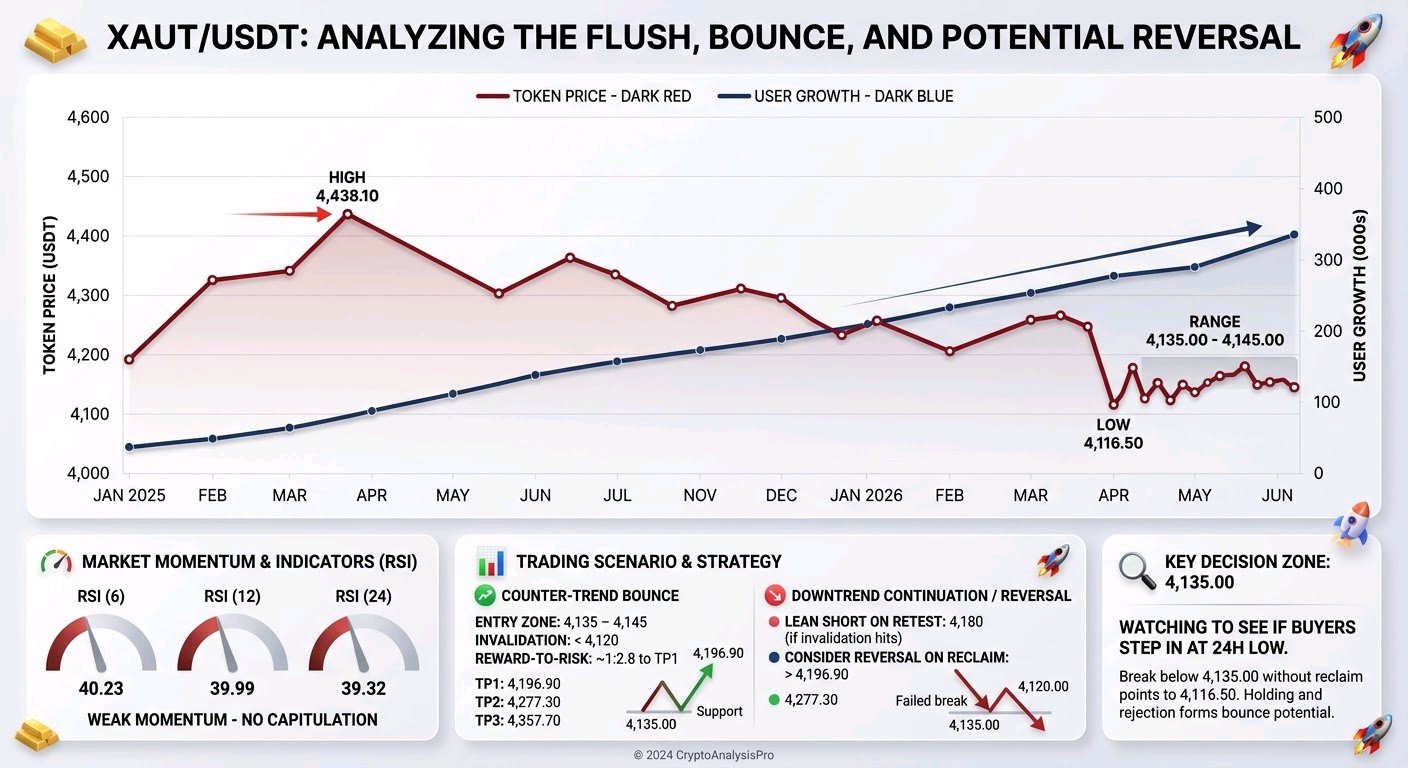
$XAUTUSDT is still hovering near the lows after dropping sharply to 4,116.50. Price is now moving in a tight range around 4,140.40, and I’m watching to see if buyers step in. The daily move is +0.00%, but the bigger picture is still weak. Since peaking at 4,438.10, price has kept making lower highs and lower lows. The latest sell-off pushed it to the 24-hour low of 4,135.00, followed by a small bounce that has stalled around 4,140.40. The 24-hour range is just about 7.30 points wide, so volatility has tightened sharply after the drop. RSI readings are 40.23 on the 6-period, 39.99 on the 12, and 39.32 on the 24. Momentum is weak across all three, though it hasn’t reached capitulation levels. That’s why I’m cautious about both sides here: shorting means chasing an extended drop into support, while buying means going against a downtrend that hasn’t printed a higher low. For now, I see a possible breakdown in progress, but neither side offers a great entry. The level I’m focused on is 4,135.00, the 24-hour low. If price breaks below it and fails to reclaim it, 4,116.50 comes into view. If it holds and forms a rejection wick, a short-term bounce toward 4,196.90 is possible. For a long, my entry zone is 4,135–4,145, with invalidation at 4,120. Targets are 4,196.90, 4,277.30, and 4,357.70 if momentum carries. From the 4,140 midpoint, a 20-point risk for a move to 4,196.90 gives roughly 1:2.8 to TP1. That’s the reward potential that makes this counter-trend trade worth considering. The stop is tight because below 4,120, the flush extends and there’s no reason to stay long. I’d reconsider if price reclaims 4,196.90 and holds above it; that would look like a genuine reversal, with 4,277.30 as the next continuation target. If 4,120 gives way and price can’t reclaim it, the downtrend remains in control, and I’d lean short on a retest of 4,180. Would you buy this flush for a bounce, or wait for a reclaim before committing? #ByXIMPACT #BybitOdds
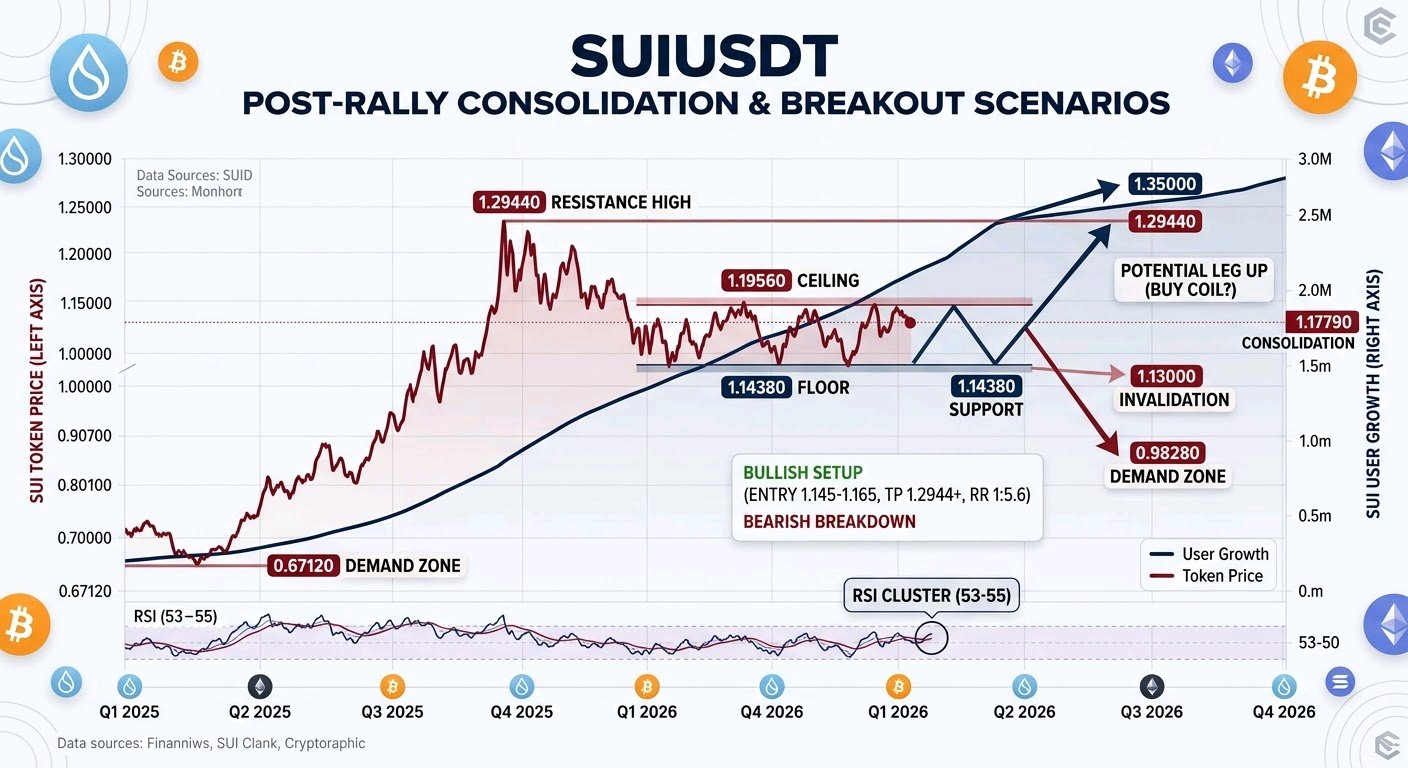
$SUIUSDT is taking a breather below 1.29440. It’s now consolidating around 1.17790, and I’m watching to see whether buyers can turn this pause into another move higher. Today’s change is +0.49%, but the price structure is what matters more to me. SUI rallied from 0.67120 to 1.29440, then met steady rejection near the high. Since then, it has been moving sideways between roughly 1.14380 and 1.19560, with smaller candles and no clear direction. After a strong rally, a tight range like this can set up an expansion. RSI is at 54.94 on the 6-period, 52.93 on the 12, and 53.79 on the 24. All three readings are clustered around 53–55. Momentum has cooled off after the rally, but it hasn’t broken down. To me, that looks like the market is digesting the move rather than distributing it. This looks like a post-rally coil below the highs, so I’m focused on the range edges. The 24-hour high at 1.19560 is the nearest ceiling, while 1.14380 is the floor. If price dips toward that floor, holds, and prints a rejection wick, a move back toward 1.29440 could become attractive. At 1.17790, though, price is in the middle of the range, where I don’t see a clear edge. A 4H close below 1.14380 would tell me the impulse has stalled and could bring the 0.98280 demand zone back into focus. For a long, I’m watching an entry between 1.14500 and 1.16500, with invalidation at 1.13000. The targets are 1.19560, 1.29440, and 1.35000 if momentum carries. From the 1.15500 midpoint, risking 2.5 points for a move to 1.19560 gives roughly 1:1.6 to TP1, which is thin. The better target to measure against is 1.29440, where the ratio is roughly 1:5.6—that’s what makes the setup worthwhile. A 4H close above 1.19560 would change my view. It would break the range bullish, and I’d look for an entry on a higher retest. If price loses 1.13000 and can’t reclaim it, the structure turns bearish, with the 0.98280 demand zone as the target. Would you buy this coil for the next leg up, or wait for a deeper flush into the 1.15 area? #ByXIMPACT #BybitOdds
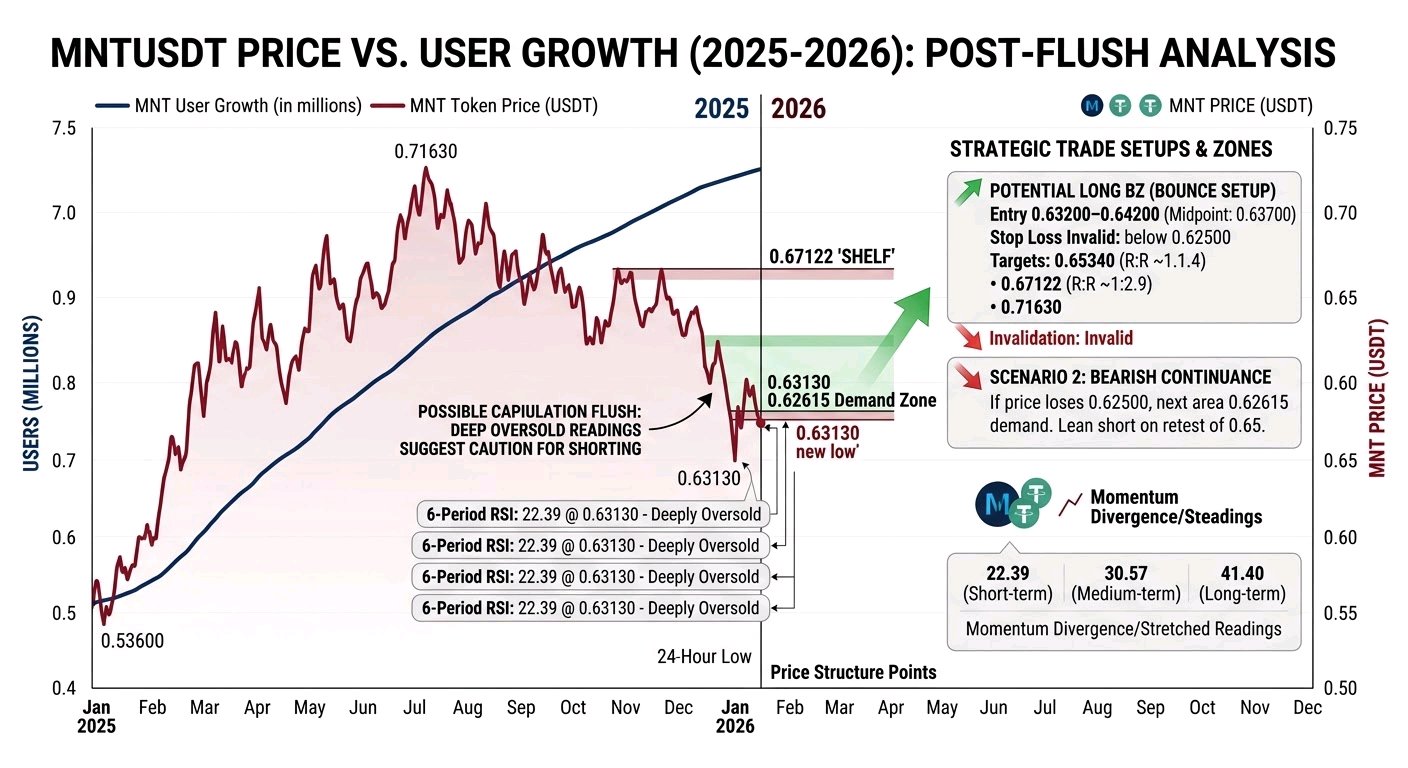
$MNTUSDT just dropped to a new low of 0.63130. With the 6-period RSI at 22.39, I’m hesitant to chase the breakdown with a short. The move is down 1.45%, but the bigger concern is the price structure. MNT climbed from 0.53600 to 0.71630, then faced steady rejection from the top. It has since slipped below the 0.67122 shelf and is now at 0.64240. The 24-hour low at 0.63130 is the closest support. RSI is 22.39 on the 6-period, 30.57 on the 12-period, and 41.40 on the 24-period. The short-term readings are stretched: the 6-period RSI is deeply oversold, and the 12-period reading confirms momentum is weak across multiple timeframes. Price could still fall, but shorting here feels like chasing a move that may have already spent much of its energy. I’ve seen traders sell right at the bottom of a flush, only to get caught in a sharp snapback. To me, this looks like a capitulation-style flush, so the short entry doesn’t look appealing. I’m watching 0.63130 closely. If price breaks below that level and can’t reclaim it, the next area in focus is the 0.62615 demand zone. If it holds and prints a rejection wick, a bounce toward 0.67122 could follow. For a long setup, I’m watching 0.63200–0.64200, with invalidation at 0.62500. The targets are 0.65340, 0.67122, and 0.71630 if momentum continues. Using the 0.63700 midpoint, risking 1.2 points for the first target at 0.65340 gives roughly 1:1.4, which is thin. The more meaningful target is 0.67122, where the ratio is roughly 1:2.9—that’s what makes the trade worthwhile. The stop is tight because below 0.62500, the flush extends and there’s no reason to stay long. My view would change if price reclaims 0.67122 and holds above it. That would look like a genuine reversal, with room to continue toward 0.71630. If it loses 0.62500 and can’t reclaim it, the downtrend remains in control, and I’d lean short on a retest of 0.65. Would you buy this flush for a bounce, or wait for price to reclaim a level before getting involved? #ByXIMPACT #BybitOdds
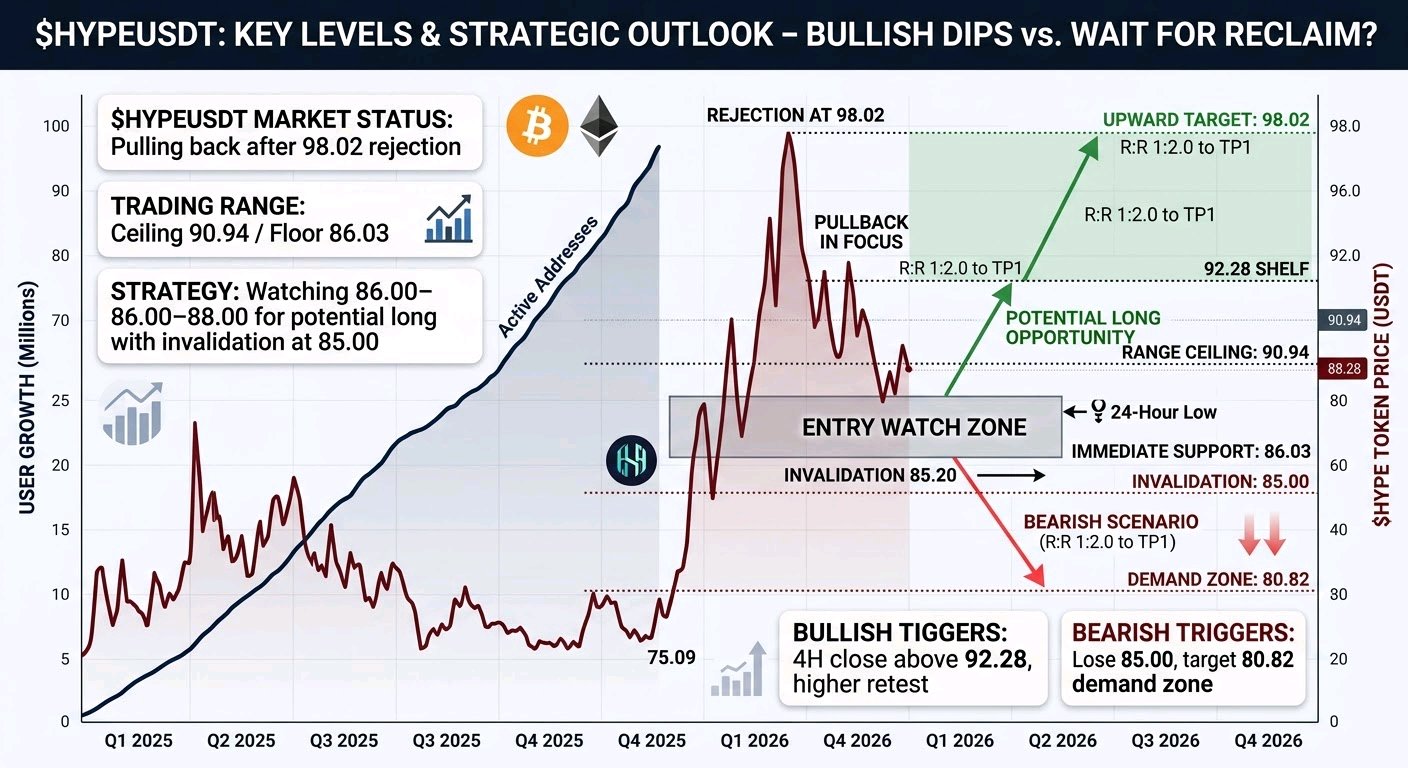
$HYPEUSDT is pulling back after the rejection at 98.02. Price is around 88.28, and the dip is bringing buyers’ response into focus. HYPE is down 2.62% today. It rallied from 75.09 to 98.02, then began giving back ground, falling through the 92.28 shelf. The 24-hour low at 86.03 is the nearest support. RSI readings are 48.37 on the 6-period, 48.65 on the 12, and 48.27 on the 24. With all three RSI readings between 48 and 49, momentum is neutral. The earlier impulse has reset, and the market hasn’t picked a clear direction. This is a spot for patience. The range gives me the levels to watch: 90.94 is the immediate ceiling, and 86.03 is the floor. If price tests the lower end and holds with a rejection wick, a short-term long toward the range high could be interesting. A strong rejection at 90.94 would shift my bias the other way, and I’d look for a move back toward the lows. For a long, I’m watching 86.00–88.00 for entry, with invalidation at 85.00. Targets are 90.94, 92.28, and 98.02 if momentum carries. From the 87.00 midpoint, the 2-point risk gives roughly 1:2.0 to TP1, which is acceptable. The more compelling target is 92.28, where the risk-to-reward is roughly 1:2.6. A 4H close above 92.28 would break the range to the upside, and I’d look for an entry on a higher retest. If price loses 85.00 and can’t reclaim it, I’d consider the structure bearish and target the 80.82 demand zone. Would you buy this pullback, or wait for a reclaim of 91 before committing? #BybitOdds #ByXIMPACT
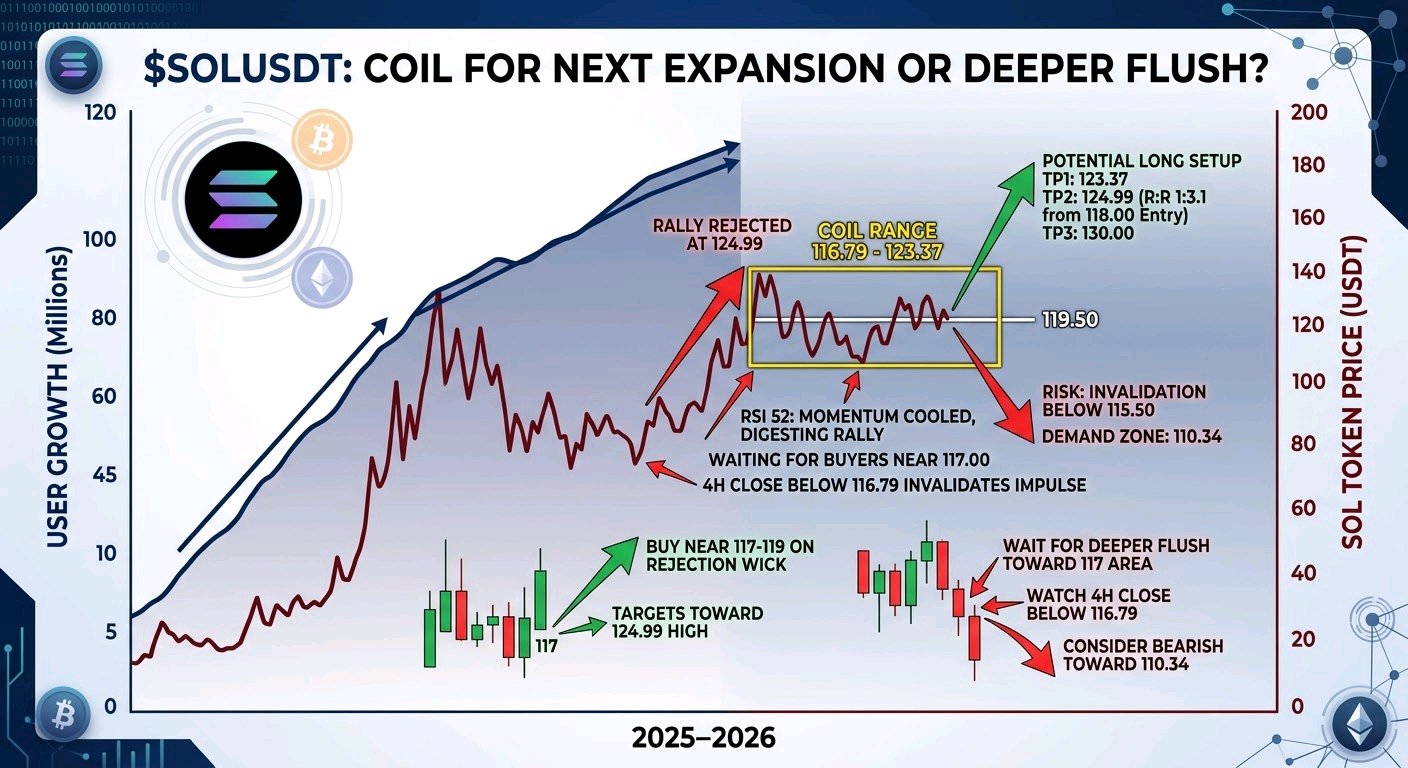
$SOLUSDT is moving sideways around 119.50 after being rejected from 124.99. It’s down 1.98% today, and this tight range is where I’m watching for buyers to show their hand. SOL climbed from 95.69 to 124.99, then started pulling back. Since that peak, price has stayed between roughly 116.79 and 123.37, with smaller candles and no clear direction. After a strong rally, a tight coil like this can set the stage for another expansion. The RSI readings are 52.63 on the 6-period, 51.58 on the 12, and 52.13 on the 24. They’re all sitting near 52, which suggests momentum has cooled without the structure breaking down. For now, it looks like the market is digesting the rally rather than distributing. The range edges are the levels to watch: 123.37 is the immediate ceiling, while 116.79 is the floor. If price dips toward 116.79 and holds with a rejection wick, a move back toward the 124.99 high could become an appealing long setup. At 119.50, price is still in the middle of the range, where the trade has no clear edge. A 4H close below 116.79 would suggest the impulse has stalled and could bring the 110.34 demand zone into play. For a long, I’m watching an entry between 117.00 and 119.00, with invalidation at 115.50. Targets are 123.37, 124.99, and 130.00 if momentum continues. From the 118.00 midpoint, the stated risk is 2.25 points, giving roughly 1:2.4 to TP1. The more useful target to measure against is 124.99, which offers roughly 1:3.1 and makes the trade worthwhile. A 4H close above 124.99 would break the range bullish, and I’d look for an entry higher on a retest. If price falls below 115.50 and can’t reclaim it, I’d consider the structure bearish and look toward the 110.34 demand zone. Would you buy this coil for the next move up, or wait for a deeper flush into the 117 area? #BybitOdds #ByXIMPACT
$SPCXXUSDT has jumped 6.27% from the 142.56 low and is now near the 159.88 24-hour high. The move is strong, but with the 6-period RSI at 84.41, I’m not looking to chase it here. Price built a base near 142.56, started making higher lows, then pushed through 146.89 and 151.22. It’s now holding near the top of that run, so buyers still appear to be in control. At 158.97, RSI stands at 84.41 on the 6-period, 77.67 on the 12, and 69.27 on the 24. All three readings are elevated, and the 6-period is deep in overbought territory. Momentum is bullish, but entering at this level means buying after a sharp expansion. A stop below 151 would be needed to give the trade room for normal volatility. I see a bullish setup, but the entry here isn’t appealing. The 24-hour low at 149.14 is the structural level I’m watching. If price pulls back, holds above 152–154, and shows a rejection wick, a continuation long toward 159.88 could become attractive. With RSI6 at 84, buying now also risks getting shaken out by the first red candle. A 4H close below 151.22 would tell me the impulse has stalled and could bring the 146.89 demand zone back into view. For a long, I’m watching an entry between 152.00 and 155.00, with invalidation at 150.00. Targets are 159.88, 165.00, and 172.00 if momentum carries. From the 153.50 midpoint, the 2.5-point risk works out to roughly 1:2.6 at TP1, which is the risk-to-reward that makes the setup worthwhile. If price falls below 150.00 and can’t reclaim it quickly, I’d drop the long idea. That would signal a failed breakout and put sellers back in control. I’d also stay on the sidelines if price keeps chopping between 157 and 160 without a clear trigger. Are you buying this breakout candle, or waiting for a retest like I am? #BybitOdds #ByXIMPACT
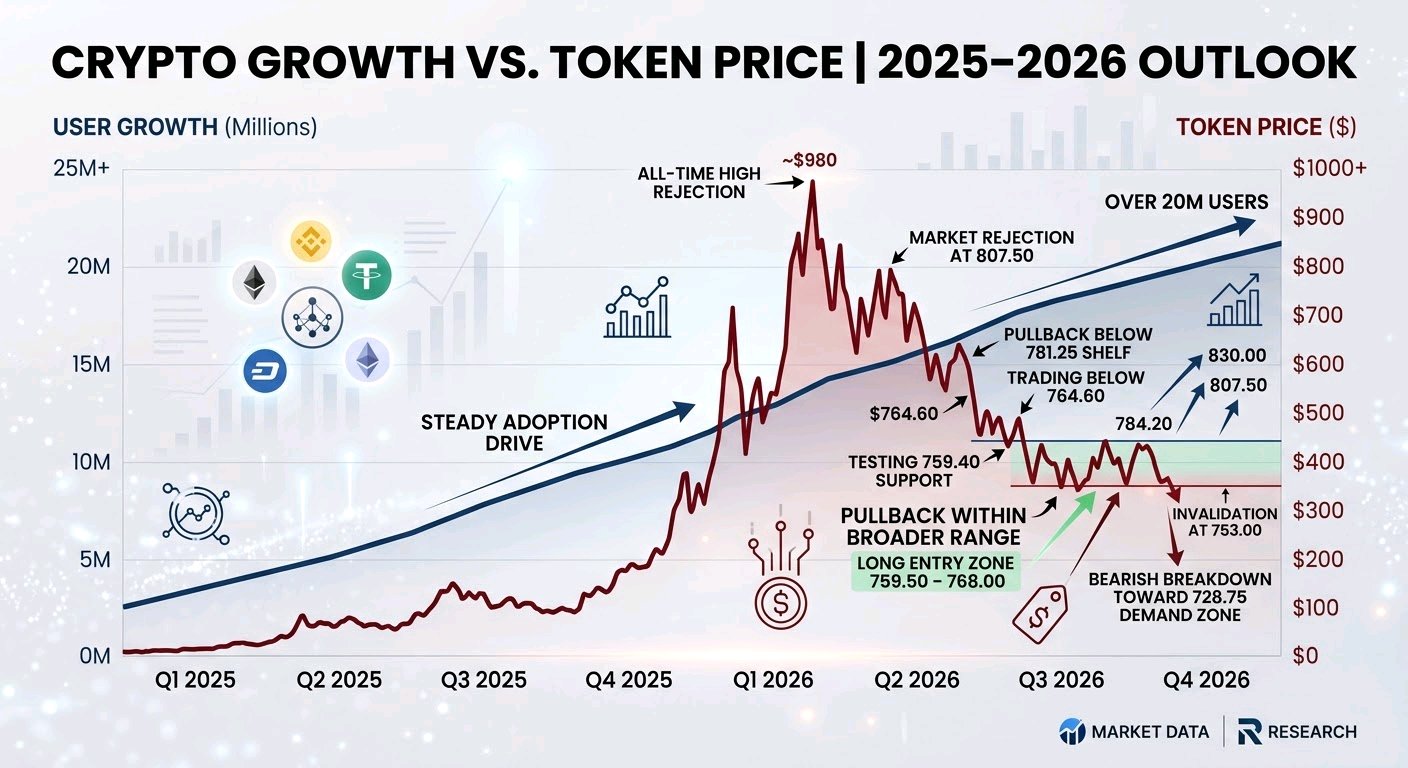
$BNBUSDT is still pulling back after being rejected at 807.50. Price is now at 764.60, and I’m watching closely to see if buyers show up around here. BNB is down 1.84% today. After climbing from 702.50 to 807.50, it has steadily given back ground, slipping below the 781.25 shelf. The 24-hour low at 759.40 is the nearest support. RSI is 36.42 on the 6-period, 44.92 on the 12, and 48.01 on the 24. That points to short-term weakness, while the higher timeframes are moving closer to neutral. The short-term picture is why I’m being careful. Sellers have the momentum, but RSI6 in the mid-30s hasn’t reached the kind of extreme that often signals exhaustion. Shorting here could mean chasing the move into support; buying now would mean entering before price has shown a reversal. For now, this looks like a pullback within a broader range. The current entry is possible, though not ideal. I’m keeping an eye on 759.40: if price holds above that level and forms a rejection wick, a move back toward 807.50 could set up. A 4H close below 759.40 would suggest the pullback is continuing, with the 728.75 demand zone back in view. For a long setup, my entry zone is 759.50–768.00, with invalidation at 753.00. My targets are 784.20, 807.50, and 830.00 if momentum carries. From the 763.75 midpoint, the 8.25-point risk gives roughly a 1:2.5 risk-to-reward ratio at TP1. Below 753.00, the pullback would become a breakdown, which is why that’s my structural stop. A reclaim and hold above 784.20 would change the picture for me. I’d consider that a genuine reversal and look for continuation toward 807.50. If price loses 753.00 and can’t reclaim it, I’d see the structure as bearish and look toward 728.75. Would you buy this pullback, or wait for price to reclaim 784 before committing? #BybitOdds #ByXIMPACT
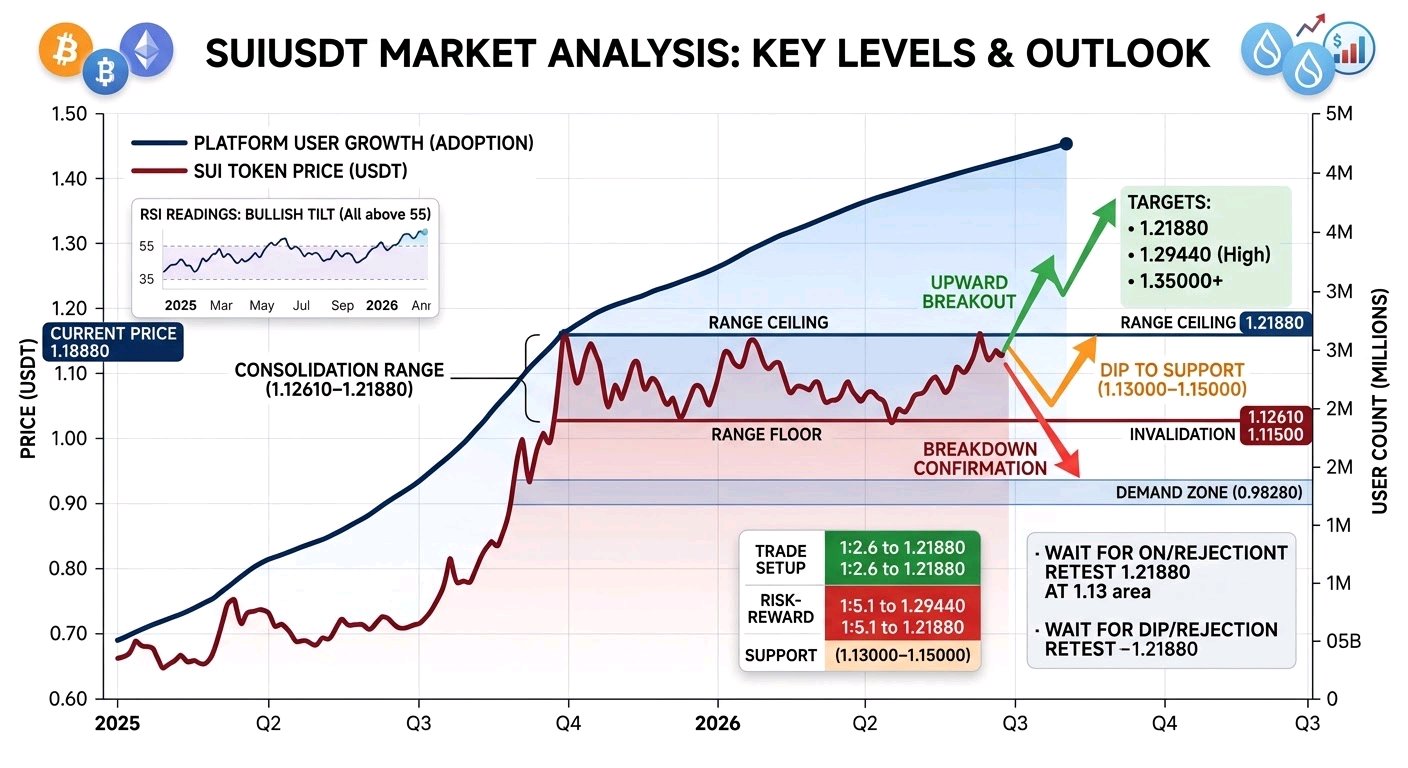
$SUIUSDT is holding around 1.18880, just below the 1.29440 high. After that strong rally, price has settled into a tight range, and I’m watching to see which side makes the next move. The daily gain is +1.58%, but the bigger picture is more interesting. SUIUSDT climbed from 0.67120 to 1.29440, then started drifting sideways between roughly 1.12610 and 1.21880. The candles have become smaller, and there’s no clear direction yet. After a strong move like that, a tight coil can be a sign that price is preparing to expand. The RSI readings are leaning bullish: 58.96 on the 6-period, 55.05 on the 12, and 55.74 on the 24. All three are above 55, with the short-term reading slightly ahead of the higher timeframes. Momentum seems to be tilting toward buyers, but price isn’t overbought or extended. At this stage, a breakout looks more likely than a breakdown. I’m treating this as consolidation after the rally, with the range edges as the levels to watch. The 24-hour high at 1.21880 is the near-term ceiling, while 1.12610 is the floor. A dip toward the lower end followed by a rejection wick would make a continuation move toward 1.29440 more appealing. At 1.18880, though, price is in the middle of the range, so I don’t see a clear entry. A 4H close below 1.12610 would tell me the rally has stalled and could bring the 0.98280 demand zone back into view. For a long, I’m watching 1.13000–1.15000 for entry, with invalidation at 1.11500. Targets are 1.21880, 1.29440, and 1.35000 if momentum carries. From the 1.14000 midpoint, risking 3 points to target 1.21880 gives roughly 1:2.6 to TP1. The 1.29440 target gives roughly 1:5.1, which is the risk-to-reward that makes the trade worthwhile. A 4H close above 1.21880 would break the range to the upside. I’d then look for an entry on a higher retest. If price drops below 1.11500 and can’t reclaim it, the structure turns bearish, and I’d look toward the 0.98280 demand zone. Are you buying this consolidation for another move up, or waiting for a deeper dip into the 1.13 area? #ByXIMPACT #BybitAIBestReplies #BybitOdds #ByPickMakeYourPickCount