OGAnalysis
Tesla’s chart is showing a contradiction that traders should not ignore: price has recovered sharply, but the market has not yet proved that the recovery can turn into a sustained breakout. On October 27, TSLA closed at $391.62, while its pre-market price reached $395.42, up approximately 0.97%. The daily chart shows a rebound from the lower $300s toward the $395–$402 area, with the stock trading above its 7-day, 14-day, and 28-day moving averages at $379.60, $373.03, and $371.85, respectively. That alignment suggests improving short-term momentum. But there is a critical distinction between recovering lost ground and establishing a durable uptrend. The $397–$402 zone is the immediate test. A convincing move above this area could strengthen the recovery narrative, while rejection could expose the rally as another attempt to overcome overhead selling pressure. The earlier chart high near $438.14 also shows how much resistance may remain above the current price. The underlying issue is market structure. When price rises above short-term averages, momentum traders may interpret it as confirmation. Yet moving averages react to past prices; they do not guarantee that new buyers will keep absorbing supply. Tesla’s next move depends less on how strong the rebound looks and more on whether buyers can defend reclaimed levels after a breakout attempt. Will TSLA turn this recovery into a higher-high structure, or is the market approaching another resistance-driven reversal? $TSLAXUSDT #ByXIMPACT

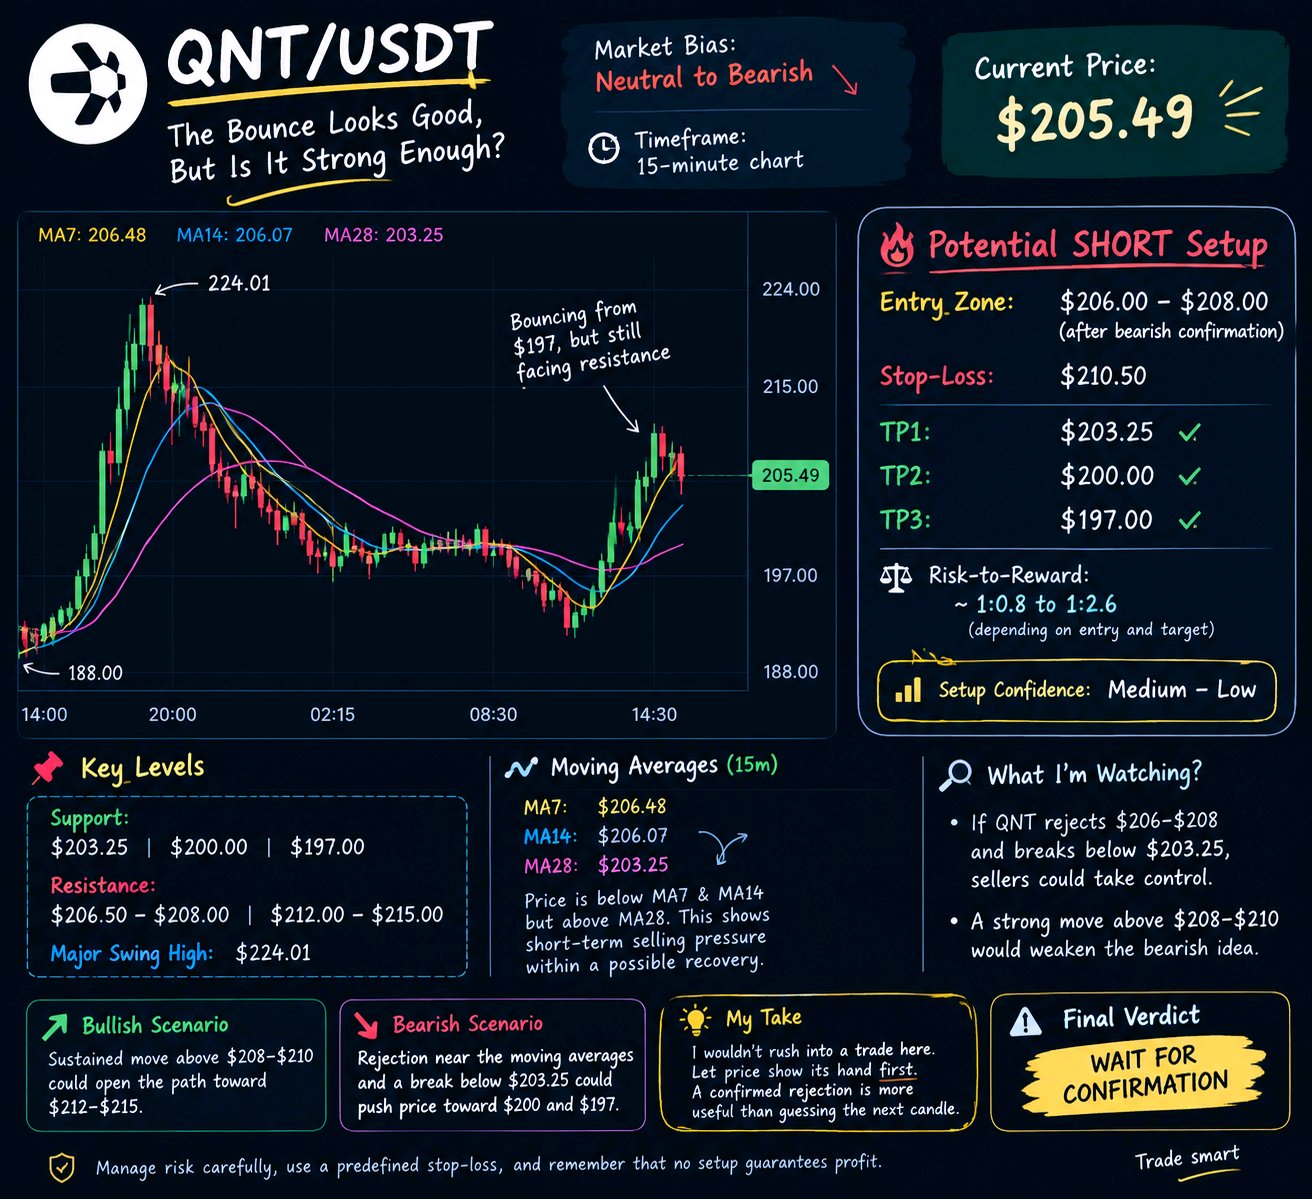
🔥 QNT/USDT: The Bounce Looks Good, But Is It Strong Enough? 📊 Market Bias: Neutral to Bearish 💰 Current Price: $205.49 ⏱️ Timeframe: 15-minute chart QNT has bounced from around $197, but buyers still have something to prove. The bigger picture shows a drop from $224.01, followed by lower highs. The latest recovery is encouraging, but it’s too early to call it a full trend reversal. 📉 Potential SHORT Setup 🎯 Entry: $206.00–$208.00 after bearish confirmation 🛑 Stop-Loss: $210.50 ✅ TP1: $203.25 🎯 TP2: $200.00 🚀 TP3: $197.00 📍 Key Levels - Support: $203.25, $200, $197 - Resistance: $206.50–$208, then $212–$215 🔎 What am I watching? MA7 is at $206.48, MA14 at $206.07, and MA28 at $203.25. Price is struggling around the short-term moving averages, making the $206–$208 zone important. If QNT rejects this area and breaks below $203.25, sellers could regain control. On the other hand, a strong move above $208–$210 would weaken the bearish idea. 🧠 My Take: I wouldn’t rush into a trade here. Let price show its hand first. A confirmed rejection is more useful than guessing the next candle. ⚠️ Manage risk carefully, use a predefined stop-loss, and remember that no setup guarantees profit. Final Verdict: WAIT FOR CONFIRMATION. $QNTUSDT #ByXIMPACT
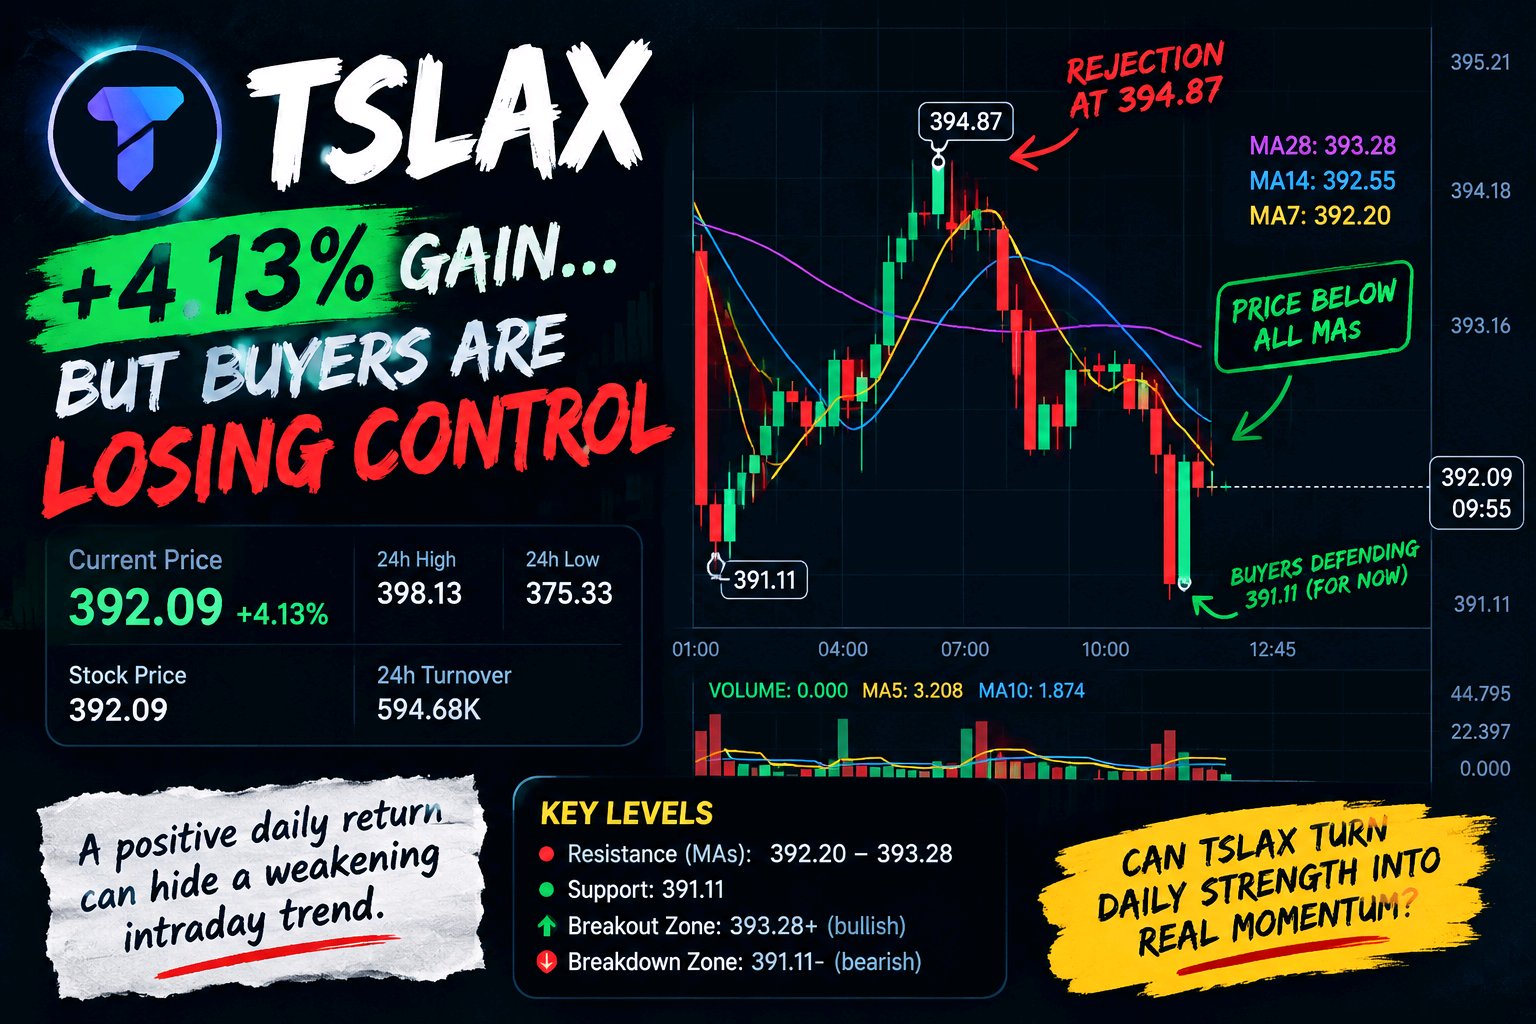
TSLAX Is Up 4.13% — But Buyers Are Losing Control TSLAX is showing a contradiction that matters more than its daily gain: the token is up 4.13%, yet its 15-minute chart is struggling to recover after a sharp rejection near 394.87. The screenshot shows a current price of 392.09, a 24-hour high of 398.13, and a low of 375.33. Price climbed toward 394.87 before reversing, with several consecutive red candles pushing it lower. The rebound from approximately 391.11 suggests buyers are defending the lower range, but that alone does not confirm a trend reversal. The moving averages add context. MA7 sits at 392.20, MA14 at 392.55, and MA28 at 393.28. Price remains below all three, indicating that short-term momentum has weakened. The averages are also stacked downward, creating potential overhead resistance around 392.20–393.28. Here is the structural issue: a positive daily return can conceal deteriorating intraday demand. Traders focusing only on the +4.13% figure may overlook the selling pressure emerging near the local high. However, the screenshot cannot establish whether this move reflects genuine spot-market demand, thin liquidity, or broader market positioning. A sustained move above 393.28 could improve the short-term picture, while a rejection followed by a break below 391.11 would weaken the recovery. The bigger question is whether TSLAX can convert its daily strength into sustained buying pressure—or whether the green percentage is masking a market that is already losing momentum. #ByXIMPACT $TSLAXUSDT
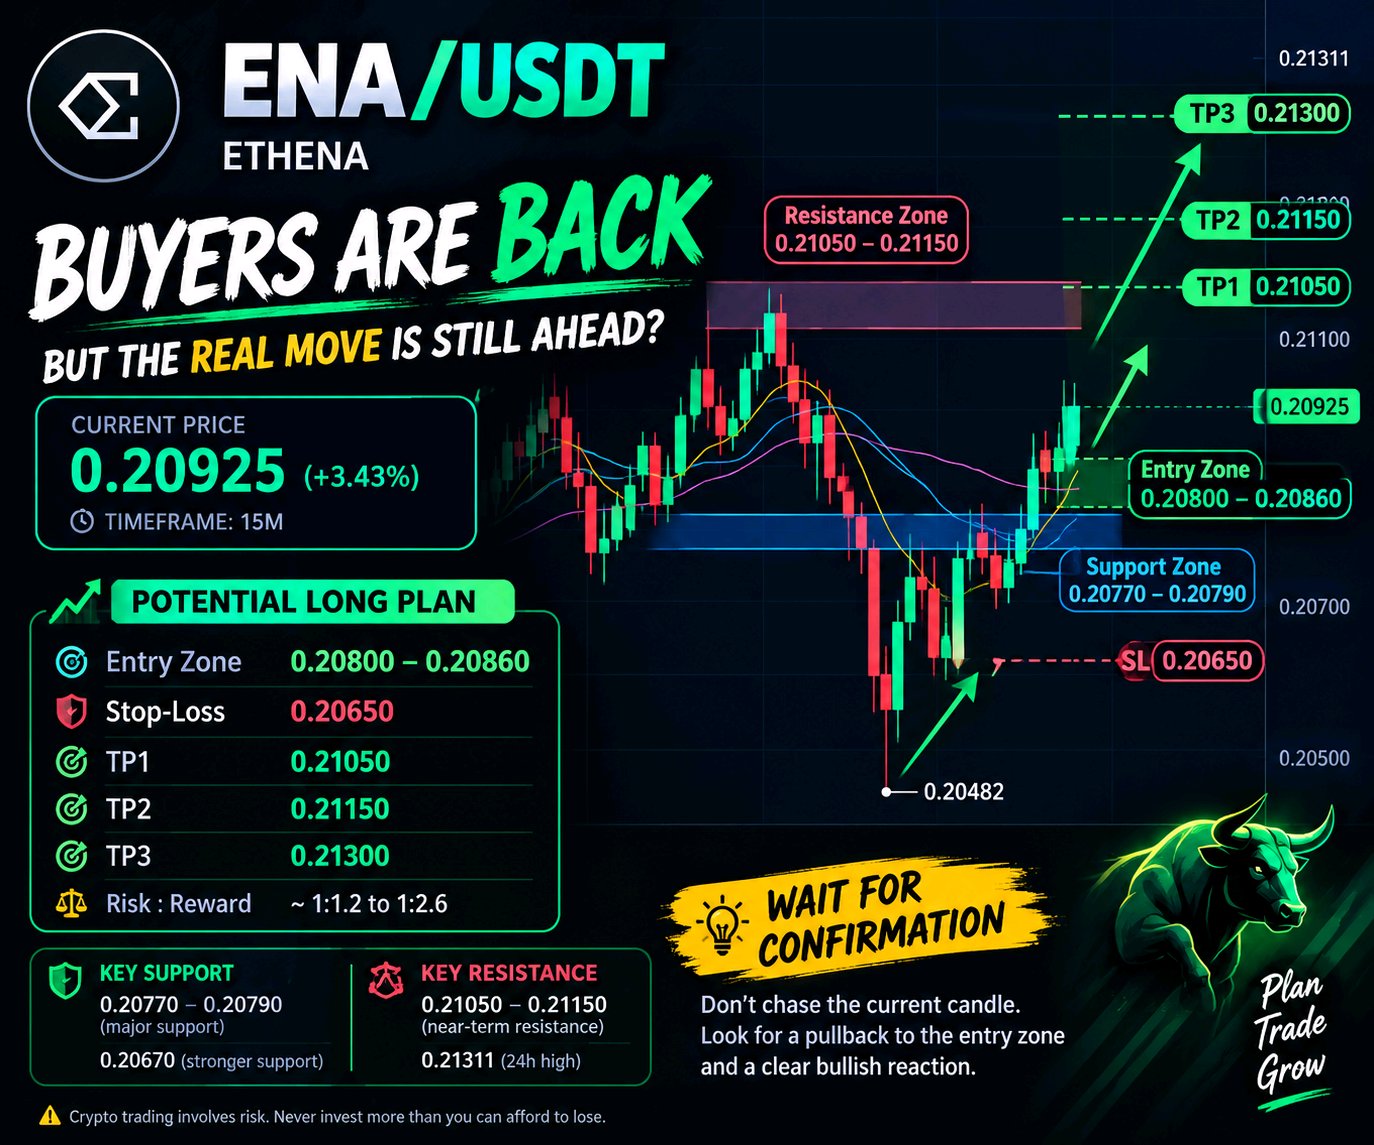
🚨 $ENAUSDT IS WAKING UP — BUT THE REAL MOVE IS STILL AHEAD? ENA/USDT is showing fresh buying pressure on the 15-minute chart. After dipping to 0.20482, the price bounced back toward 0.20925, suggesting buyers are trying to regain control. But there’s one level bulls need to watch closely: 0.21050. 👀 If ENA breaks above this resistance and holds, the recovery could extend further. If sellers step in again, we could see another pullback before the next move. 📈 Potential LONG Plan Entry: 0.20800–0.20860 Stop-Loss: 0.20650 🎯 TP1: 0.21050 🎯 TP2: 0.21150 🎯 TP3: 0.21300 ⚠️ The Risk: Losing the 0.20770 support zone could weaken the bullish setup. Wait for a clean reaction before entering, rather than chasing the latest green candle. 🧠 Trader’s Perspective: The bounce is encouraging, but the confirmation matters more than the excitement. Let price show its hand first. 📢 Verdict: WAIT FOR CONFIRMATION — THEN LOOK FOR A LONG OPPORTUNITY. Trade with a plan, protect your capital, and never risk more than you can afford to lose. #ByXIMPACT
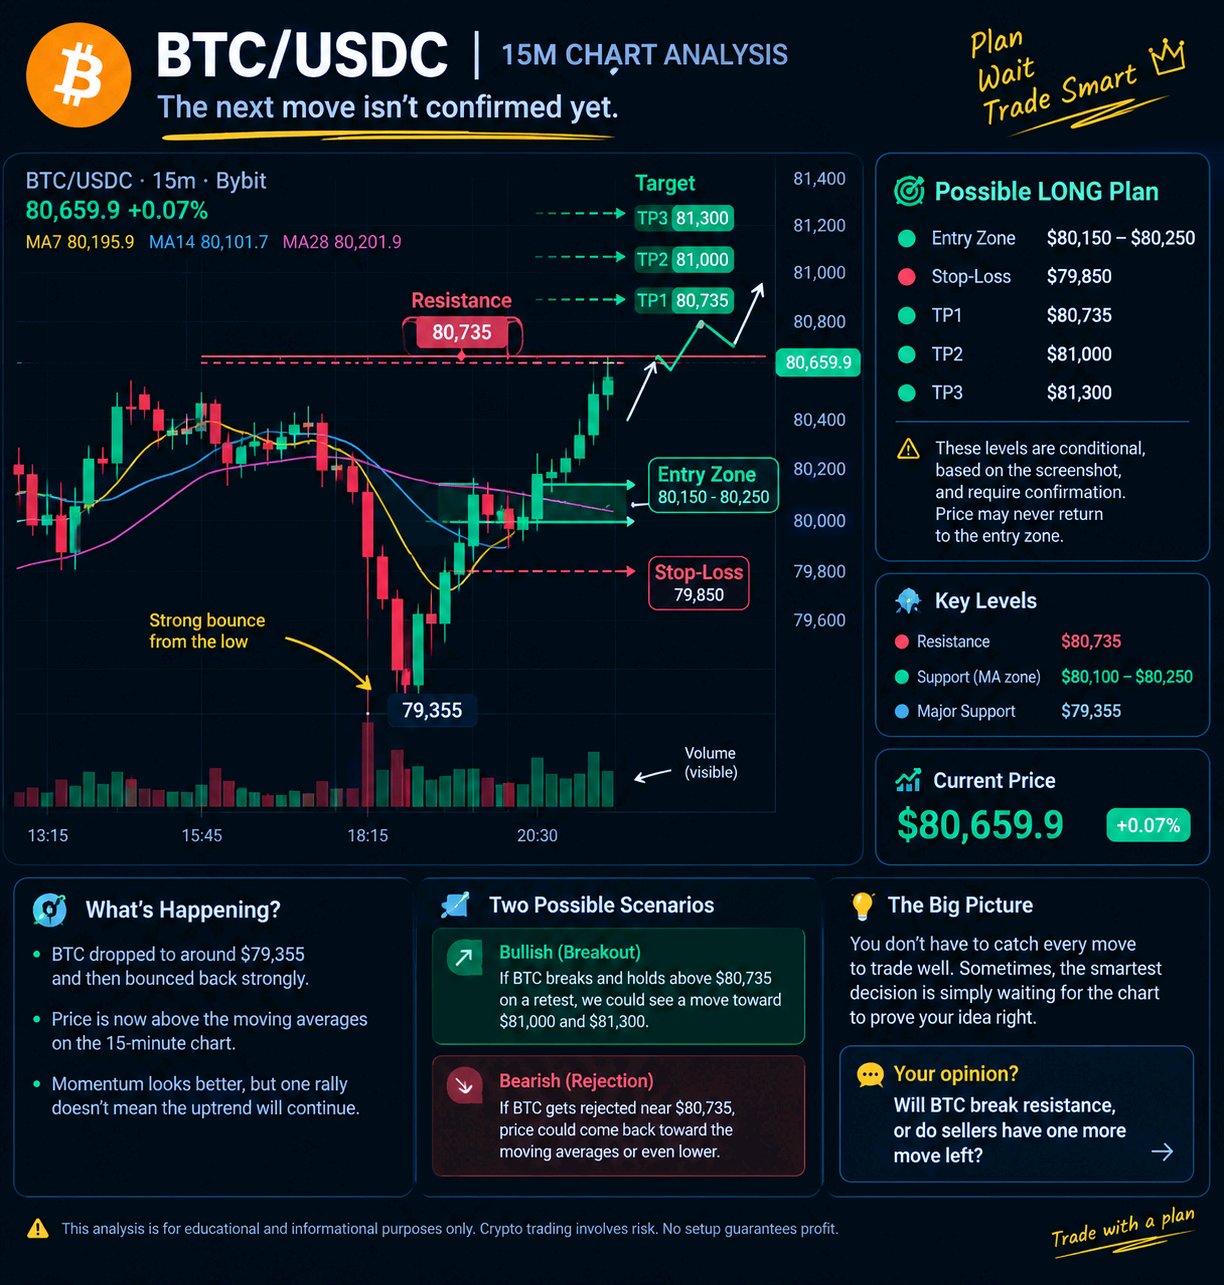
₿ BTC/USDC: THE NEXT MOVE ISN’T CONFIRMED YET Bitcoin has bounced back strongly, but the real test is just ahead. 👀 After dropping near $79,355, buyers pushed BTC toward $80,735. Momentum looks better on the 15-minute chart, but one strong rally doesn’t automatically mean the market is ready to keep climbing. Here’s the level I’m watching: 📍 Resistance: $80,735 If BTC breaks above this area and holds it on a retest, the next upside levels to watch are $81,000 and $81,300. But what if buyers fail? A rejection could send price back toward the moving averages, making patience more valuable than a rushed entry. 🎯 Possible LONG Plan - Entry: $80,150–$80,250 - Stop-Loss: $79,850 - TP1: $80,735 - TP2: $81,000 - TP3: $81,300 ⚠️ These levels are conditional, based on the screenshot, and require confirmation. Price may never return to the entry zone. The key takeaway? You don’t have to catch every move to trade well. Sometimes, the smartest decision is simply waiting for the chart to prove your idea right. 💬 Your opinion: Will BTC break resistance, or do sellers have one more move left? $BTCUSDT #ByXIMPACT