S T E P H E N
I M crypto signal provider 100 parsent right signals lets go
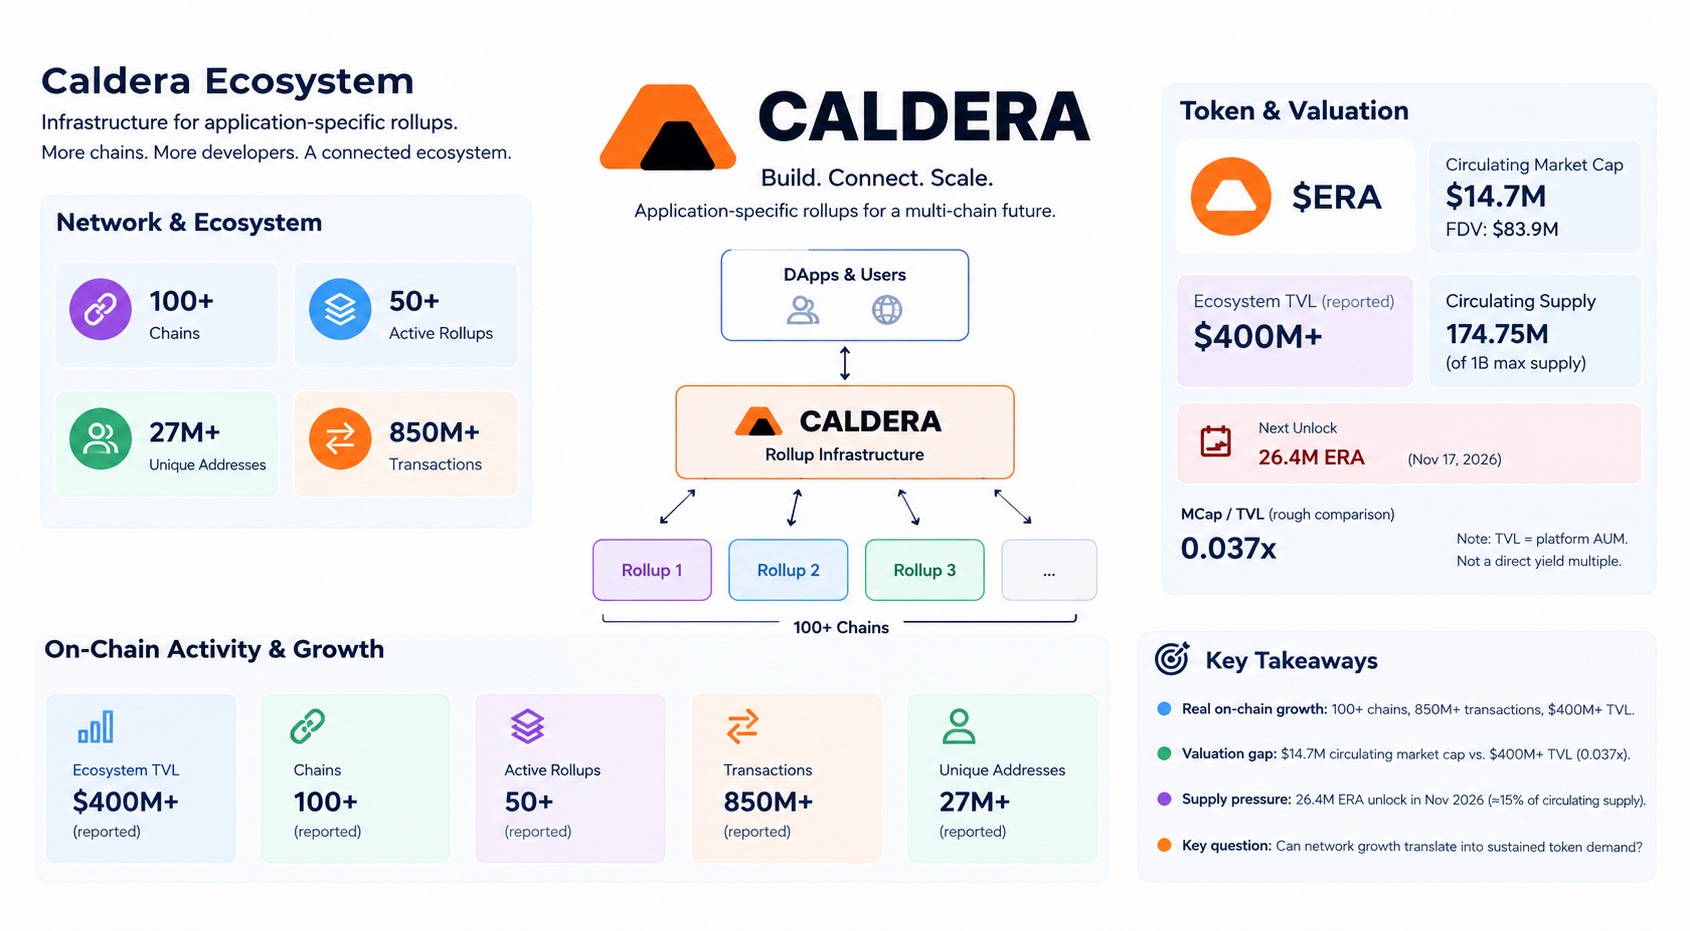
Caldera has reported an ecosystem spanning 100+ chains, with more than 850M transactions and 27M+ unique addresses in its previously published metrics. Its ecosystem TVL was also reported above $400M. That’s real usage, not narrative. The important distinction is that ecosystem activity measures adoption, while the value captured by $ERA depends on how effectively that activity translates into sustainable demand for the token. The valuation picture is less straightforward. ERA’s circulating market cap has previously been reported around $14.7M, against an FDV of approximately $83.9M. Compared with the historical $400M+ ecosystem TVL figure, circulating market cap appears small relative to the network’s reported footprint. However, this is only a rough comparison: ecosystem TVL is not the same as assets managed by Caldera, and it does not directly measure revenue generated for ERA holders. Treating it as a conventional platform-AUM multiple would overstate what the numbers actually demonstrate. Caldera’s core proposition is infrastructure. Its rollup-focused approach allows projects to deploy application-specific chains instead of relying entirely on shared execution environments. That creates several potential growth paths: more deployed rollups, greater transaction activity, additional applications, and stronger demand for the infrastructure connecting these ecosystems. But each metric answers a different question. The number of chains indicates deployment breadth; transaction counts indicate activity; TVL indicates capital deposited across an ecosystem. None independently establishes how much economic value flows back to the token. This is where the valuation gap becomes worth examining. A network can expand its footprint while its token captures only a limited portion of the resulting economic activity. For ERA, the key question is whether demand associated with the network’s infrastructure, services, and ecosystem participation can become durable enough to support its valuation over time. Without a verified link between ecosystem growth and token-level value capture, a low market-cap-to-TVL comparison alone is not sufficient evidence that the token is undervalued. Supply dynamics add another variable. With a previously reported circulating supply of roughly 174.75M ERA against a maximum supply of 1B, future token releases can change the balance between demand and available supply. Unlocks do not automatically create selling pressure, but they increase the amount of supply the market must absorb. If ecosystem adoption accelerates while incremental demand remains weak, growth in network activity may not translate proportionally into token performance. The broader infrastructure market also creates a measurement problem. Comparing Caldera directly with yield-generating RWA platforms can be misleading because the underlying business models differ. Yield platforms can be assessed against assets under management, underlying yields, fees, and revenue distribution. Infrastructure networks require a different framework: recurring revenue, deployed-chain activity, customer retention, network costs, and the share of economic value captured by the token. A credible valuation comparison needs those metrics to be aligned before one project can be called cheaper than another. None of this says the token is wrong. It says the on-chain growth story and the price story are running on separate clocks right now. Worth asking which one catches up to the other first—and whether more chains, transactions, and ecosystem capital alone are enough to close the gap between Caldera’s expanding infrastructure footprint and the value actually captured by $ERA. #ByXIMPACT $ERAUSDT
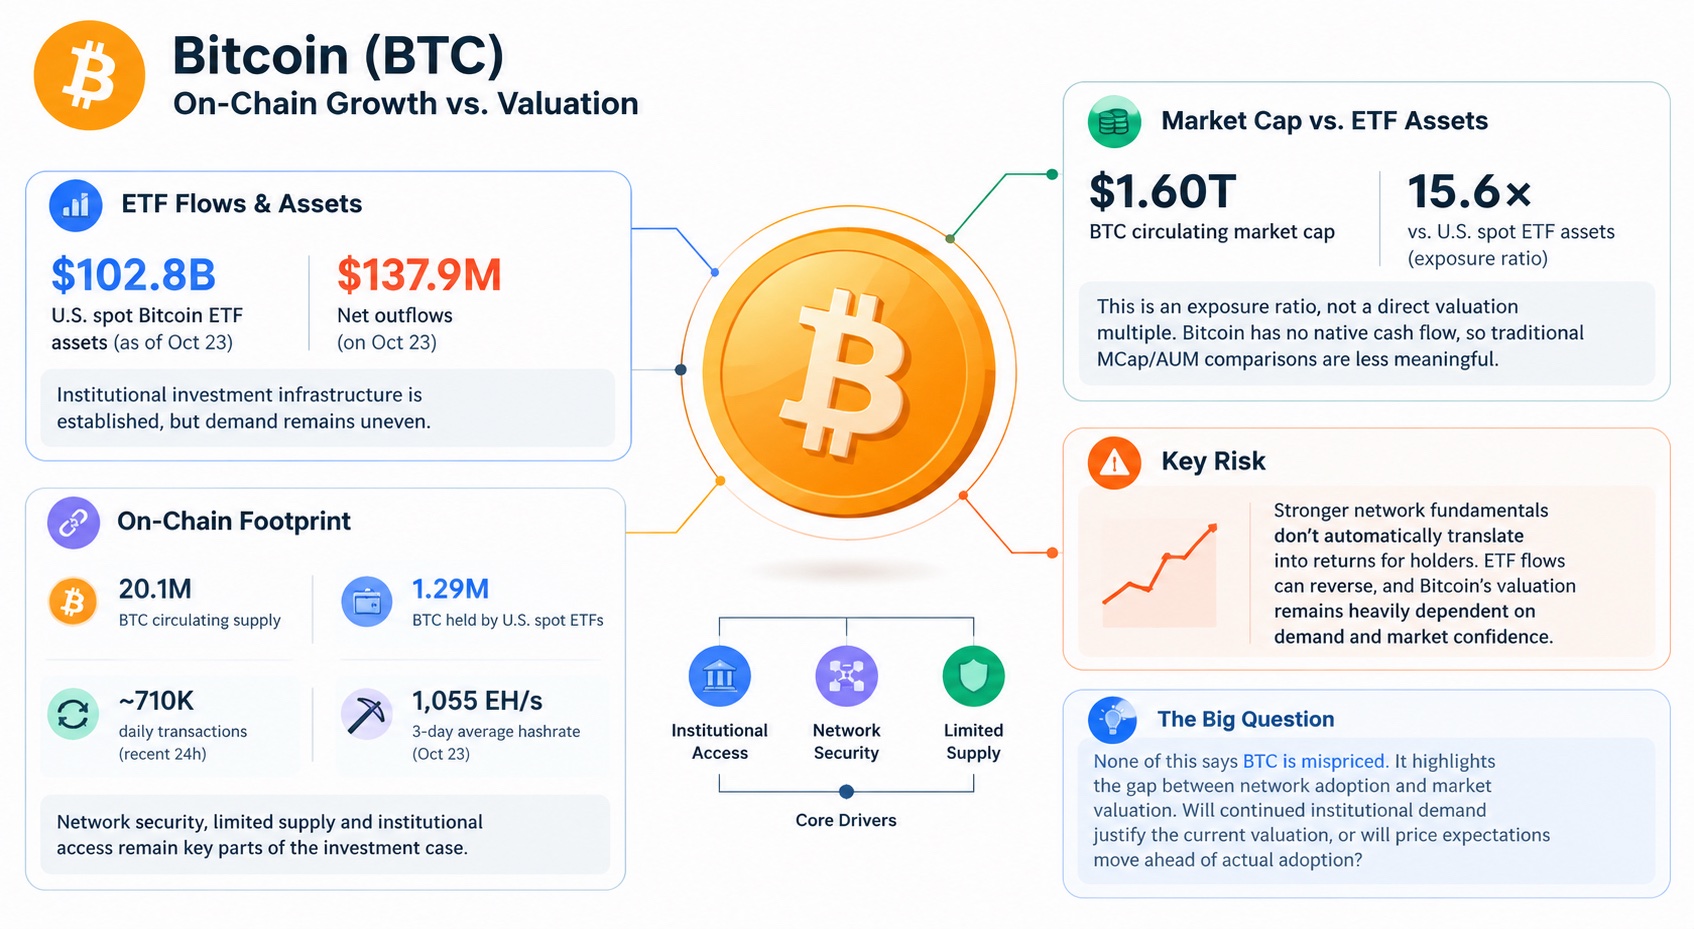
U.S. spot Bitcoin ETFs held approximately $102.8B in assets as of October 23, with $137.9M in net outflows that day. Bitcoin’s institutional investment infrastructure is established, but demand remains uneven. BTC’s circulating market cap is approximately $1.60T, around 15.6× the assets held by U.S. spot Bitcoin ETFs. This is an exposure ratio, not a direct valuation multiple. Unlike yield-generating platforms, Bitcoin has no native cash flow, making traditional MCap/AUM comparisons less meaningful. Approximately 20.1M BTC are circulating, while U.S. spot ETFs hold roughly 1.29M BTC. Network security, limited supply, and institutional access remain central to Bitcoin’s investment case. The key risk is that stronger network fundamentals do not automatically translate into returns for holders. ETF flows can reverse, and Bitcoin’s valuation remains heavily dependent on demand and market confidence. None of this says BTC is mispriced. It highlights the gap between network adoption and market valuation. Will continued institutional demand justify the current valuation, or will price expectations move ahead of actual adoption? #ByXIMPACT $BTCUSDT
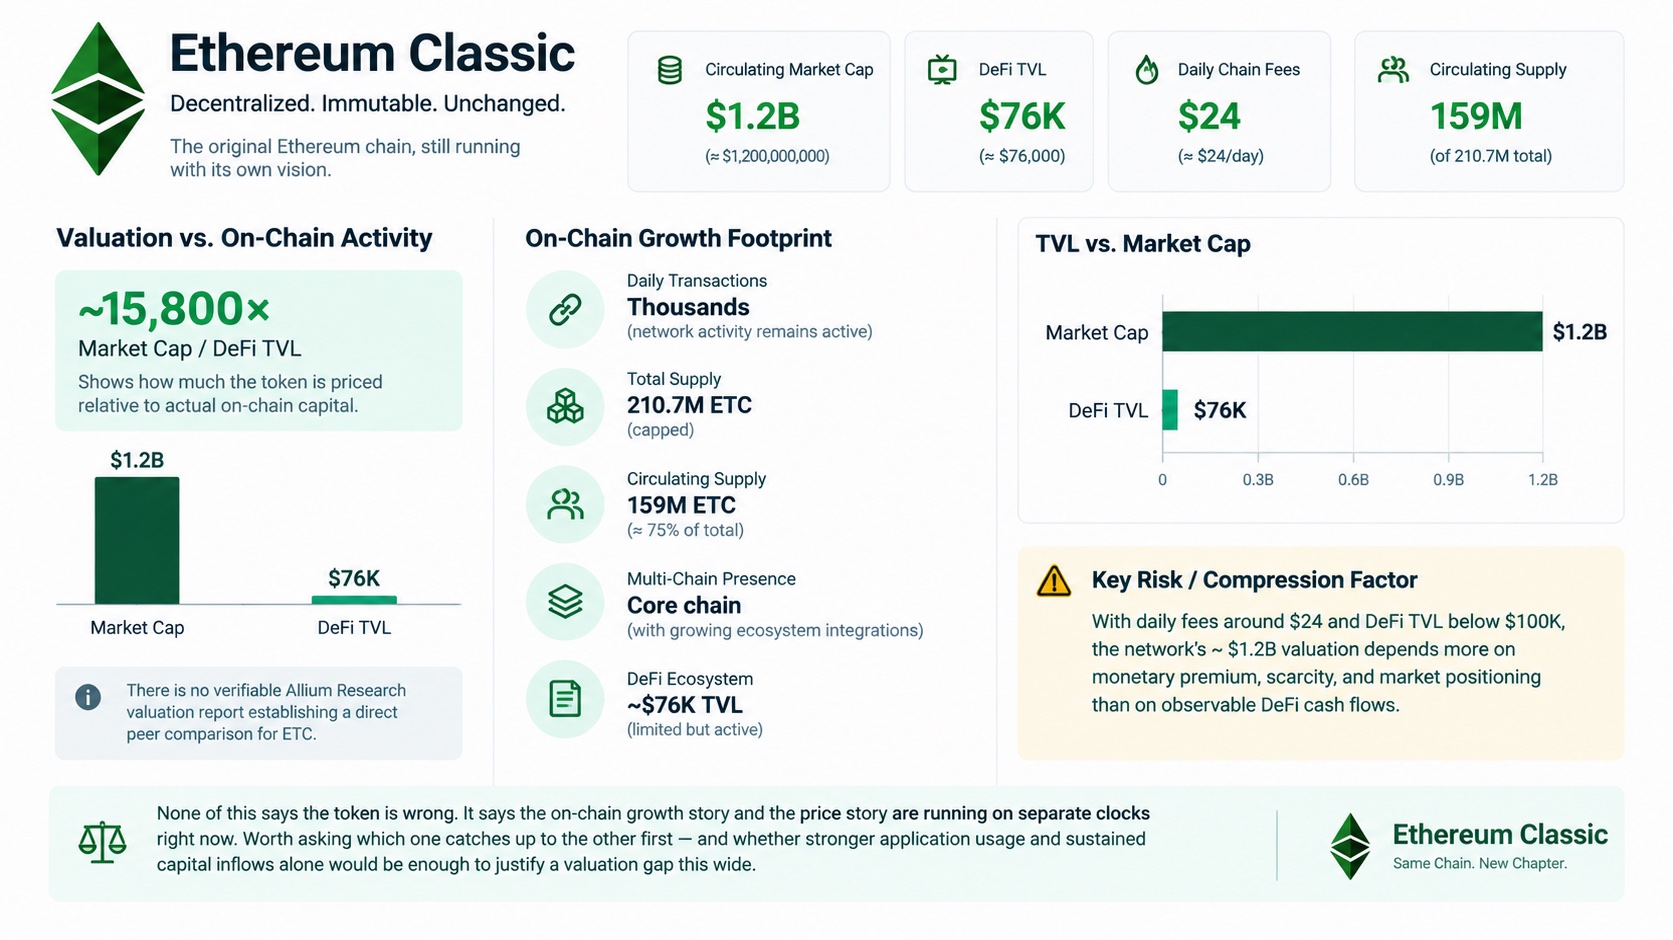
Ethereum Classic carries roughly $1.2B in circulating market cap, but its DeFi footprint is only around $76K in TVL, with daily chain fees near $24. That’s a valuation story running ahead of measurable on-chain financial activity. The market is pricing ETC as an established proof-of-work asset, not a yield platform. Its market cap is roughly 15,800× DeFi TVL, a ratio that highlights the gap between token valuation and capital actively deployed in DeFi. This is not a conventional yield-platform multiple, and I found no verifiable Allium Research valuation report establishing a direct peer comparison. The network still records thousands of daily transactions and maintains a capped supply of 210.7M ETC, with approximately 159M circulating. But transaction count alone does not establish economic demand: the more telling metrics are sustained application usage, capital retention, fee generation, and whether developers can attract liquidity without relying on ETC’s legacy identity. The quiet risk is economic activity. With daily fees measured in tens of dollars and DeFi TVL below $100K, the network’s roughly $1.2B valuation depends far more on monetary premium, scarcity, and market positioning than on observable DeFi cash flows. None of this says the token is wrong. It says the on-chain growth story and the price story are running on separate clocks right now. Worth asking which one catches up to the other first — and whether stronger application usage and sustained capital inflows alone would be enough to justify a valuation gap this wide. #ByXIMPACT $ETCUSDT
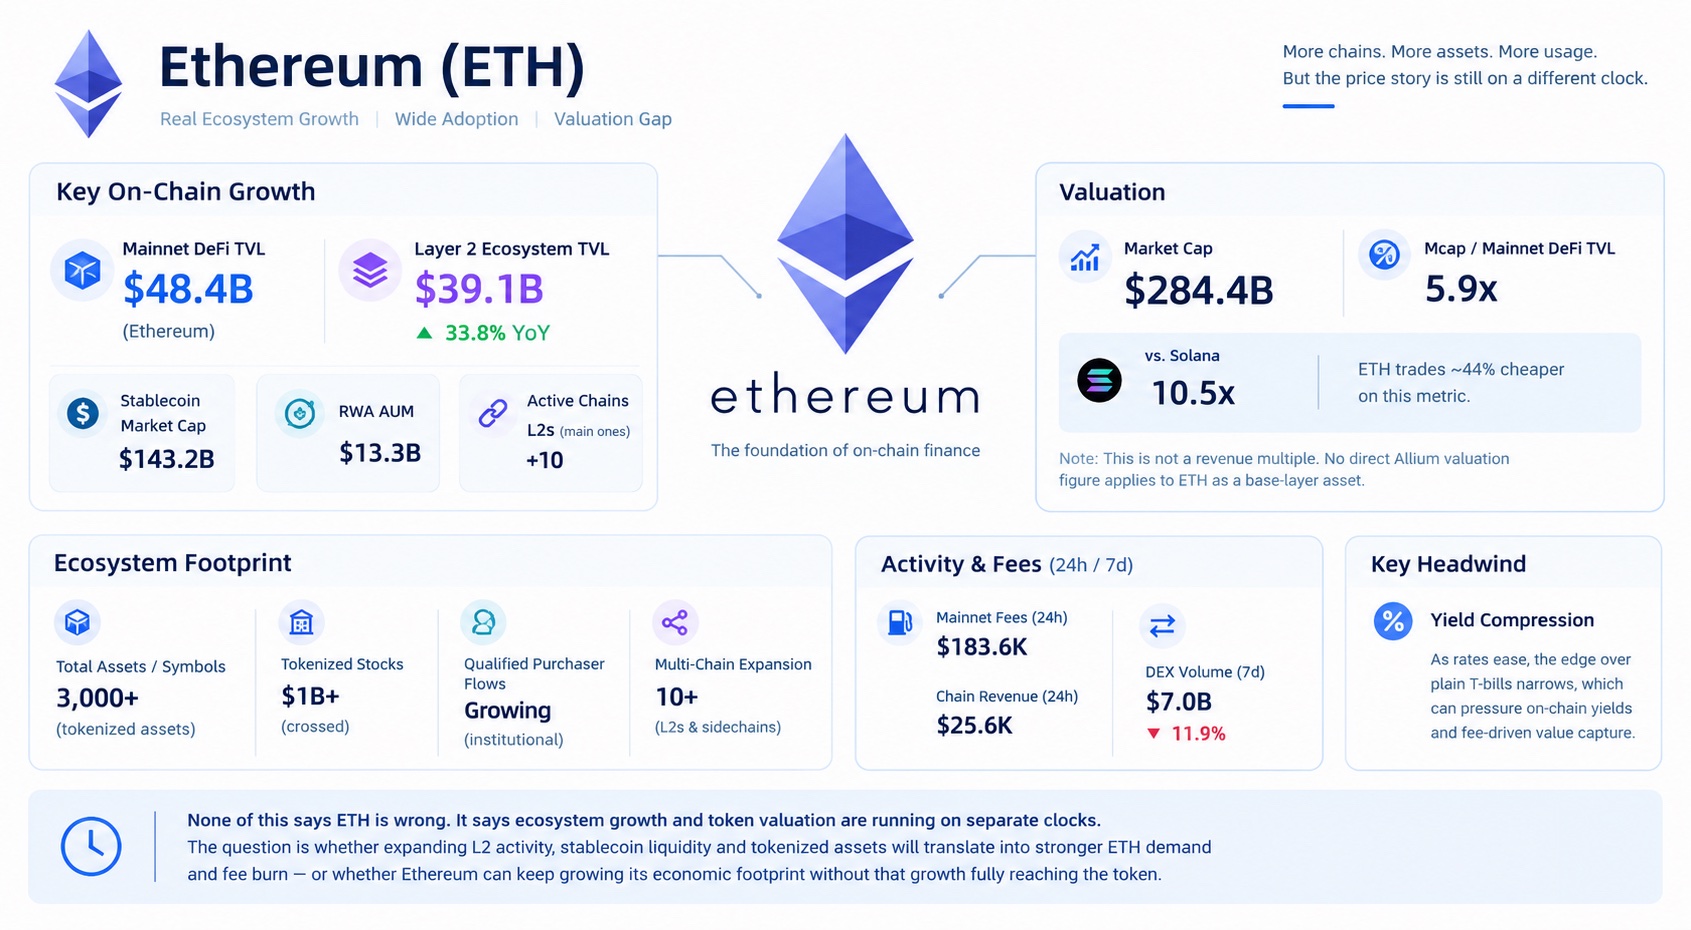
Ethereum’s mainnet DeFi TVL stands at $48.4B, while its Layer 2 ecosystem holds $39.1B, reportedly up 33.8% year over year. That’s real usage, not just a narrative. At a $284.4B market cap, ETH trades at roughly 5.9x mainnet DeFi TVL. On the same metric, Solana sits near 10.5x. The gap is notable, although TVL multiples alone cannot determine fair value. Ethereum’s broader footprint includes $143.2B in stablecoin market cap and $13.3B in tokenized real-world assets. Yet ecosystem expansion does not automatically translate into stronger value capture for ETH. Layer 2 growth brings lower transaction costs, but it also raises a key question: how much economic activity ultimately flows back to the underlying asset? None of this says ETH is mispriced. It says network growth and token valuation may be moving on different timelines. Will expanding liquidity, tokenized assets and Layer 2 adoption create stronger demand for ETH, or can the ecosystem keep growing without a proportional increase in value accruing to the token? $ETHUSDT #ByXIMPACT
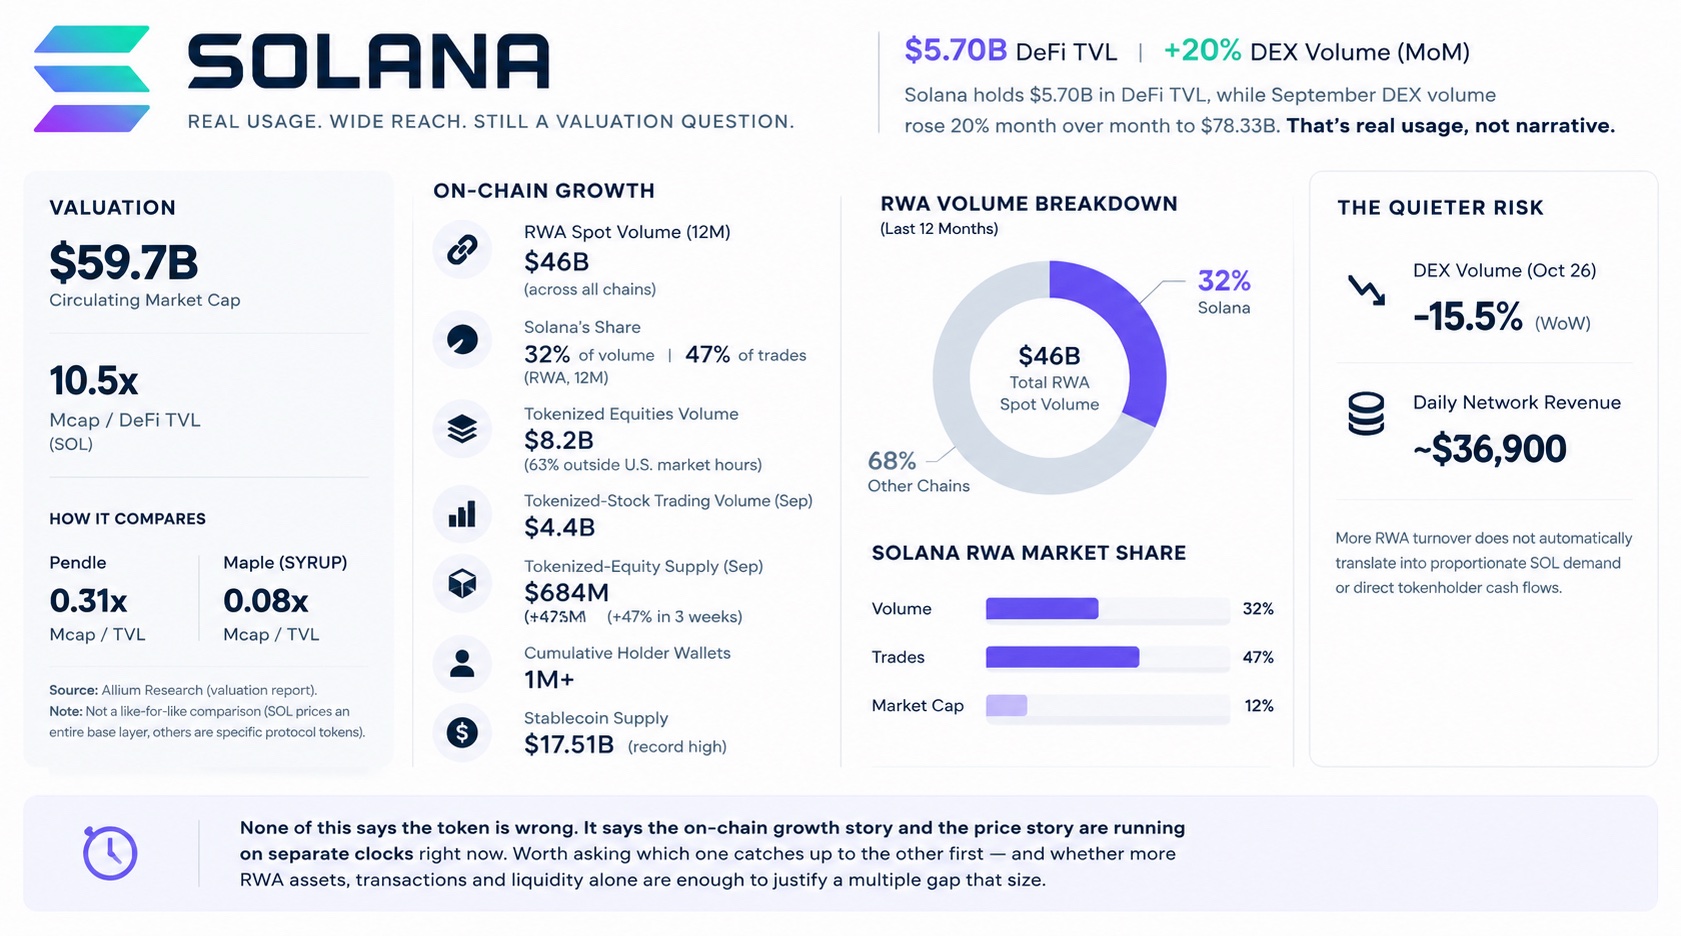
Solana holds $5.70B in DeFi TVL, while September DEX volume rose 20% month over month to $78.33B. That’s real usage, not narrative. At a circulating market cap of roughly $59.7B, SOL trades at 10.5x ecosystem DeFi TVL. On the same crude market-cap-to-TVL measure, that is roughly 33x Pendle’s 0.31x and 130x Maple’s SYRUP at 0.08x. These are not like-for-like valuations: SOL prices an entire base layer, while those tokens represent specific protocol economics. Still, the multiple gap raises a question about how much network activity the market is already pricing in. The underlying RWA footprint is substantial. Allium Research’s September study found Solana processed $14.7B of the $46B in on-chain RWA spot volume across chains over the 12 months to August 18, capturing 32% of volume and 47% of trades despite holding just 12% of RWA market cap. Tokenized equities contributed $8.2B, with 63% of that volume occurring outside U.S. market hours. September added another data point: tokenized-stock trading volume reached approximately $4.4B, tokenized-equity supply climbed to $684M, up 47% in three weeks, and cumulative holder wallets crossed 1 million. Stablecoin supply reached a record $17.51B, giving the network a broader settlement footprint beyond speculative trading. The quieter risk is value capture. On October 26, Solana’s weekly DEX volume was down 15.5%, while daily network revenue stood at roughly $36,900. More RWA turnover does not automatically translate into proportionate SOL demand or direct tokenholder cash flows. None of this says the token is wrong. It says the on-chain growth story and the price story are running on separate clocks right now. Worth asking which one catches up to the other first — and whether more RWA assets, transactions and liquidity alone are enough to justify a multiple gap that size. $SOLUSDT #ByXIMPACT
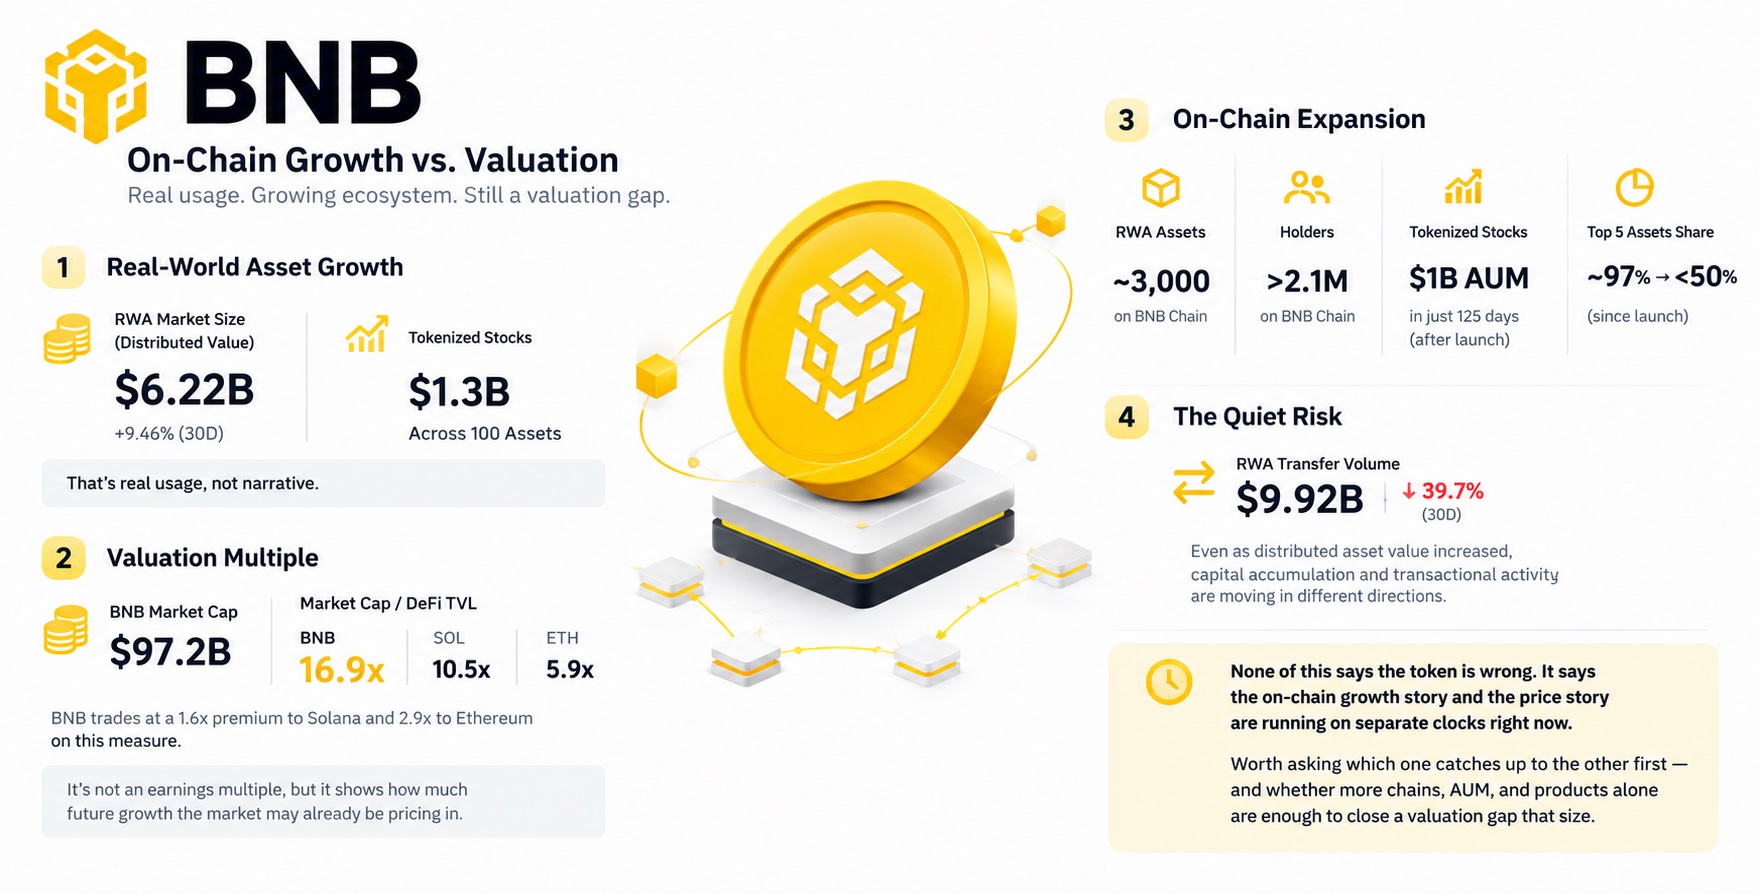
BNB Chain’s real-world asset market has reached $6.22B in distributed value, up 9.46% over 30 days, while tokenized stocks have crossed $1.3B across 100 assets. That’s real usage, not narrative. The valuation is harder to ignore. BNB’s market cap sits near $97.2B. Relative to DeFi TVL, its market cap is approximately 16.9x, compared with 10.5x for Solana and 5.9x for Ethereum. That puts BNB at a 1.6x premium to Solana and 2.9x to Ethereum on this measure. It is not an earnings multiple, but it highlights how much future growth the market may already be pricing in. The underlying footprint is expanding. BNB Chain has nearly 3,000 RWA assets and more than 2.1M holders. Tokenized stocks crossed $1B in AUM just 125 days after launch, while the top five assets’ share fell from roughly 97% to below 50%. Adoption appears to be spreading beyond a handful of tickers. The quieter risk is that asset growth does not automatically translate into sustained activity. RWA transfer volume fell 39.7% over 30 days to $9.92B, even as distributed asset value increased. Capital accumulation and transactional activity are moving in different directions. None of this says the token is wrong. It says the on-chain growth story and the price story are running on separate clocks right now. Worth asking which one catches up to the other first—and whether more chains, AUM, and products alone are enough to close a valuation gap that size. $BNBUSDT #ByXIMPACT
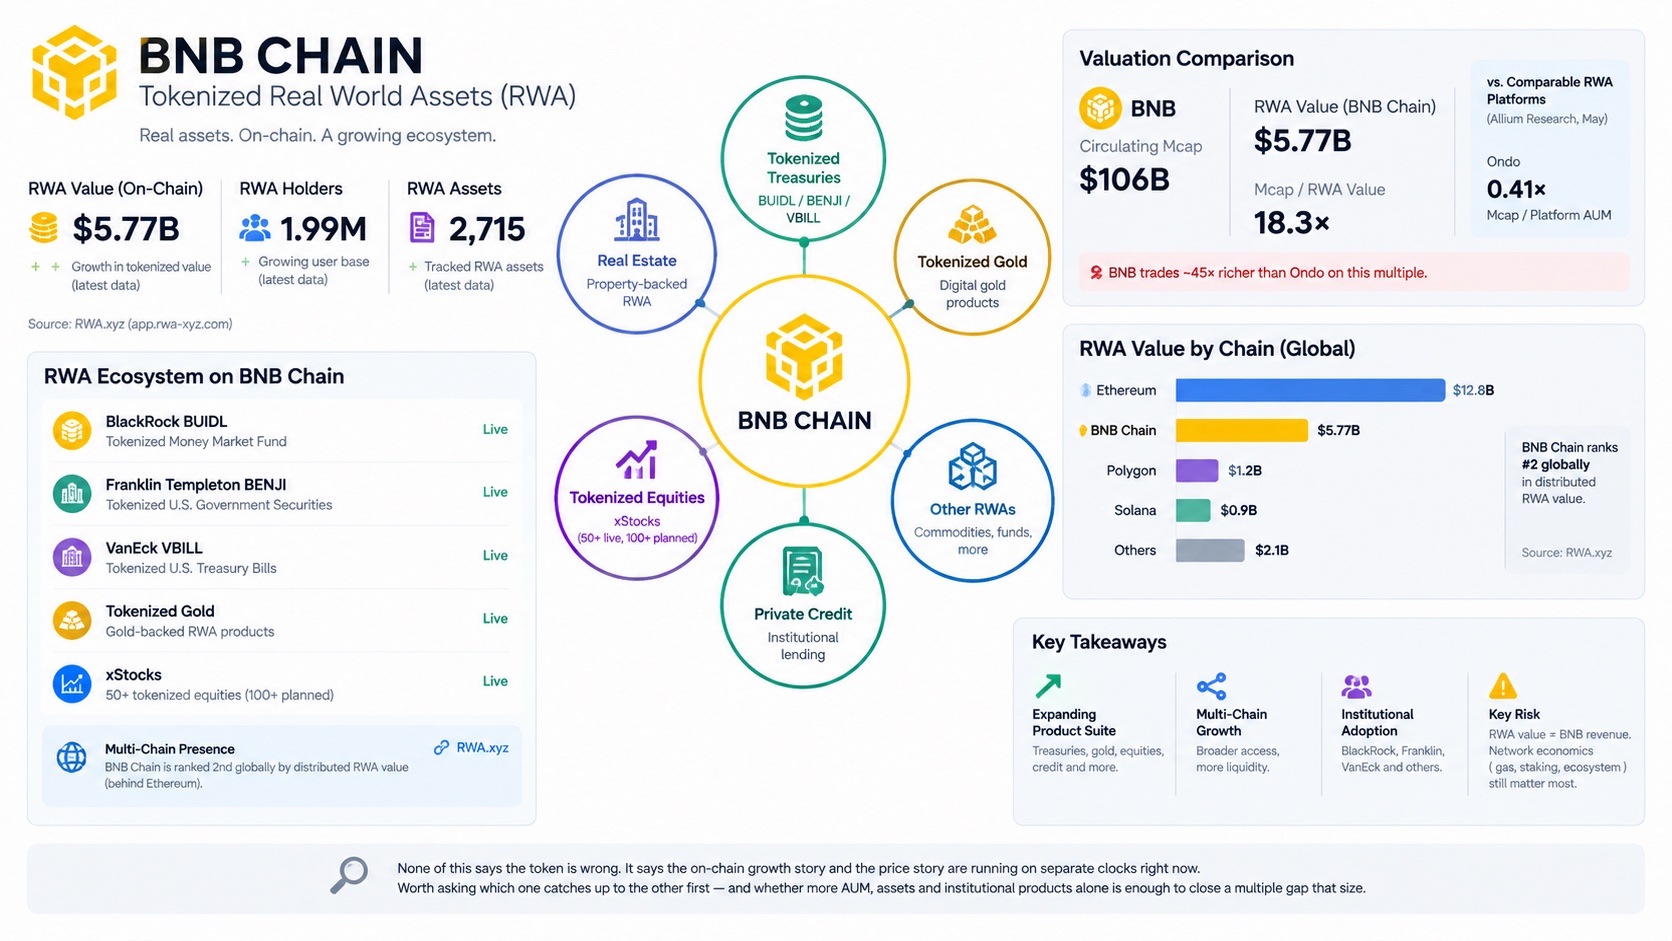
BNB Chain now carries roughly $5.77B in tokenized RWA value, with 1.99M RWA holders and 2,715 tracked RWA assets. That’s real usage, not narrative. The valuation gap is harder to ignore. With BNB’s circulating market cap around $106B, the token is valued at roughly 18.3× BNB Chain’s RWA value. As a reference point, Allium’s May valuation work put Ondo at 0.41× Mcap/Platform AUM, meaning BNB’s RWA-value multiple is roughly 45× richer on this narrow comparison. The underlying footprint is expanding beyond Treasuries: BlackRock’s BUIDL, Franklin Templeton’s BENJI, VanEck’s VBILL, tokenized gold, and equity products are live, while xStocks brought 50+ tokenized equities onto BNB Chain with 100+ more planned. RWA.xyz now ranks BNB Chain second globally by distributed RWA value, behind Ethereum. The quieter issue is that RWA value is not the same thing as value accruing to BNB itself. BNB captures broader network economics through gas, staking and ecosystem activity, but the RWA layer alone does not justify treating every dollar of tokenized assets as BNB revenue. None of this says the token is wrong. It says the on-chain growth story and the price story are running on separate clocks right now. Worth asking which one catches up to the other first — and whether more AUM, assets and institutional products alone is enough to close a multiple gap this large. #ByXIMPACT $BNBUSDT
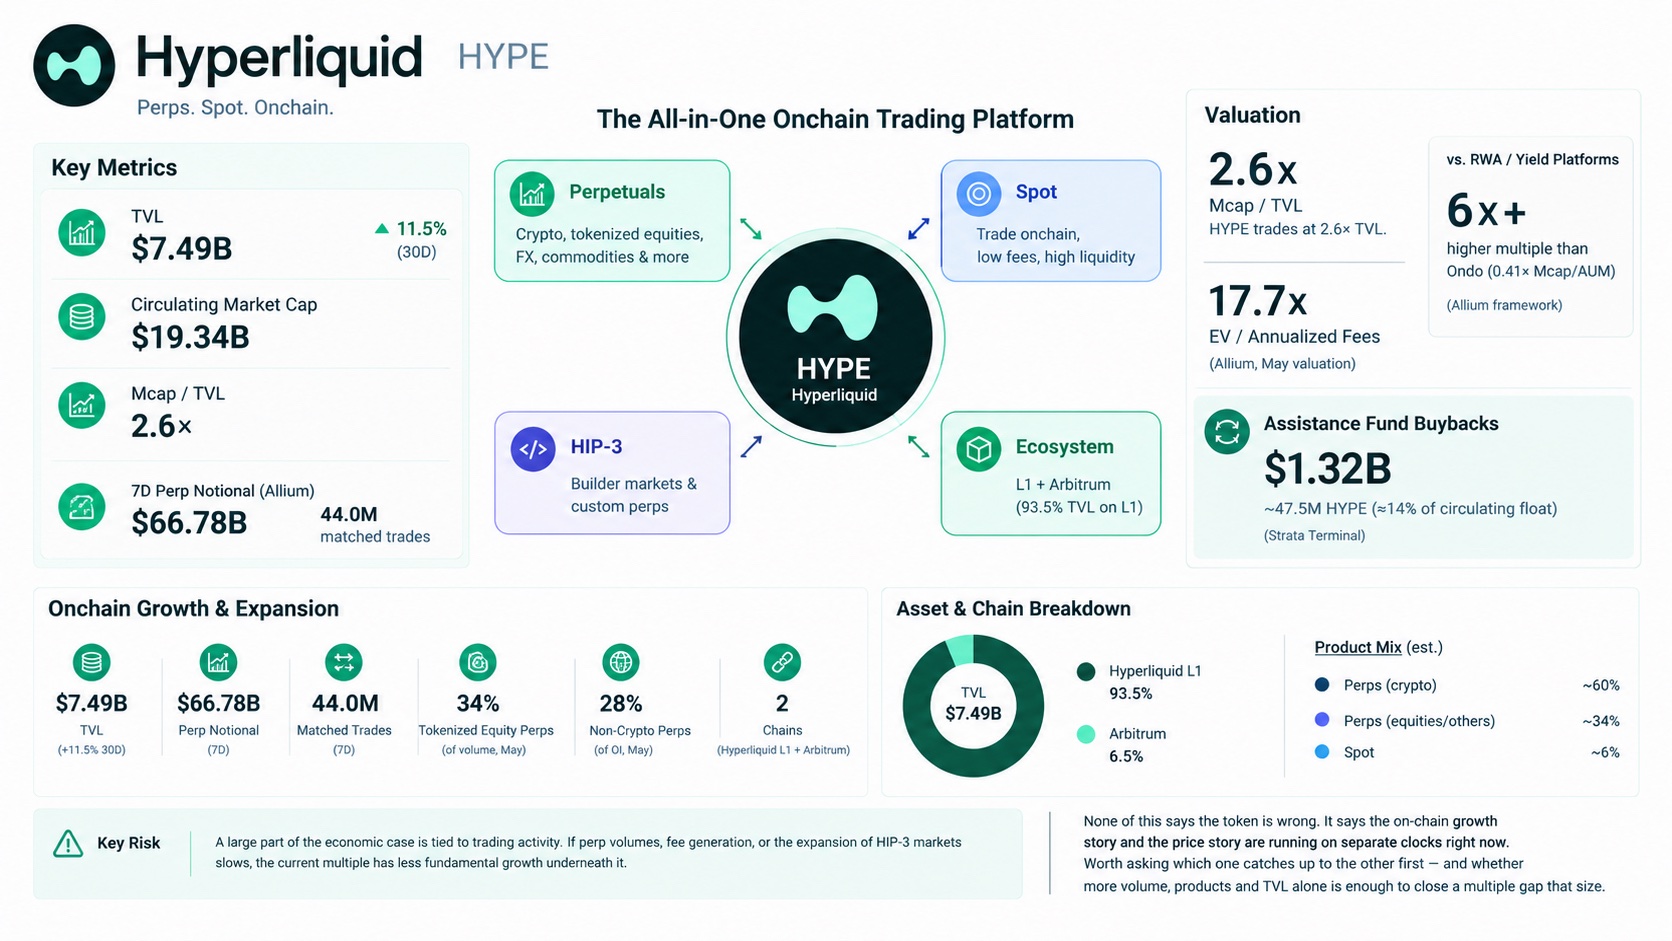
Hyperliquid currently holds about $7.49B in TVL, up 11.5% over the last 30 days. That’s real usage, not narrative. The valuation is where the gap becomes harder to ignore. At roughly $19.34B circulating market cap, HYPE trades at about 2.6× TVL. For context, Allium’s May valuation work put Hyperliquid at 17.7× EV/annualized fees on $6.34B average daily volume, while its current fee run-rate has moved toward roughly $911M annualized. The comparison is not perfectly like-for-like, but the premium is substantial: Ondo, for example, was at 0.41× circulating Mcap/Platform AUM in Allium’s RWA framework — meaning HYPE’s Mcap/TVL multiple is more than 6× higher. The underlying footprint is still expanding. Allium’s latest Hyperliquid data recorded $66.78B of perp notional across 44.0M matched trades in just seven days to September 23, with HIP-3 builder markets now embedded directly into the same onchain trading infrastructure. Earlier Allium research found tokenized-equity perps already represented roughly 34% of platform volume, while non-crypto perps reached 28% of open interest in May. Hyperliquid now spans its L1 and Arbitrum, with roughly 93.5% of TVL still concentrated on Hyperliquid L1. There is also a measurable value-accrual mechanism: the Assistance Fund has bought back roughly $1.32B of HYPE, representing about 47.5M tokens, or roughly 14% of the circulating float under Strata’s tracking methodology. The quieter risk is that a large part of the economic case remains tied to trading activity. If perp volumes, fee generation, or the expansion of HIP-3 markets slows, the current multiple has less fundamental growth underneath it. None of this says the token is wrong. It says the on-chain growth story and the price story are running on separate clocks right now. Worth asking which one catches up to the other first — and whether more volume, products and TVL alone is enough to close a multiple gap that size. $HYPEUSDT #ByXIMPACT
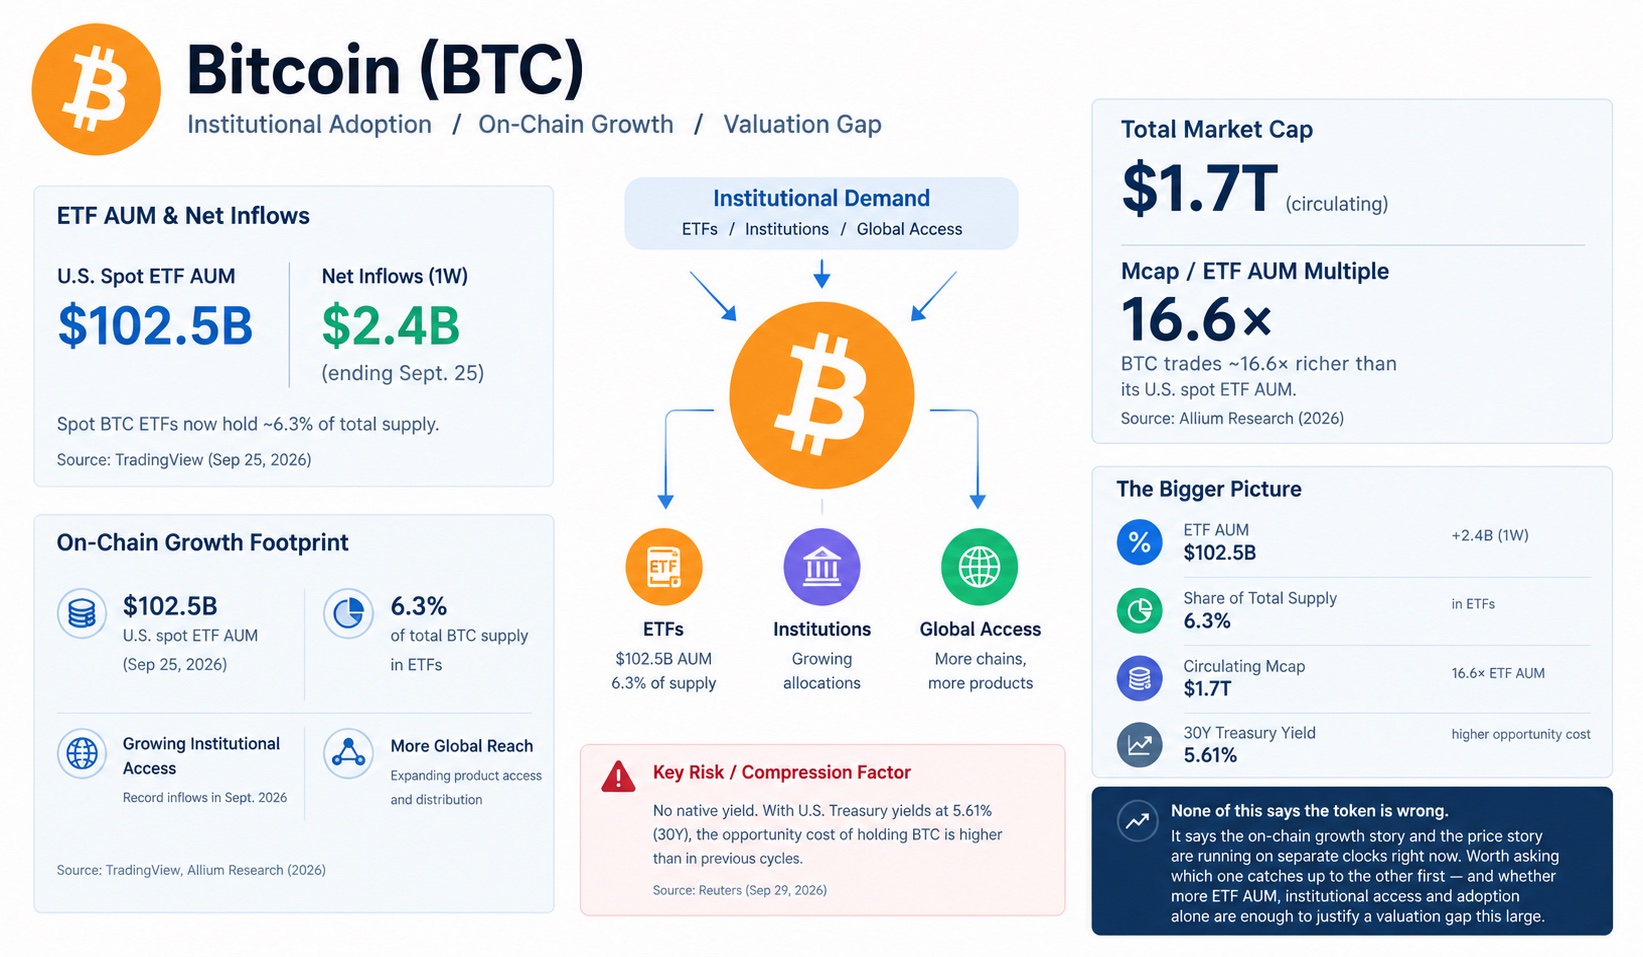
Bitcoin’s institutional access layer is now carrying roughly $102.5B in U.S. spot-ETF AUM, with spot BTC ETFs pulling $2.4B of net inflows in the week ending Sept. 25. That’s real usage, not narrative. But the valuation is already massive: BTC’s circulating market cap is roughly $1.7T, putting total market cap at about 16.6× the AUM sitting inside U.S. spot ETFs. There is no conventional platform-AUM multiple for Bitcoin itself, so ETF AUM is the closest measurable institutional asset-base equivalent. The on-chain footprint is also becoming more institutional rather than simply more speculative. U.S. spot ETFs now represent roughly 6.3% of Bitcoin’s total supply, while September ETF demand pushed AUM above $100B and briefly generated some of the strongest inflow sessions of 2026. The quieter issue is opportunity cost. Bitcoin produces no native cash yield, while U.S. Treasury yields have moved sharply higher; the 30-year Treasury recently reached 5.61%, increasing the hurdle rate for a non-yielding asset. None of this says the token is wrong. It says the on-chain growth story and the price story are running on separate clocks right now. Worth asking which one catches up to the other first — and whether more ETF AUM, institutional access and adoption alone are enough to justify a valuation gap this large. $BTCUSDT #ByXIMPACT
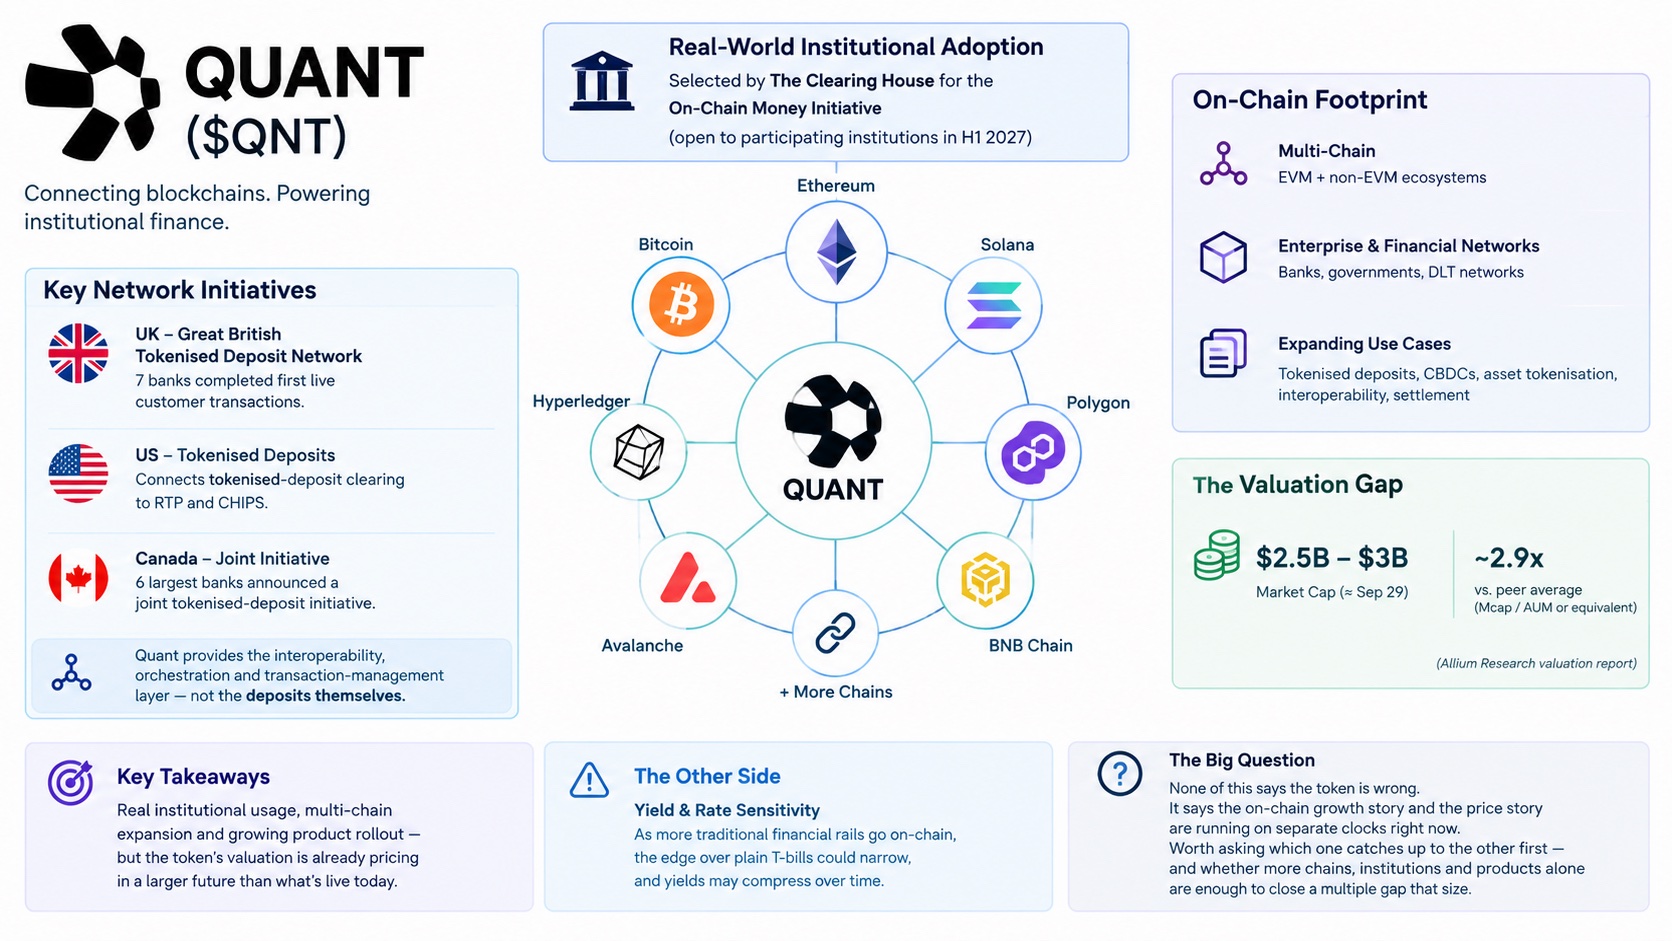
QNT is not an AUM platform, so there is no defensible “platform AUM” figure to plug into an Allium-style Mcap/AUM multiple. The more relevant operating metric is institutional infrastructure being put into production — including The Clearing House selecting Quant for its On-Chain Money Initiative, expected to open to participating institutions in H1 2027. That’s real usage, not narrative. The valuation clock, however, has moved much faster. QNT’s market cap has expanded from roughly $850M on September 23 to around $2.5B–$3B by September 29, while the circulating supply is essentially the full supply. That means the token is now pricing a materially larger future revenue/utility footprint before the newly announced US network is even live. The underlying footprint is becoming more concrete: Quant is involved in the UK’s Great British Tokenised Deposit network, where seven banks have completed first live customer transactions; its US initiative connects tokenised-deposit clearing to RTP and CHIPS; and Canada’s six largest banks have also announced a joint tokenised-deposit initiative. Quant’s role is the interoperability, orchestration and transaction-management layer rather than ownership of the deposits themselves. The quiet risk is timing. The infrastructure milestones are real, but several of the largest commercial opportunities remain deployment-stage rather than scaled revenue streams. A higher QNT valuation therefore requires the institutional footprint to translate into measurable economic capture, not simply more partnerships and networks. None of this says the token is wrong. It says the on-chain/institutional growth story and the price story are running on separate clocks right now. Worth asking which one catches up to the other first — and whether more networks, institutions and transaction volume alone are enough to close that valuation gap. $QNTUSDT #ByXIMPACT
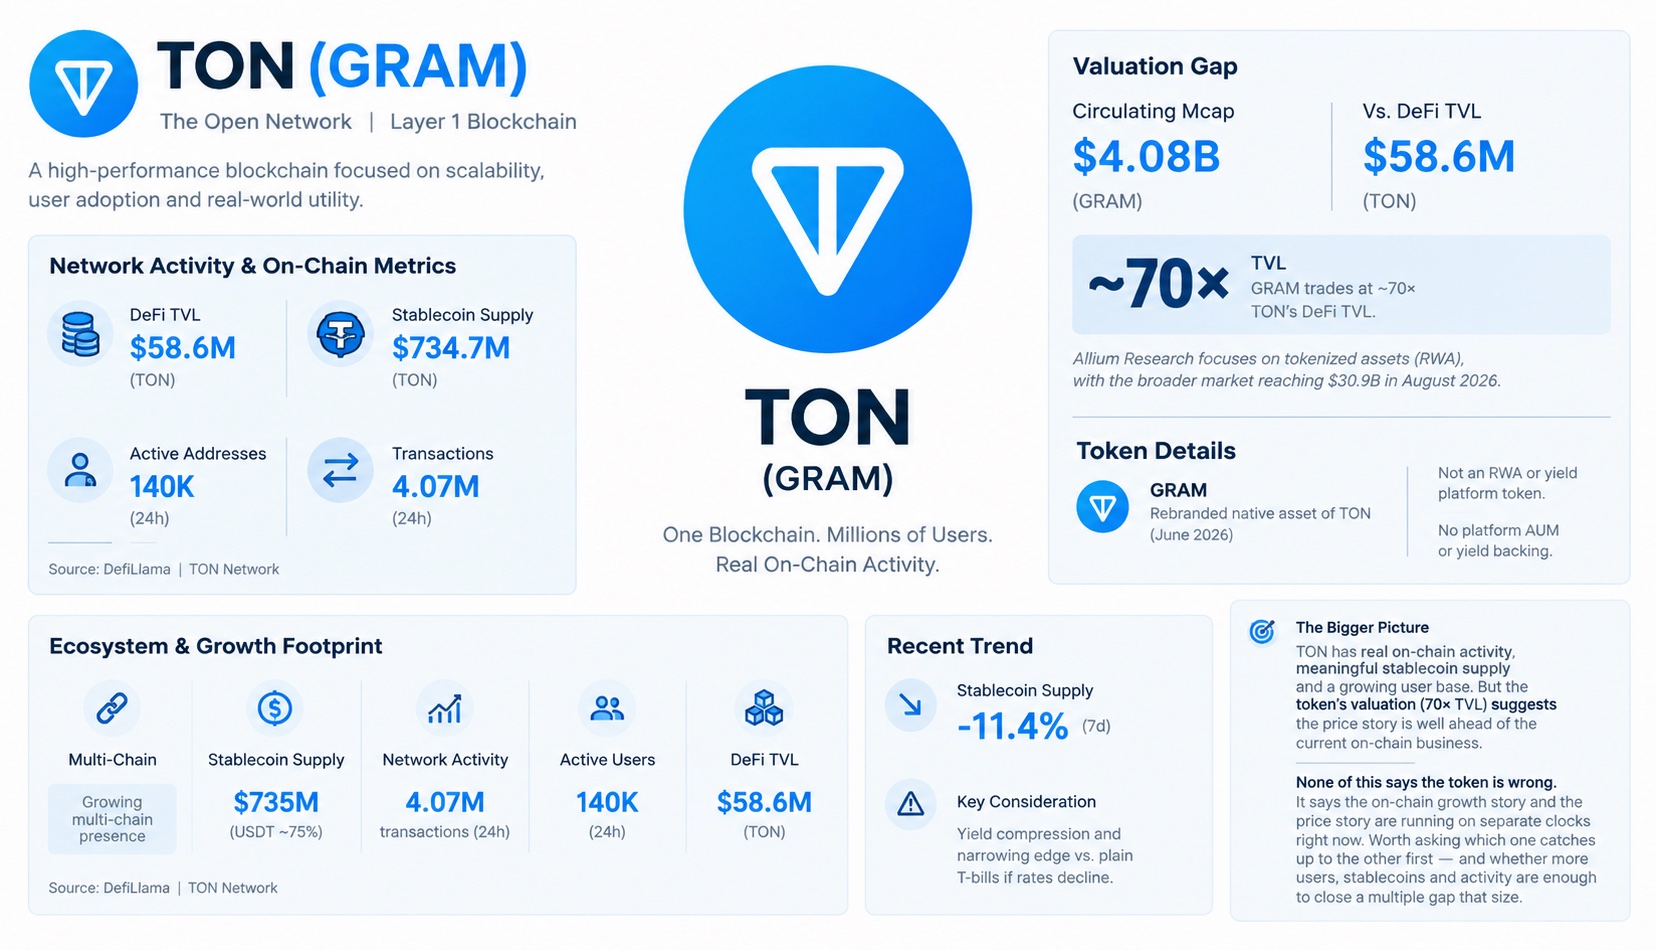
GRAM is not a standalone RWA or yield platform, so a platform-AUM comparison is not directly applicable. The underlying TON network currently has about $58.6M in DeFi TVL and $734.7M in stablecoin supply, with 140K active addresses and 4.07M transactions in 24 hours. That’s real usage, not narrative. The valuation gap is the interesting part. GRAM trades at roughly a $4.08B circulating market cap against only $58.6M of DeFi TVL — around 70× TVL. There is no current Allium report assigning GRAM a platform-AUM multiple; Allium’s RWA research instead focuses on tokenized assets themselves, with the broader market reaching $30.9B by August 4, 2026. The network footprint is meaningful: TON carries roughly $735M of stablecoins, with USDT representing about 75%, while daily activity remains in the millions of transactions. But capital deployed into DeFi is still comparatively small, and stablecoin supply has fallen about 11.4% over the last seven days. There is also a structural distinction worth keeping clear: GRAM is the rebranded native asset of The Open Network, not a claim on an RWA platform’s AUM or cash flows. The June 2026 rebrand changed TON’s ticker to GRAM without changing the underlying blockchain. None of this says the token is wrong. It says the on-chain growth story and the price story are running on separate clocks right now. Worth asking whether more users, stablecoins and network activity are enough to close a valuation gap of that size — and whether the underlying economic activity can catch up to the multiple first. $GRAMUSDT #ByXIMPACT
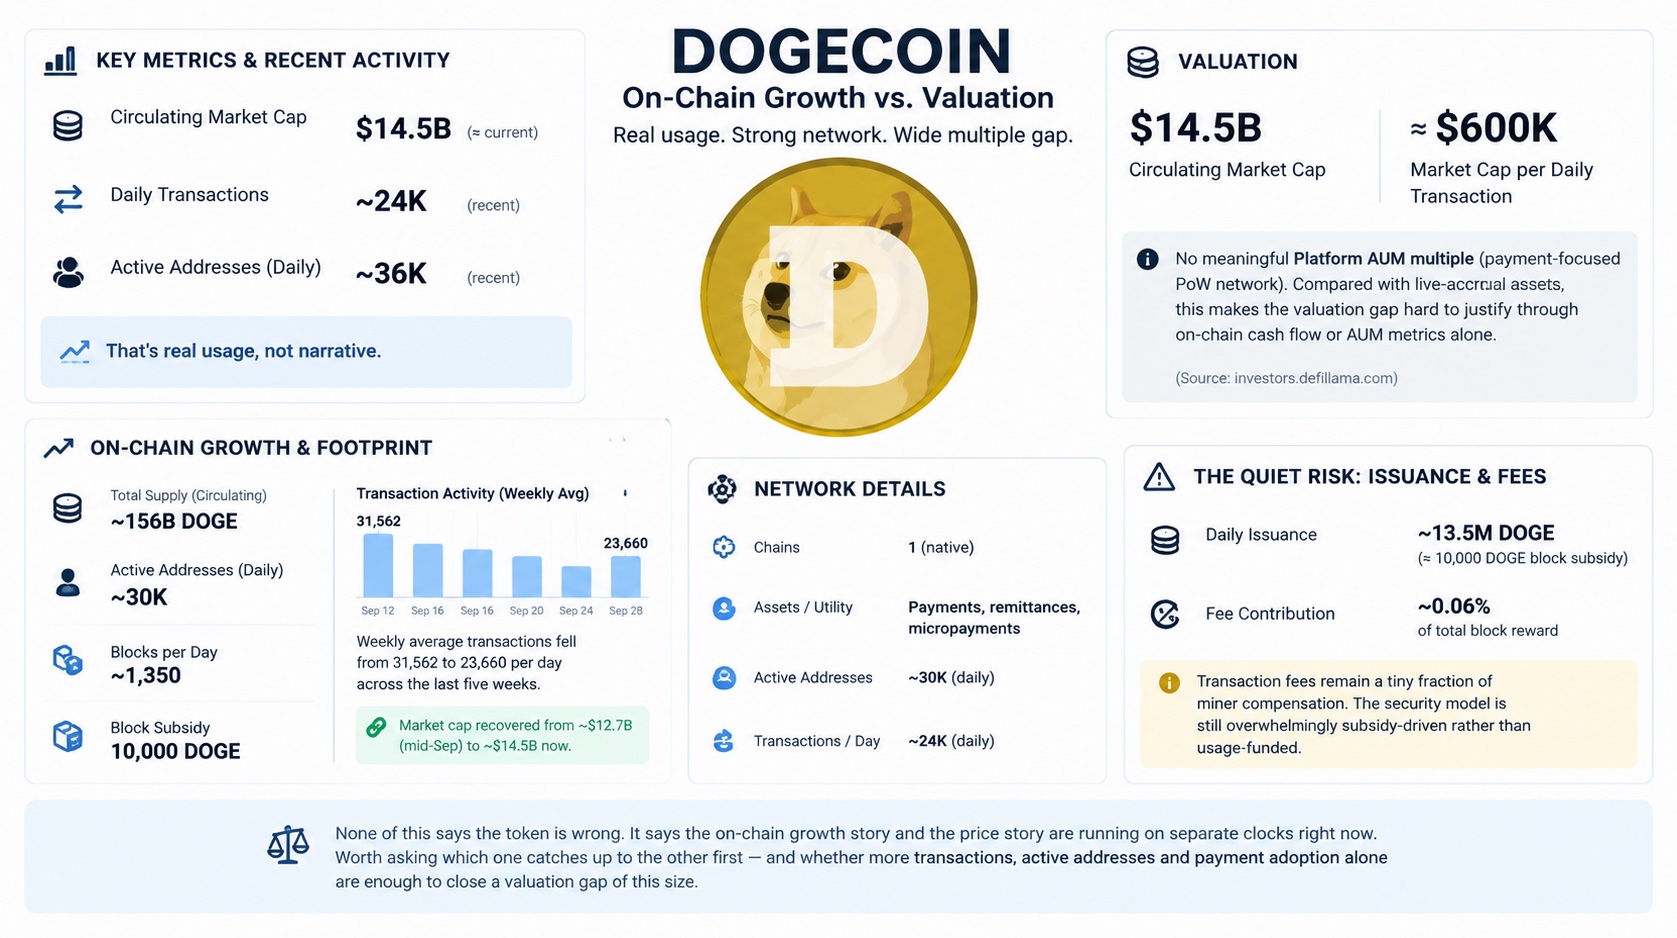
DOGE currently carries roughly a $14.5B circulating market cap, while recent on-chain activity has been closer to ~24K transactions/day and ~36K active addresses/day. That’s real usage, not narrative. But the valuation is the harder part. At ~$14.5B, DOGE is being valued at roughly $600K of market cap per daily transaction. There is no meaningful Platform AUM multiple for DOGE because it is a payment-focused PoW network rather than a yield/RWA platform; compared with live-accrual assets, that makes the valuation gap difficult to justify through on-chain cash-flow or AUM metrics alone. The footprint is still substantial: ~156B DOGE circulating, ~30K active addresses in the latest daily data, ~1,350 blocks per day, and a network that continues to secure itself through a 10,000 DOGE block subsidy. Yet transaction activity has been trending lower: the weekly average fell from 31,562 to 23,660 transactions/day across the recent five-week sequence, even as market cap recovered from roughly $12.7B in mid-September to ~$14.5B now. The quiet compression factor is issuance. Dogecoin adds roughly 13.5M DOGE per day, while transaction fees remain a tiny fraction of miner compensation. Recent data puts fee contribution at only around 0.06% of the total block reward, meaning the security model remains overwhelmingly subsidy-driven rather than usage-funded. None of this says the token is wrong. It says the on-chain growth story and the price story are running on separate clocks right now. Worth asking which one catches up to the other first — and whether more transactions, active addresses and payment adoption alone are enough to close a valuation gap of this size. $DOGEUSDT #ByXIMPACT
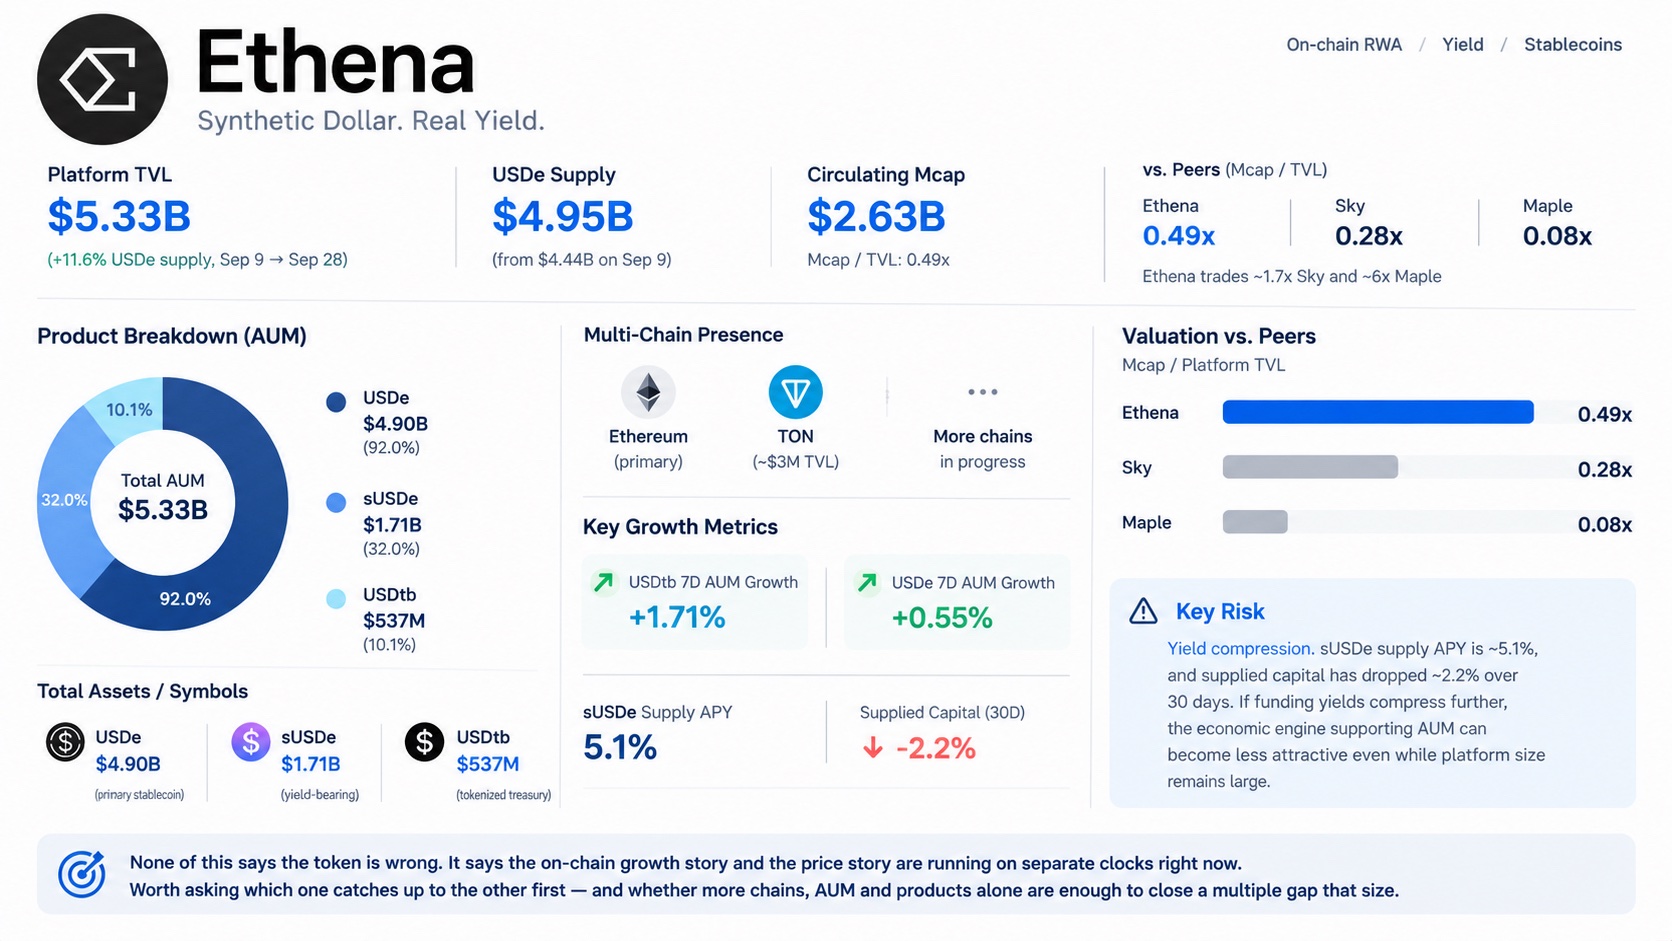
Ethena now carries $5.33B in platform TVL, while USDe supply has grown from $4.44B on September 9 to $4.95B on September 28 — roughly +11.6%. That’s real usage, not narrative. The valuation gap is more interesting. ENA’s circulating market cap is about $2.63B, putting Mcap/Platform TVL at ~0.49x. On the same lens, Sky sits near 0.28x and Maple around 0.08x — meaning ENA trades roughly 1.7x Sky’s and 6x Maple’s platform-value multiple. Underneath that multiple, the footprint is still expanding. USDe represents about $4.90B, sUSDe about $1.71B, and USDtb about $537M. USDtb’s 7-day AUM growth is currently +1.71%, while USDe is +0.55%; Ethena has also extended beyond Ethereum with a TON deployment, although that portion remains only about $3M today. The quieter issue is yield compression. sUSDe supply APY is around 5.1%, while supplied capital has fallen about 2.2% over 30 days. If funding yields compress further, the economic engine supporting that AUM can become less attractive even while the headline platform size remains large. None of this says the token is wrong. It says the on-chain growth story and the price story are running on separate clocks right now. Worth asking which one catches up to the other first — and whether more AUM, products and chains alone are enough to close a multiple gap that size. $ENAUSDT #ByXIMPACT
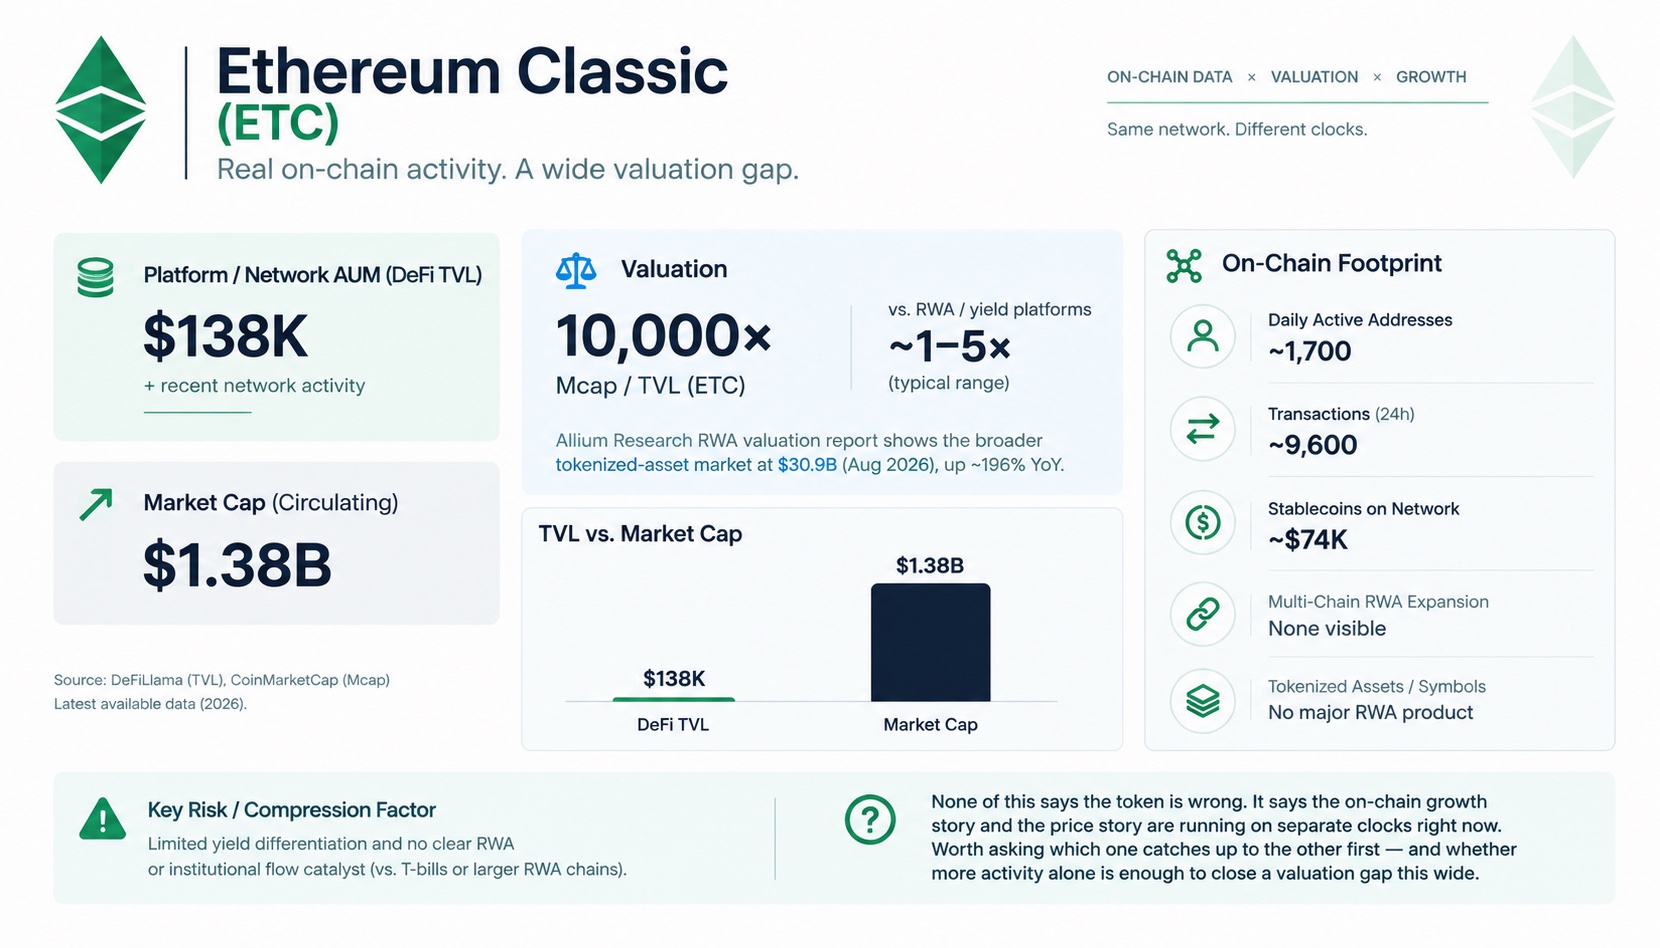
Ethereum Classic is carrying roughly $138K in DeFi TVL against a $1.38B circulating market cap. That’s real network activity, but not the kind of on-chain business growth usually associated with RWA or yield-platform repricing. The valuation gap is the interesting part: ETC trades at roughly 10,000× its on-chain DeFi TVL, while Allium’s RWA work shows the broader tokenized-asset market at $30.9B as of August 2026, up ~196% YoY. ETC has no comparable RWA AUM base to anchor a platform-style valuation multiple. The footprint is also relatively narrow. Current data shows about 1,700 daily active addresses, ~9,600 transactions and only ~$74K of stablecoins on Ethereum Classic. There is no visible multi-chain RWA expansion or billion-dollar tokenized-product milestone comparable with the networks now capturing institutional asset flows. None of this says the token is wrong. It says the on-chain growth story and the price story are running on separate clocks right now. Worth asking which one catches up to the other first — and whether more activity alone is enough to close a valuation gap this wide. $ETCUSDT #ByXIMPACT
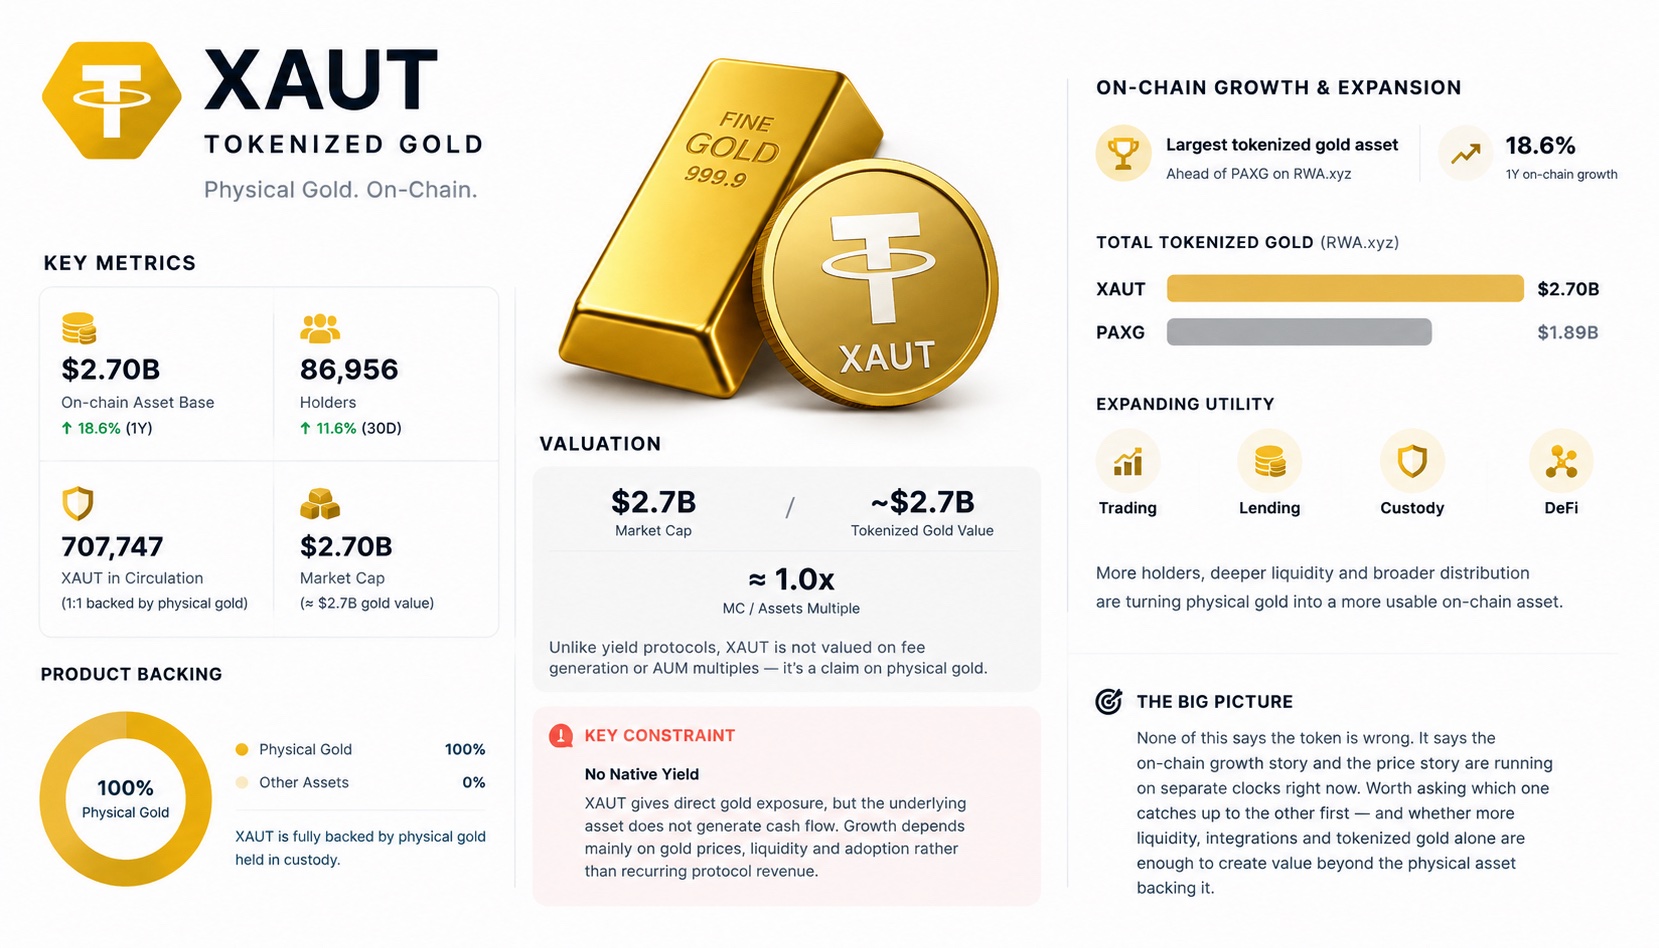
XAUT now represents roughly $2.70B of tokenized gold, with its on-chain asset base up 18.6% over the past year. That’s real usage, not narrative. The valuation is straightforward: XAUT’s circulating market cap sits around $2.7B against roughly $2.7B in tokenized gold value — close to a 1.0x market-cap-to-assets multiple. That is very different from RWA platforms where the token trades at a premium to productive AUM and future fee generation. The on-chain footprint continues to expand. XAUT remains the largest tokenized gold asset, ahead of PAXG, while adoption is spreading across trading, custody and DeFi infrastructure. More holders, deeper liquidity and broader distribution are turning physical gold into a more usable on-chain asset. The quiet constraint is yield. XAUT gives direct gold exposure, but the underlying asset does not generate native cash flow. That means growth depends mainly on gold prices, liquidity and adoption rather than recurring protocol revenue. None of this says the token is wrong. It says the on-chain growth story and the price story are running on separate clocks right now. Worth asking which one catches up to the other first — and whether more liquidity, integrations and tokenized gold alone are enough to create value beyond the physical asset backing it. $XAUTUSDT #ByXIMPACT
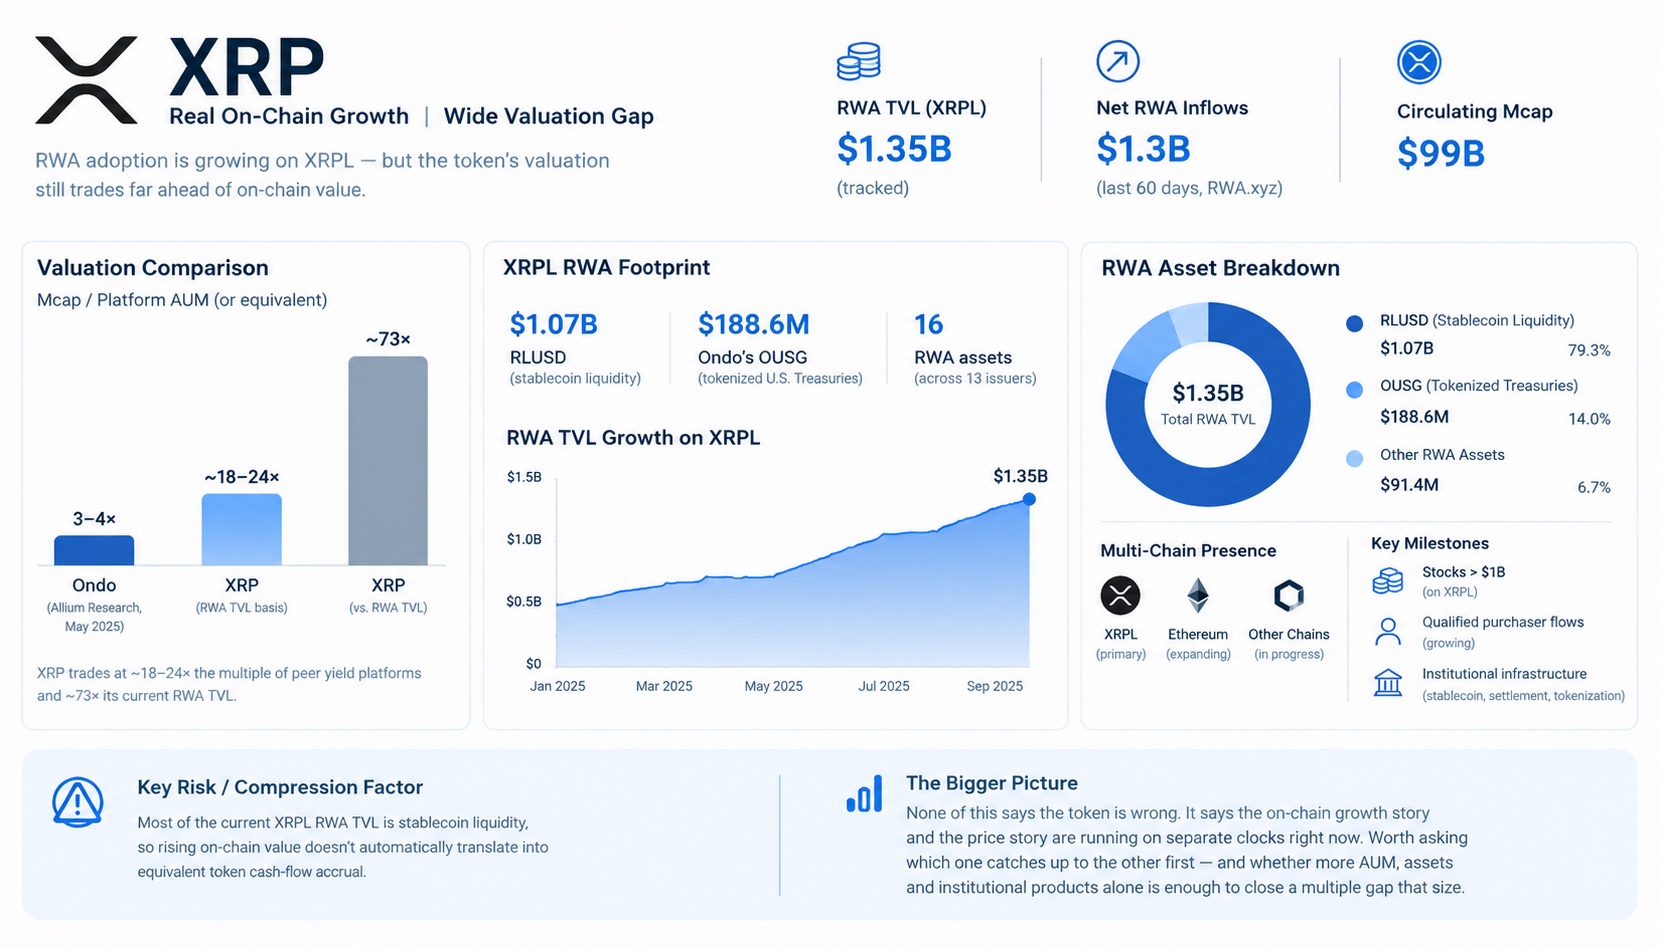
XRP Ledger currently has about $1.35B in tracked RWA TVL, while RWA.xyz reported roughly $1.3B of net RWA inflows over the prior 60 days. That’s real usage, not narrative. The disconnect is valuation. XRP’s circulating market cap is about $99B, putting the token at roughly 73× XRPL’s current RWA TVL. For context, Allium’s May valuation work put Ondo at about 3–4× platform AUM, already a premium to live-accrual yield-platform peers. On this simplified RWA-value basis, XRP trades at roughly 18–24× that multiple — although the comparison is not apples-to-apples because XRP is a network asset, not a direct claim on XRPL’s RWA assets. The underlying footprint is still expanding. XRPL now shows about $1.07B of RLUSD, $188.6M of Ondo’s OUSG, and 16 tracked RWA assets across 13 issuers. Earlier in 2026, RWA.xyz data showed XRPL adding more than $1.3B in RWA value in just two months, while Ripple has continued building tokenization, stablecoin and institutional settlement infrastructure around the ledger. The quieter issue is composition: most current XRPL RWA TVL is stablecoin liquidity rather than fee-generating yield products, so rising on-chain value does not automatically translate into equivalent token cash-flow accrual. None of this says the token is wrong. It says the on-chain growth story and the price story are running on separate clocks right now. Worth asking which one catches up to the other first — and whether more AUM, assets and institutional products alone is enough to close a multiple gap that size. $XRPUSDT #ByXIMPACT
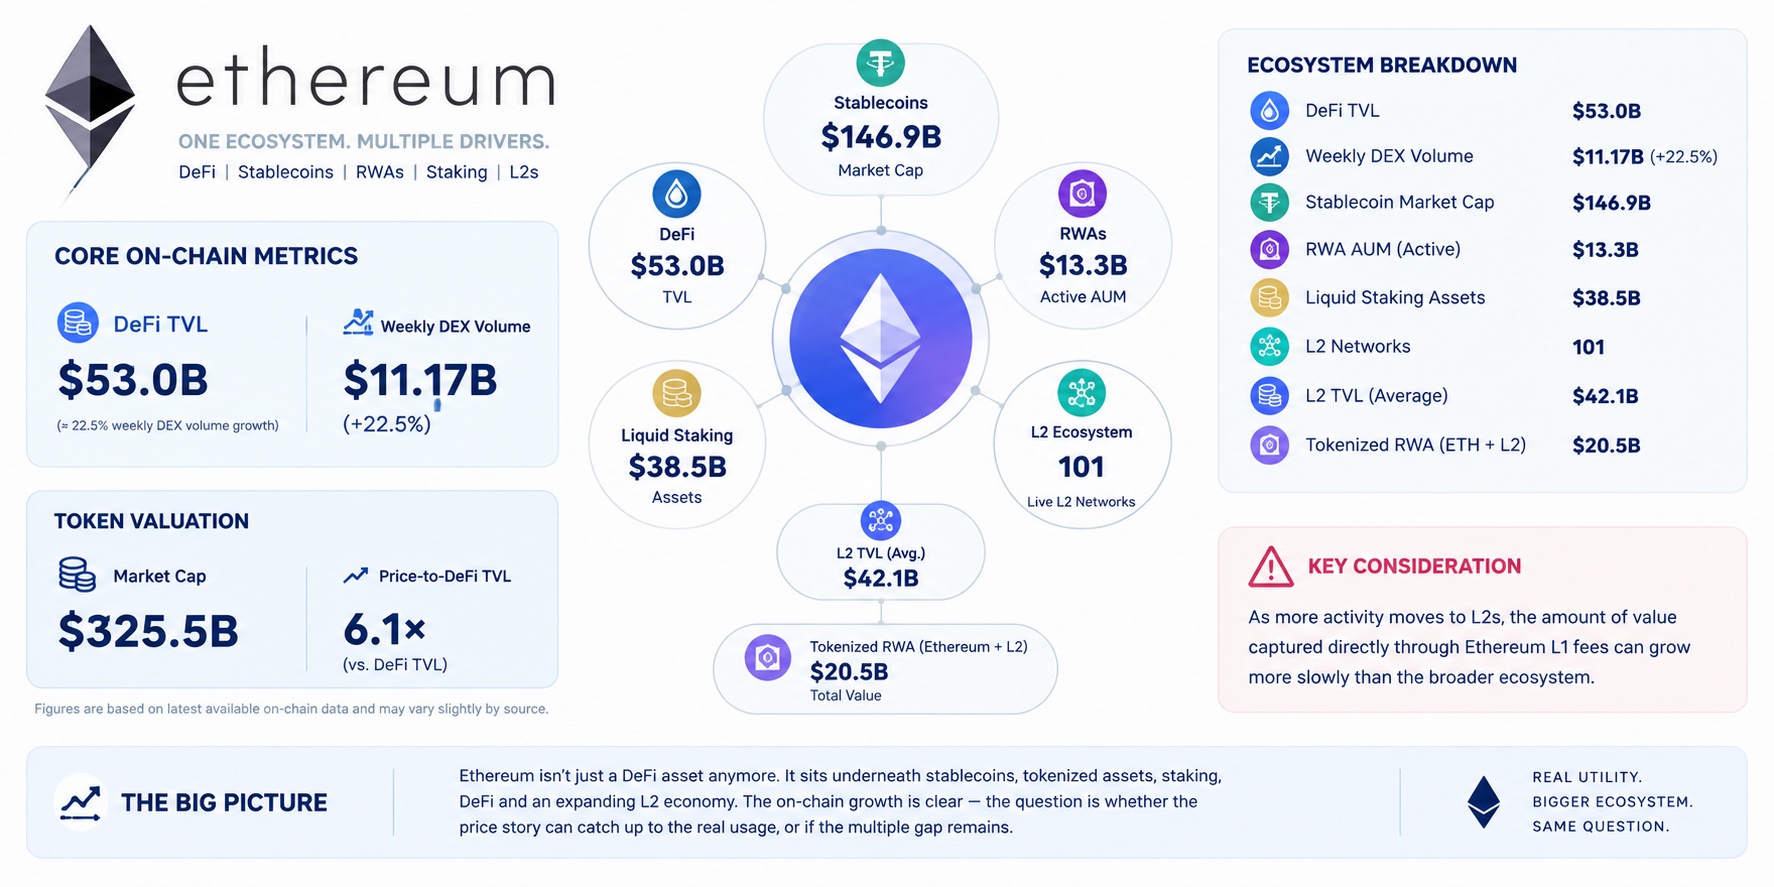
Ethereum’s on-chain economy is currently securing about $53.0B in DeFi TVL, with weekly DEX volume reaching $11.17B, up 22.5%. That’s real usage, not narrative. ETH’s market cap is around $325.5B, putting the token at roughly 6.1× DeFi TVL. The more important point is that Ethereum’s valuation is being supported by a much broader economic footprint than DeFi alone. The network now carries about $146.9B in stablecoin market cap, around $13.3B in active RWA AUM, and roughly $38.5B in liquid-staking assets. Ethereum’s official data hub also tracks approximately $20.5B of RWAs across Ethereum and its L2 ecosystem, with 101 live L2 networks and about $42.1B in average L2 TVL. That creates an interesting valuation gap: ETH is no longer simply a DeFi asset. It sits underneath stablecoins, tokenized assets, staking, DeFi and an expanding L2 economy. But as activity moves toward cheaper L2 execution, the amount of value captured directly through Ethereum L1 fees can grow more slowly than the broader ecosystem. The quiet risk is therefore value capture rather than usage. The ecosystem can continue expanding while ETH’s direct fee economics remain under pressure. None of this says the token is wrong. It says the on-chain growth story and the price story are running on separate clocks right now. Worth asking which one catches up to the other first — and whether more TVL, stablecoins, RWAs and L2 activity alone is enough to close that gap. $ETHUSDT #ByXIMPACT
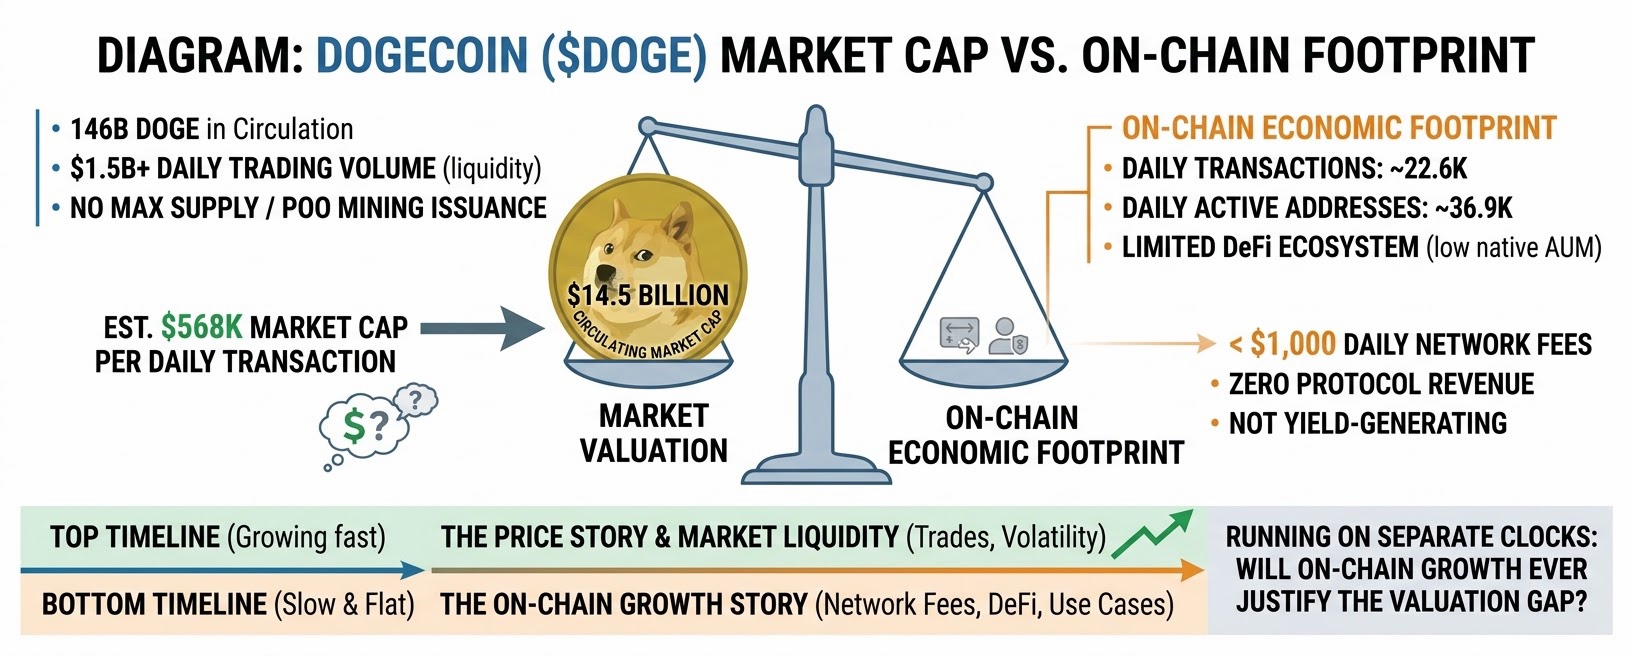
DOGE currently carries roughly a $14.5B circulating market cap, with about 156B DOGE in circulation. The network is still processing tens of thousands of daily transactions and active addresses, but the measurable on-chain economic footprint remains small relative to the valuation. That’s real usage, not narrative. But the valuation is where the gap becomes difficult to ignore. Dogecoin’s current market cap is roughly $14.5B, while the chain’s direct DeFi footprint remains extremely limited. DeFiLlama tracks DOGE primarily as a chain/token rather than as a yield-generating platform, with no comparable native AUM base against which to justify a platform-style multiple. The more useful comparison is the scale of activity supporting that valuation. The latest detailed weekly network data showed around 22.6K daily transactions and 36.9K daily active addresses on September 13, while the market cap was about $12.9B at the time. That translated to roughly $568K of market capitalization per daily transaction. There is also a meaningful economic distinction here. DOGE generates network fees, but the latest tracker data shows only around $823 of 24-hour fees and essentially zero protocol revenue. At the same time, DOGE trades over $1.5B in daily volume, showing that the majority of economic activity around the asset is market liquidity rather than recurring protocol cash flow. The quiet compression factor is supply. Dogecoin has no maximum supply, and new DOGE continues to enter circulation through PoW mining. That means the network needs sustained demand growth just to offset ongoing issuance rather than relying on scarcity mechanics. None of this says the token is wrong. It says the on-chain growth story and the price story are running on separate clocks right now. Worth asking which one catches up to the other first — and whether more transactions, addresses and liquidity alone are enough to close a valuation gap this large. $DOGEUSDT #ByXIMPACT
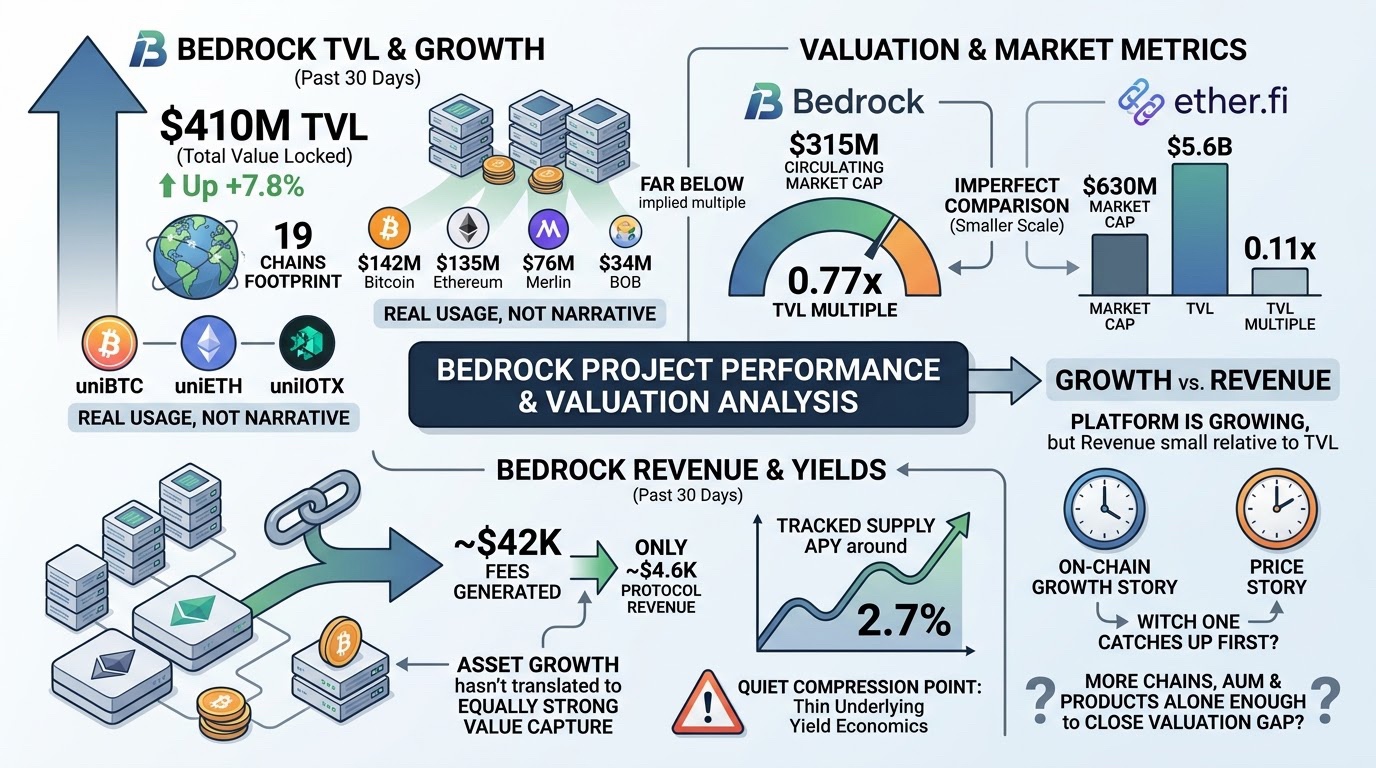
Bedrock now sits at roughly $410M in TVL, up 7.8% over the past 30 days across 19 chains. That’s real usage, not narrative. At around $315M circulating market cap, BR trades at roughly 0.77x TVL. That is far below the multiple implied by larger live-accrual yield platforms like ether.fi, where roughly $630M market cap sits against $5.6B TVL (~0.11x), while Bedrock’s smaller scale makes the comparison imperfect. The footprint is becoming harder to ignore: $142M on Bitcoin, $135M on Ethereum, $76M on Merlin and $34M on BOB, with uniBTC, uniETH and uniIOTX forming the core product stack. Bedrock also generated about $42K in fees over the last 30 days, although only ~$4.6K was protocol revenue, showing that asset growth has not yet translated into equally strong value capture. That is the quiet compression point: the platform is growing, but the underlying yield economics remain thin, with tracked supply APY around 2.7% and revenue still small relative to TVL. None of this says the token is wrong. It says the on-chain growth story and the price story are running on separate clocks right now. Worth asking which one catches up to the other first — and whether more chains, AUM and products alone are enough to close a valuation gap that size. $BRUSDT #ByXIMPACT
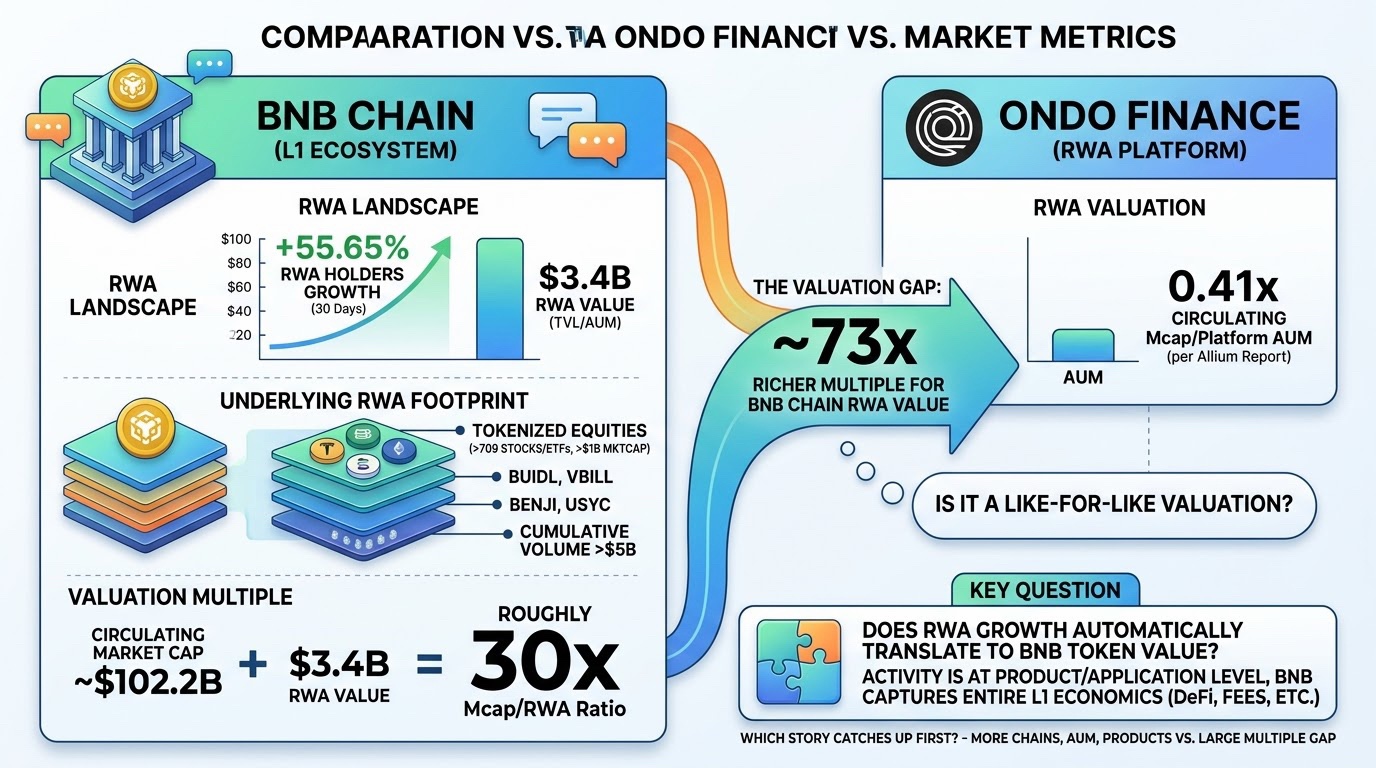
BNB Chain currently reports $3.4B in RWA value, while RWA holders had grown 55.65% over the prior 30 days. That’s real usage, not narrative. Then comes the valuation gap. BNB’s circulating market cap is about $102.2B, against $3.4B of RWA value — roughly 30x. By comparison, Allium’s latest Ondo report put ONDO at 0.41x circulating Mcap/Platform AUM, meaning BNB’s RWA-value multiple is roughly 73x richer. That is not a like-for-like valuation, because BNB captures the economics of an entire L1, but the gap is still difficult to ignore. The underlying footprint is expanding. BNB Chain has moved from roughly $3.8B of distributed RWA value in April to $3.4B currently, while tokenized equities have scaled to 709+ stocks and ETFs, with cumulative volume above $5B and tokenized-stock market cap above $1B. The chain also carries BUIDL, VBILL, BENJI, USYC and tokenized equity products across its RWA stack. The quieter issue is that RWA growth does not automatically translate into BNB token value at the same rate. Much of the underlying activity is product- and application-level, while BNB’s valuation reflects the entire network, including DeFi, stablecoins, fees and future usage. None of this says the token is wrong. It says the on-chain growth story and the price story are running on separate clocks right now. Worth asking which one catches up to the other first — and whether more chains, AUM and products alone are enough to close a multiple gap that size. $BNBUSDT #ByXIMPACT