BULLISH
𝕏: @EricLedger0 I trade with patience, not emotions. Focused on high-probability setups, risk management, and consistent execution. Sharing my market views and
TRUMP JUST SAID CONSUMER CONFIDENCE IS UP 7.5% AND CALLED IT AN EXTREMELY BIG RISE. CONFERENCE BOARD INDEX JUMPED 7.5 POINTS TO 91.7 IN OCTOBER. FIRST RISE IN FOUR MONTHS. CRUSHED FORECASTS. HIGHEST SINCE JUNE. #ByXIMPACT

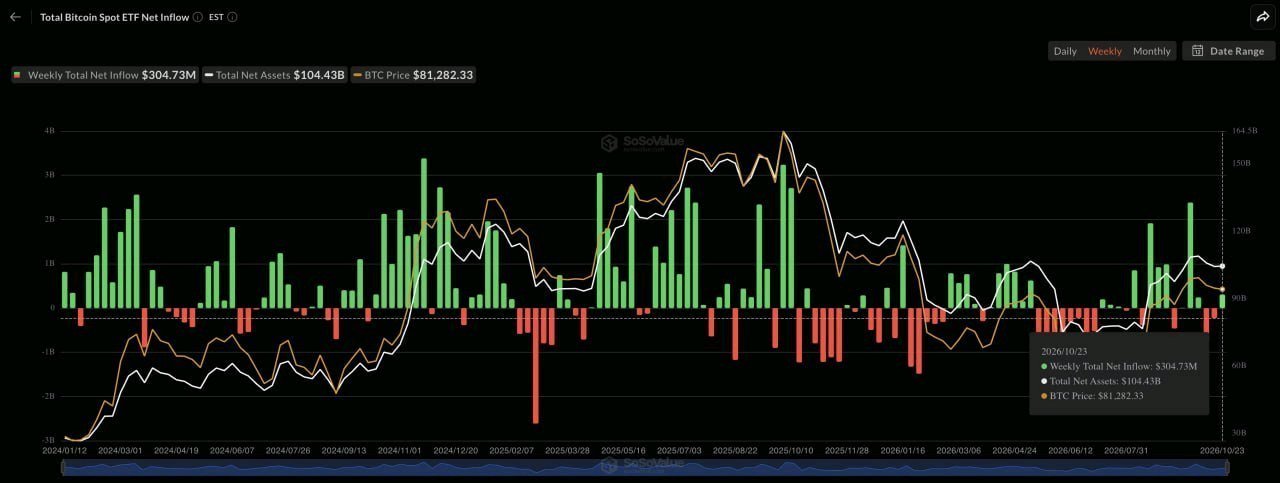
🚨 BITCOIN IS ATTRACTING SERIOUS INSTITUTIONAL ATTENTION! 🇺🇸 US Spot Bitcoin ETFs recorded an impressive $304.73 million in net inflows last week, showing that institutional interest in Bitcoin remains alive and strong. This is more than just another market statistic. It reflects growing confidence from investors who are choosing to gain exposure to Bitcoin through regulated investment products. While short-term market movements can create uncertainty, fresh capital entering Bitcoin ETFs could provide another layer of support for the market. The big question now is whether this buying pressure can continue and help push Bitcoin toward its next major move. 👀 Institutional money is flowing in. Is Bitcoin preparing for another powerful rally? #ByXIMPACT $BTCUSDT
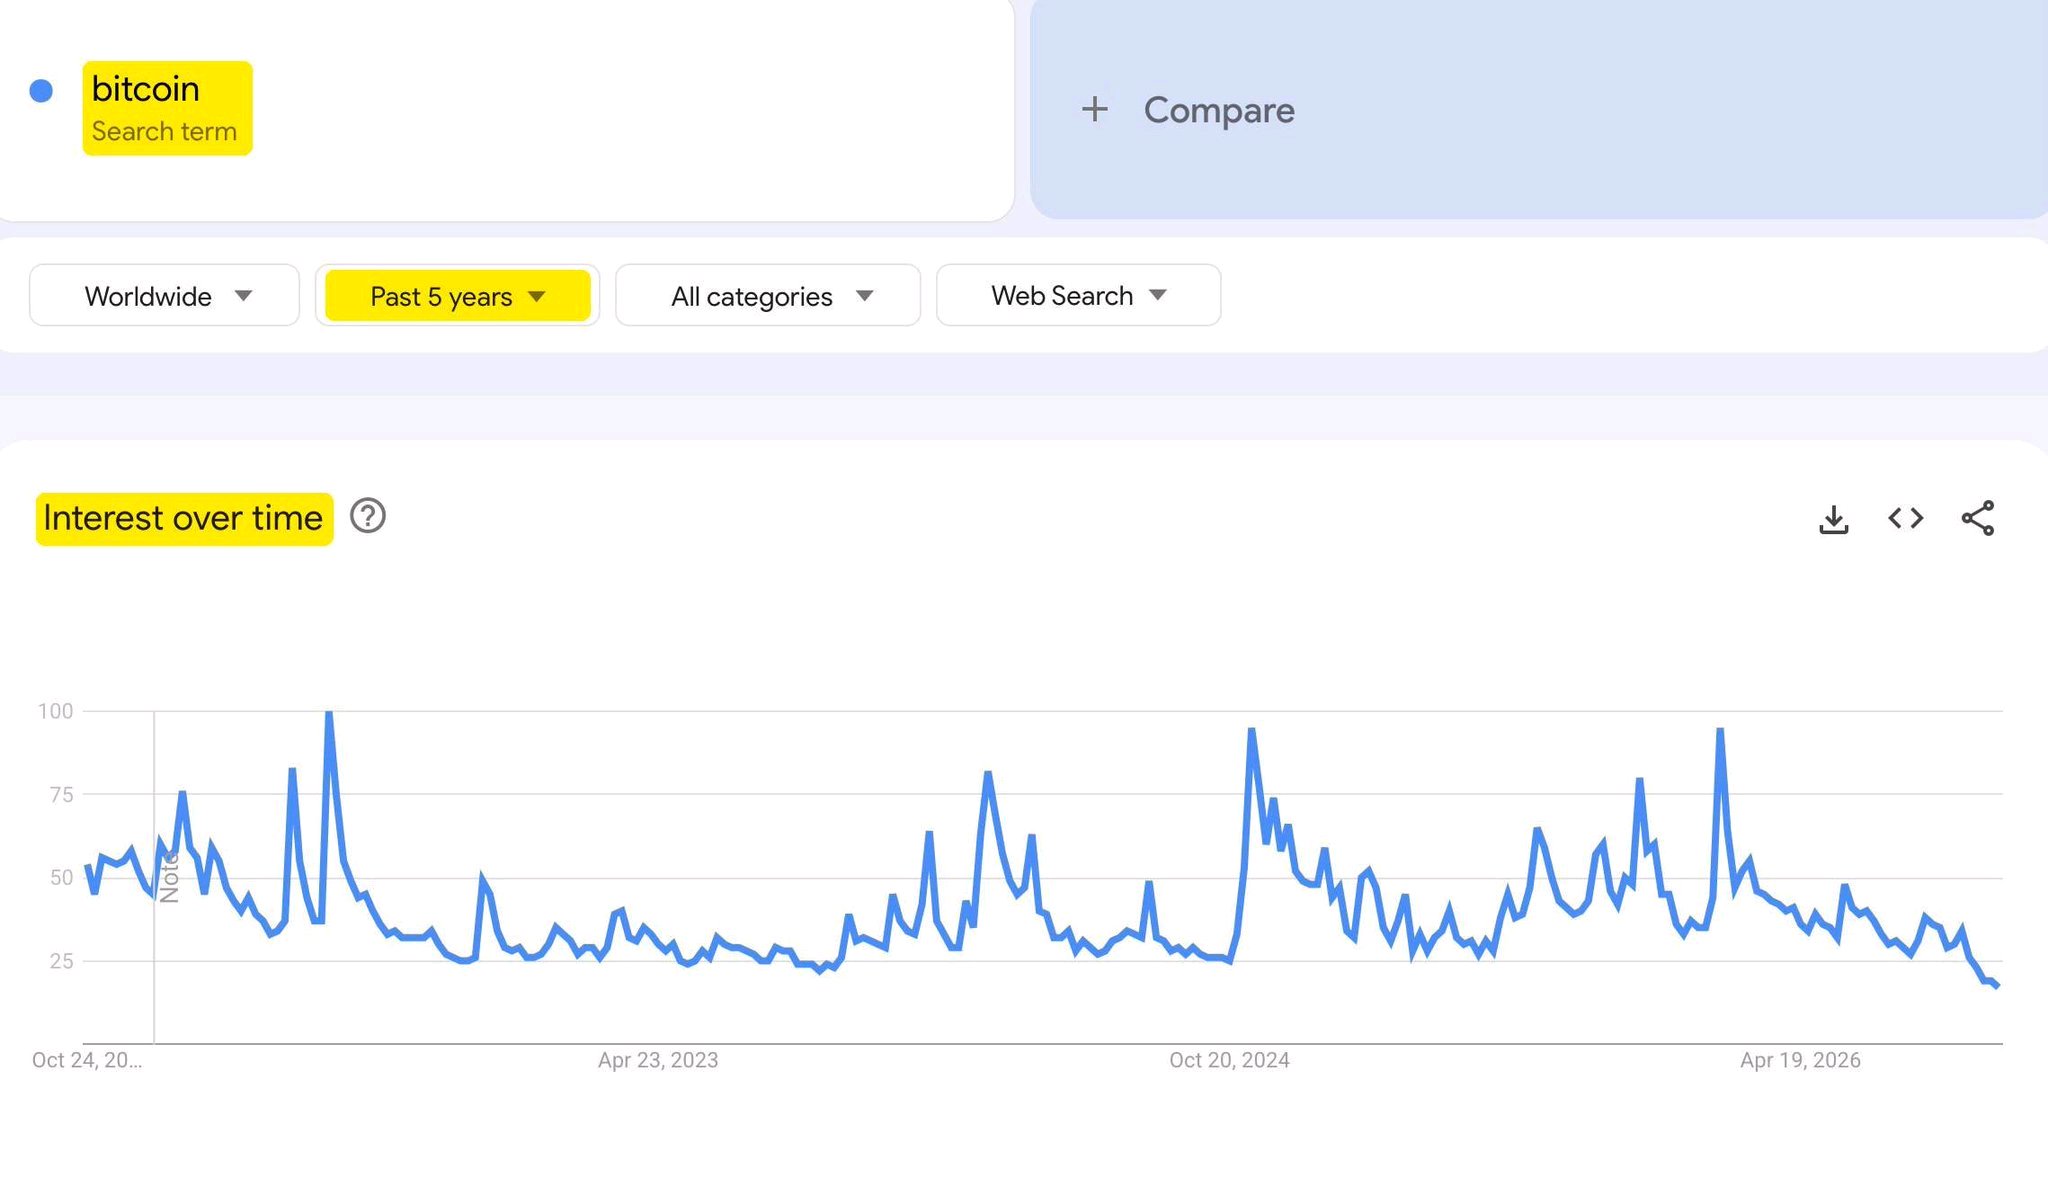
🚨 BITCOIN GOOGLE SEARCHES AT ALL-TIME LOWS 📉💰
#ByXIMPACT
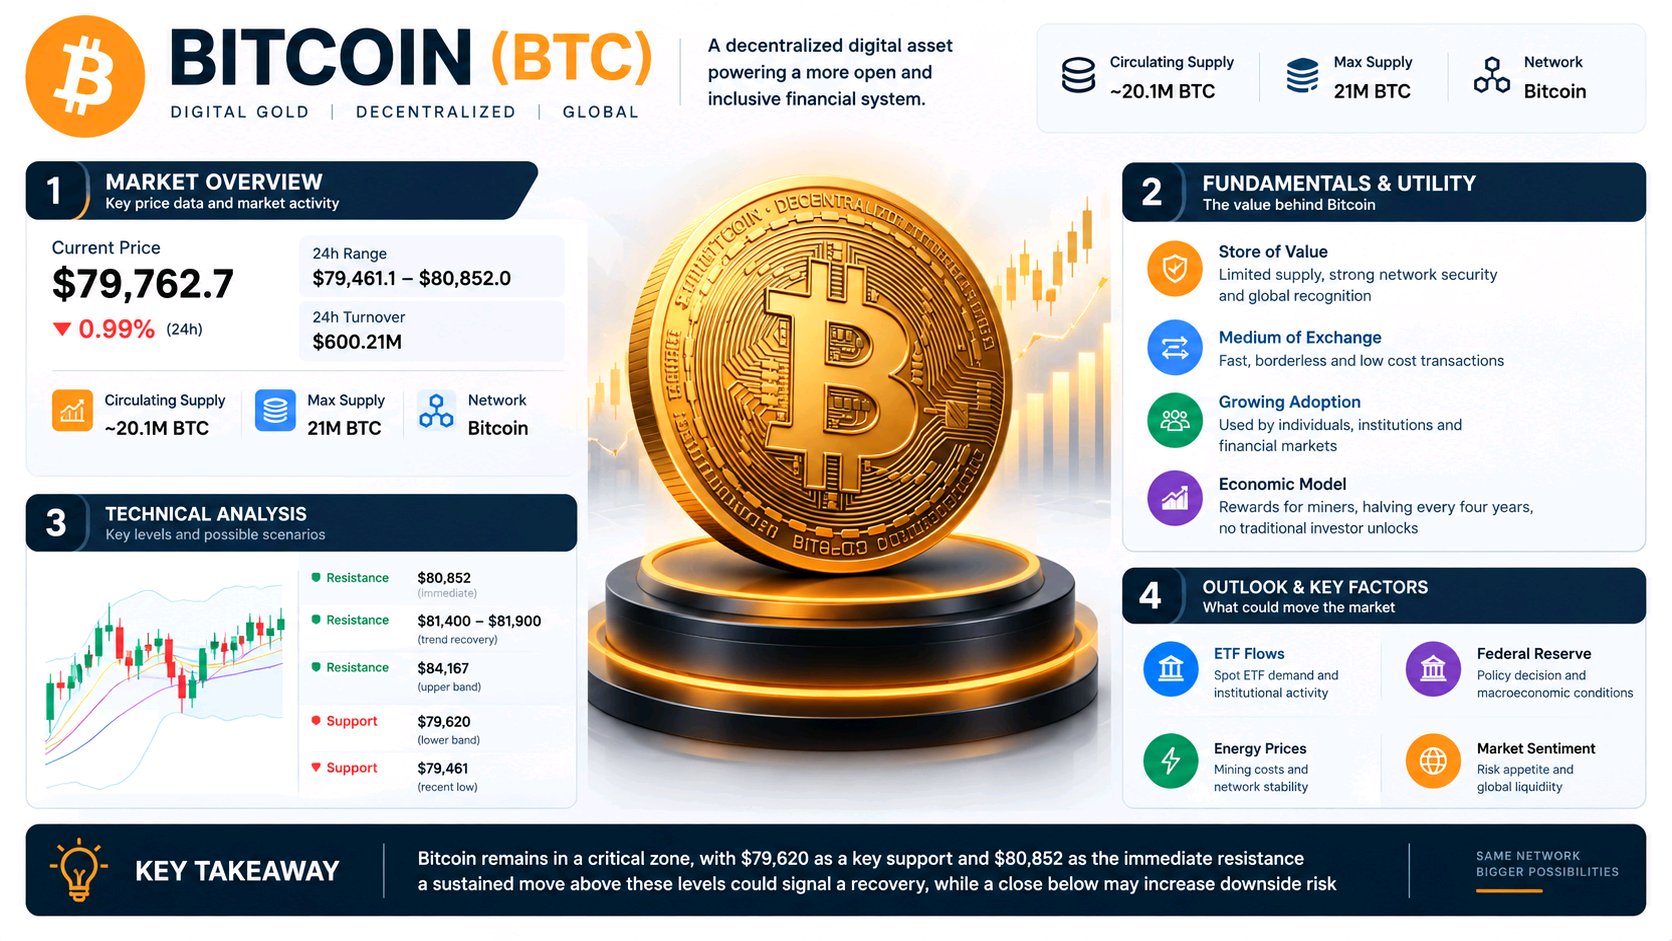
BTCUSDT is trading near $79,762.7, down 0.99% in the displayed market snapshot, with a 24-hour range between $79,461.1 and $80,852.0 and reported turnover of approximately 600.21 million USDT on the displayed market. Bitcoin has a maximum supply of 21 million BTC, with approximately 20.1 million already circulating, leaving a limited amount of new issuance ahead. Its economic model relies on decentralized settlement, predictable monetary issuance, network security, and demand from individuals, institutions, and financial markets rather than a conventional company revenue model What makes this price zone important is the growing distance between Bitcoin's current market price and its short term trend indicators. On the supplied daily chart, the seven day exponential moving average stands near $80,753.4, while the fourteen day and twenty eight day averages sit around $81,432.7 and $81,791.2 respectively. Price remains below all three averages, suggesting that sellers currently have the advantage and buyers have yet to establish a convincing recovery. The Bollinger Bands show a middle level near $81,893.8, an upper boundary around $84,167.3, and a lower boundary close to $79,620.3, placing Bitcoin near the bottom of its immediate volatility range Bitcoin's fundamental case remains connected to scarcity and adoption, but neither guarantees rising prices. New coins enter circulation through mining rewards, which decline by half approximately every four years. The current block subsidy is 3.125 BTC, and the next scheduled halving is expected around 2028. Unlike tokens with investor unlock calendars, Bitcoin has no conventional venture investor allocation schedule or routine project token unlock event. Its changing supply instead follows the protocol's issuance rules, while market demand depends on liquidity, investor confidence, transaction utility, and broader financial conditions The immediate market backdrop adds another layer of uncertainty. Recent reporting has highlighted pressure around the $80,000 level, fluctuating spot Bitcoin ETF flows, rising energy prices, and expectations surrounding the Federal Reserve's October policy decision. These factors can influence risk appetite and institutional demand, although their eventual impact on price remains uncertain. The upcoming policy announcement and changing capital flows could therefore matter as much as the chart itself over the next several daily sessions The levels now deserve closer attention than any unsupported prediction. A sustained daily close above $80,852 would indicate that buyers are challenging the immediate resistance zone, while a stronger recovery above $81,400 to $81,900 would help Bitcoin reclaim its nearby trend indicators. A move toward $84,167 would require further confirmation rather than an assumption of automatic continuation. On the downside, $79,620 represents the displayed lower Bollinger Band, followed by the recent daily low near $79,461.1. A decisive close below this area would weaken the recovery case and increase attention on lower support zones, which require additional chart confirmation The next several daily closes will help determine whether Bitcoin can stabilize or whether selling pressure continues to dominate. Holding the current range and reclaiming short term averages would improve the recovery outlook, whereas repeated rejection below resistance could leave the market vulnerable to another decline. The key question is whether buyers can convert the $79,000 to $80,000 area into a durable base rather than merely slowing the fall. This outlook remains conditional on price confirmation, liquidity, and broader market developments, with the bullish case weakened by sustained acceptance below $79,461.1 $BTCUSDT
Ethereum is approaching a critical moment, and the pressure is getting harder to ignore. ETH sliding toward $2,300 is more than just another market dip. ETF outflows are weakening confidence, early investors appear to be taking profits, and bearish technical signals are adding fuel to the uncertainty. Now comes the real test: will buyers step in to defend $2,300, or will sellers turn this level into the starting point of a deeper correction? One strong bounce could change the mood. A decisive breakdown could shake market confidence even further. Ethereum is at a crossroads. The next move could speak louder than the current fear. Eyes on $2,300. The market is watching, and the next move matters. $ETHUSDT

Crypto market right now 😎

ANTHROPIC’S BIGGEST MOMENT JUST TURNED INTO A CORPORATE NIGHTMARE. On the very same day Anthropic reportedly filed for a historic trillion-dollar IPO, the FTC demanded testimony from its executives as scrutiny over consumer harm and AI safety intensified. The timing is explosive. A company chasing one of the biggest public market debuts in history is suddenly facing serious questions about the risks surrounding its technology. Investors want growth. Regulators want answers. And the public wants to know whether AI companies can move fast without putting consumers at risk. One day. Two massive developments. And a billion-dollar question hanging over the AI industry: Can Anthropic convince Wall Street of its future while regulators investigate the risks of its present? The spotlight is no longer just on how powerful AI can become. It is on who will be held accountable when things go wrong. The AI race is entering a new phase, where regulatory pressure could become just as important as technological breakthroughs. #ByXIMPACT


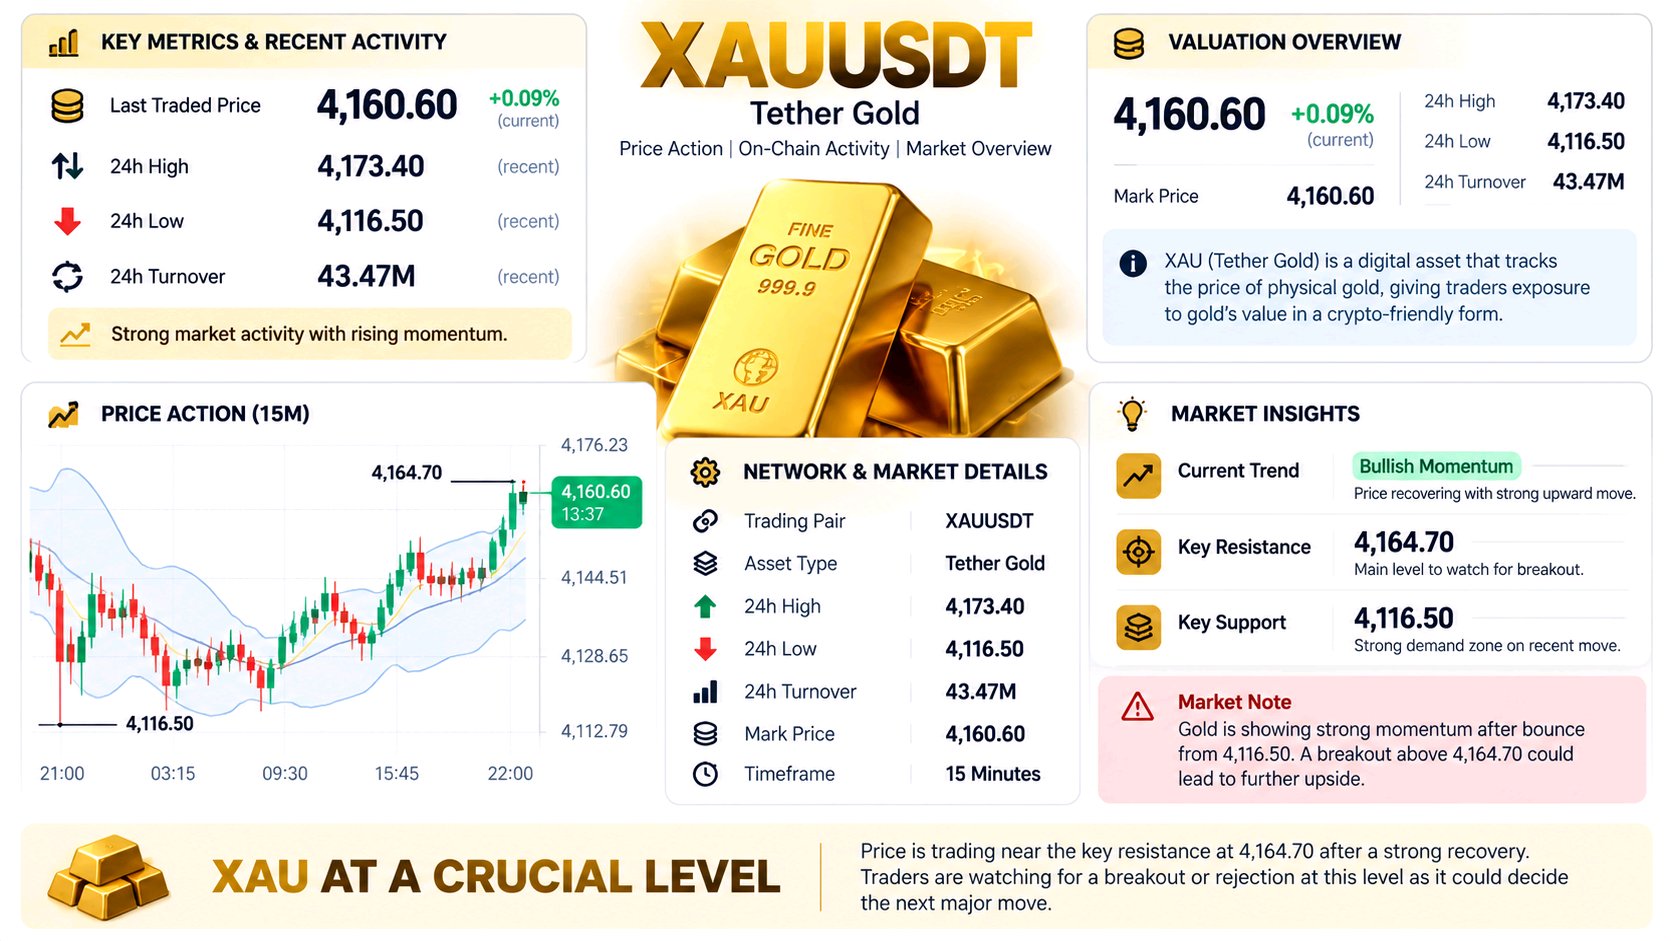
🚨 GOLD IS HEATING UP — 4,160 IS THE BATTLEFIELD
XAUT is moving aggressively higher, climbing back toward 4,164.70 after recovering from the earlier weakness. The candles are showing strong momentum, and price is now sitting near the upper side of the recent range. The interesting part? 4,164.70 is right in front of price. A clean push through this level could make the next move extremely interesting. But if buyers fail here, a quick pullback could come just as fast. Right now, everyone is watching the same thing: Will GOLD break 4,164.70… or get rejected again? The next few candles could tell the story. ⚡🔥🚀 #ByXIMPACT $XAUTUSDT
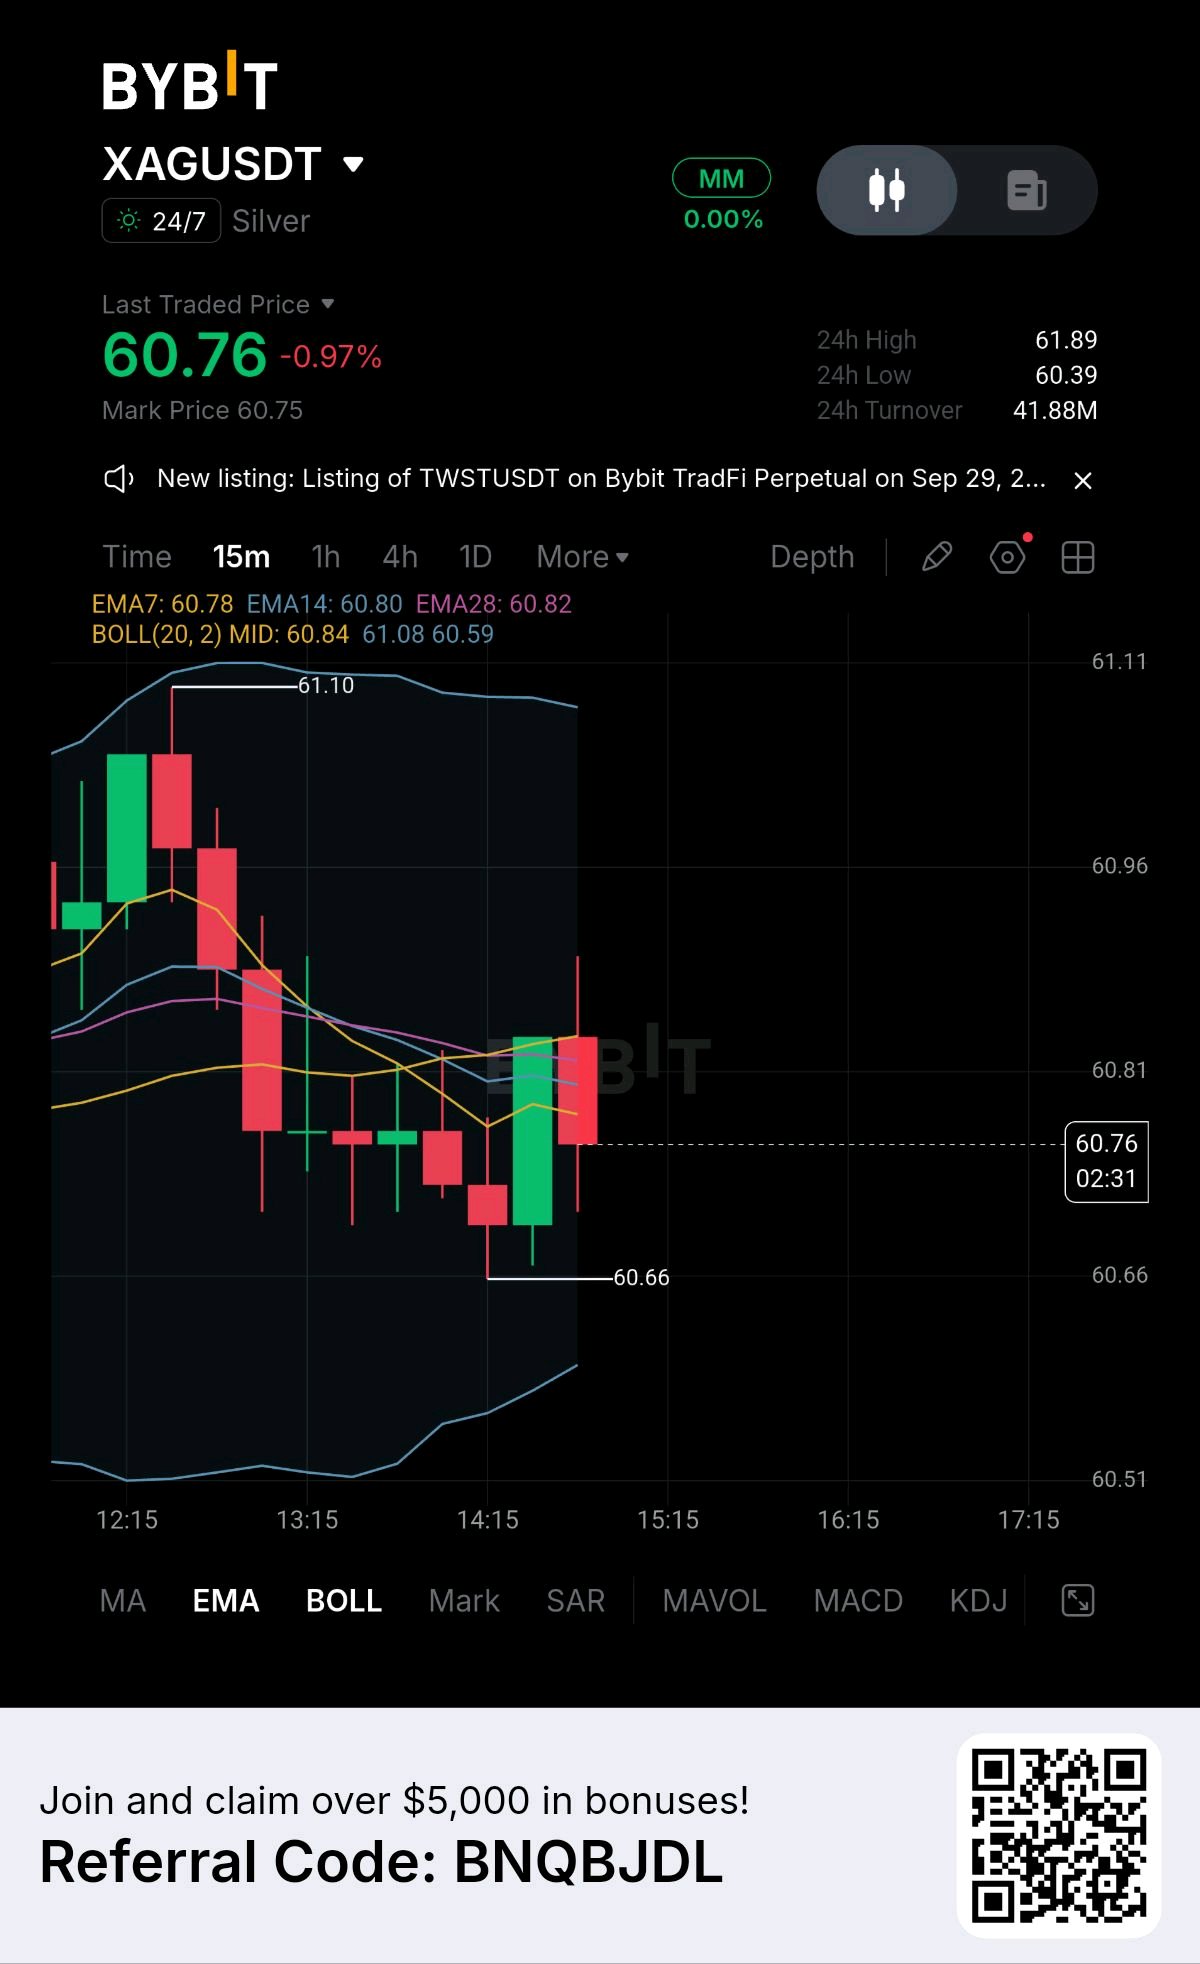
$XAG Tests Key Support as Sellers Step In
$XAG, traders, this setup is sitting at a critical short-term decision area. Price is around $60.76 after rejecting the $60.82–$60.84 area, while EMA7, EMA14 and EMA28 remain above price. The latest candle structure still shows sellers defending the recovery, so I’m watching for downside continuation if $60.66 gives way. 📌 Current Price: $60.76 📊 24H Change: -0.97% ▣ 24H High: $61.89 ⌁ 24H Low: $60.39 ◈ 24H Turnover: $41.88M 🔴 Short Entry Zone: $60.76 – $60.84 ⟡ TP1: $60.66 ◈ TP2: $60.59 ⚡︎ TP3: $60.39 🛡️ Stop Loss: $61.10 The entry zone matters because $60.81–$60.84 is where the recent recovery met resistance, with the EMA cluster also sitting overhead. A failure to reclaim this area keeps the short-term structure under pressure. $60.66 is the immediate local support. Below it, the lower Bollinger area near $60.59 becomes the next level to watch, while $60.39 represents the visible 24H low and deeper downside reference. Resistance: $60.84 / $61.08–$61.10 Support: $60.66 / $60.59 / $60.39 The rising open interest alongside positive funding and a high long-position ratio also makes the next price reaction important. I’d want confirmation below support rather than chasing the move. Keep $60.66 on your radar — that reaction could decide whether sellers gain further control. #ByXIMPACT

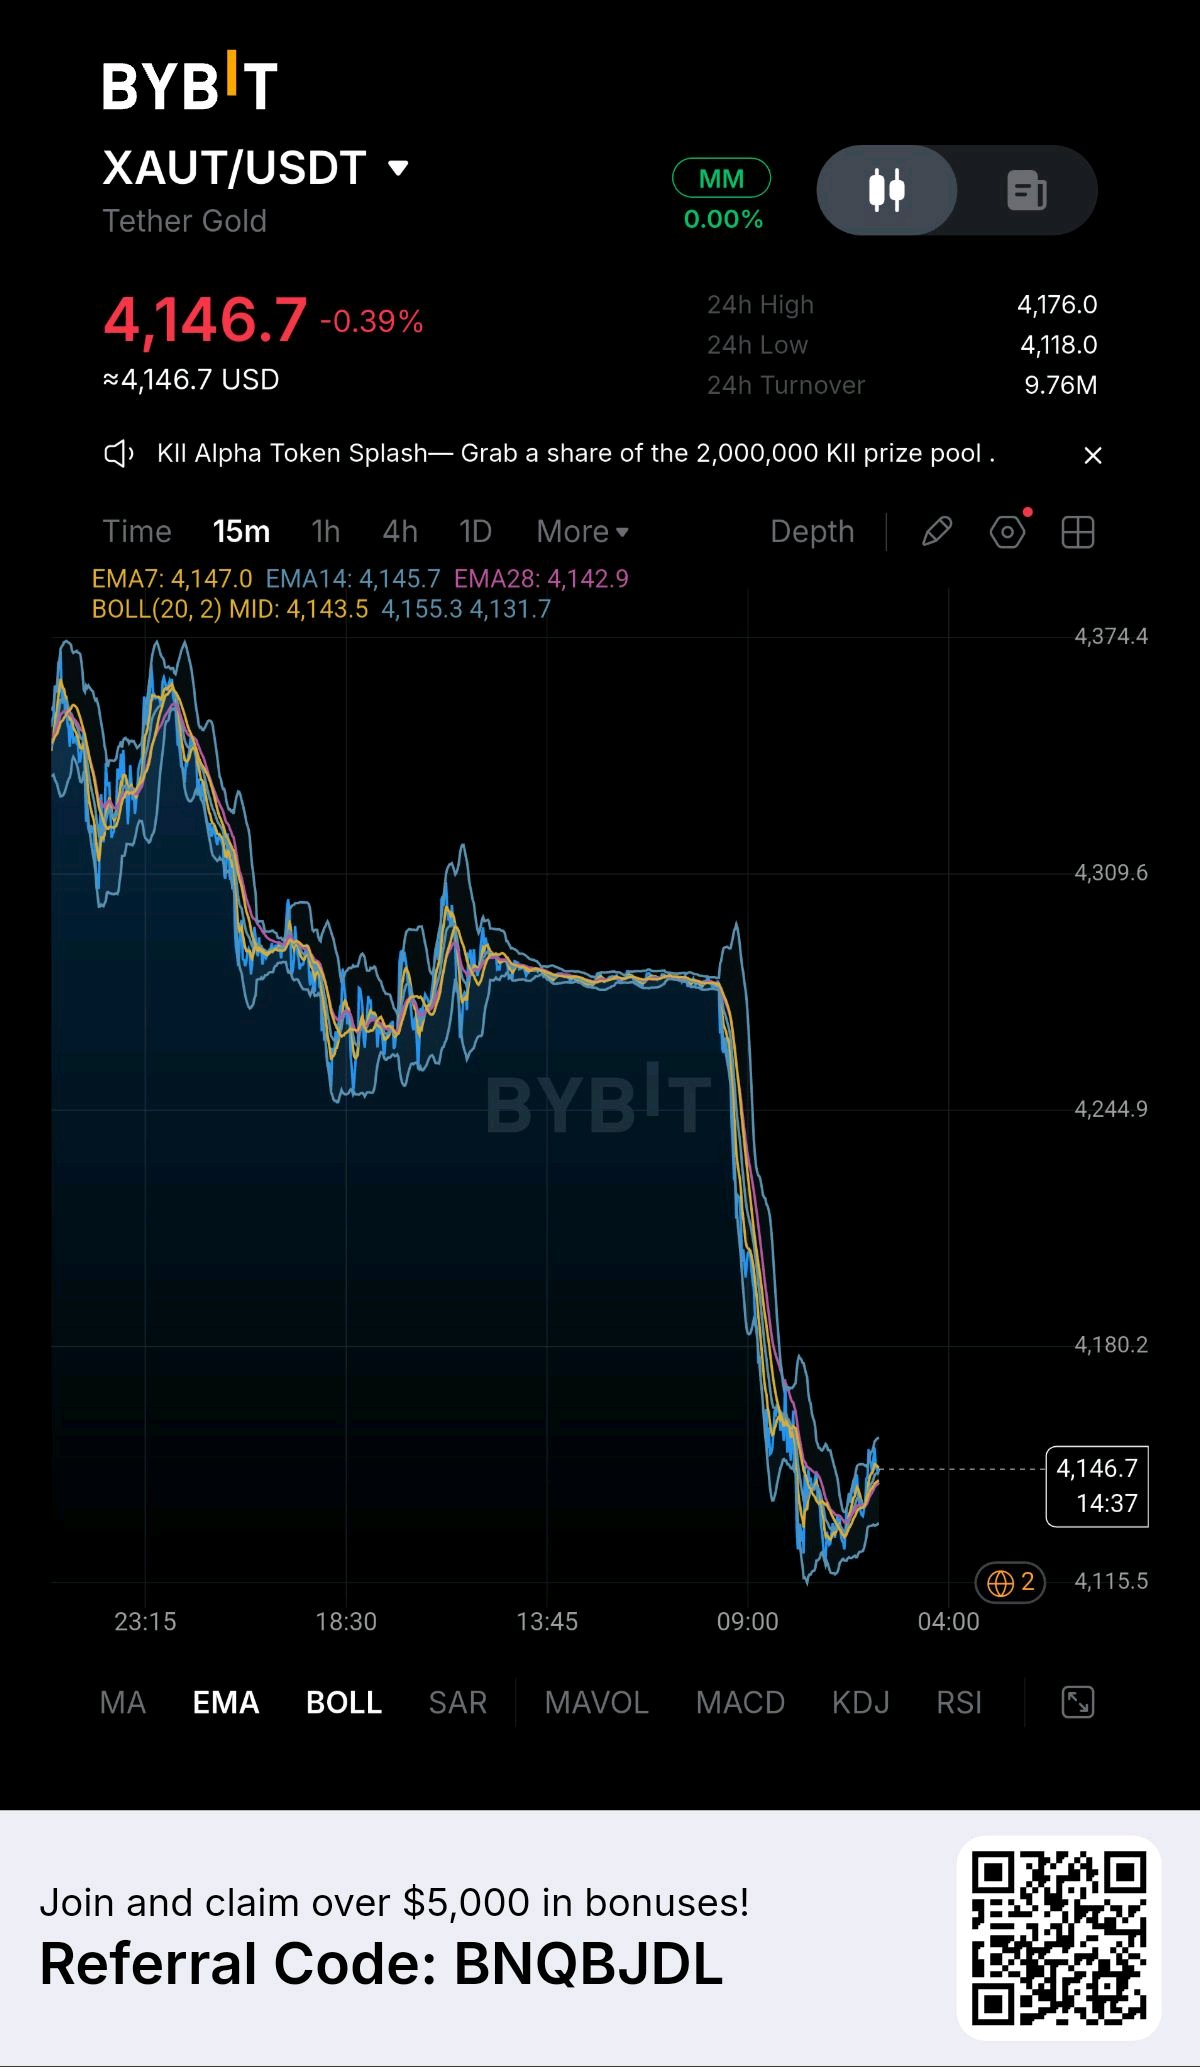
$XAUTUSDT /USDT $XAUT remains under selling pressure after a sharp breakdown, while price is now attempting to recover from the 4,115.5–4,131.7 support region. Support: 4,115.5–4,131.7 Resistance: 4,155.3, then 4,176.0 🎯 Targets: 4,155.3 / 4,176.0 / 4,176.0 Stop Loss: 4,115.5 Sellers still control the broader structure, but buyers are showing some recovery from the lower support area. A reclaim of 4,155.3 would improve short-term momentum and open the way toward 4,176.0. Losing 4,115.5 would signal continued weakness and another downside continuation. #ByXIMPACT
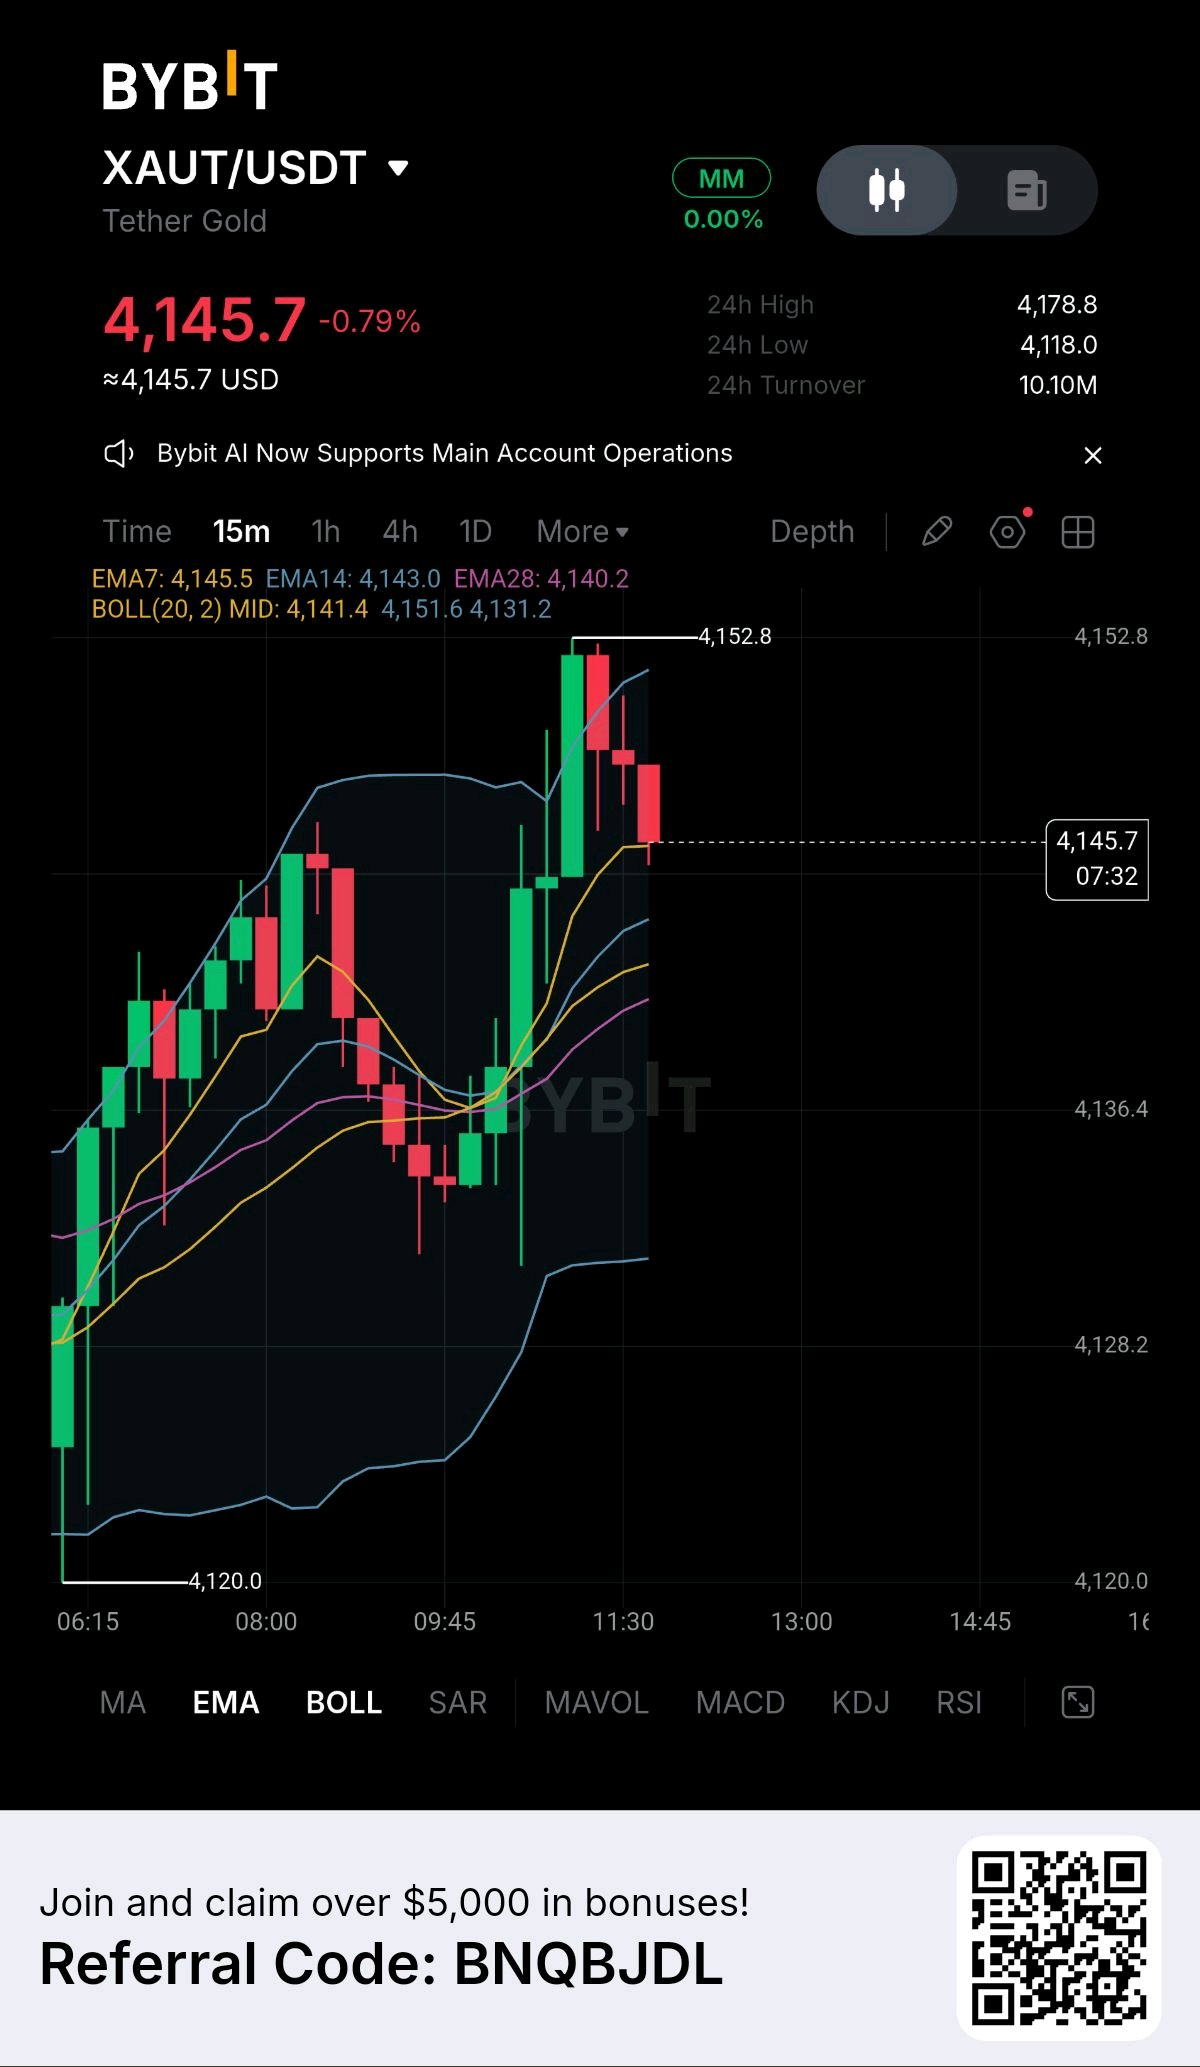
I'm watching $XAUT, and it is showing bullish momentum after a strong recovery from the lower levels. Price is currently around 4,145.7, up from the recent move, while the short-term EMAs remain supportive. The latest candles show some profit-taking after reaching 4,152.8, so confirmation is important before chasing the move. This is why disciplined traders avoid emotional entries. Waiting for price to hold support can provide a cleaner setup instead of buying directly into resistance. Current conditions indicate buying pressure remains present, with price above the 4,141.4 Bollinger midline and EMA14 at 4,143.0. Buyers need to defend this area and reclaim 4,152.8 for further strength. Coin: XAUT Position: LONG Entry Price (EP): 4,141.4–4,145.7 TP1: 4,152.8 TP2: Not visible on the provided chart TP3: Not visible on the provided chart Stop Loss (SL): 4,131.2 Manage your position carefully, secure partial profits, and protect your capital. #ByXIMPACT $XAUTUSDT

👀 Is QNT Ready for Its Next Move?
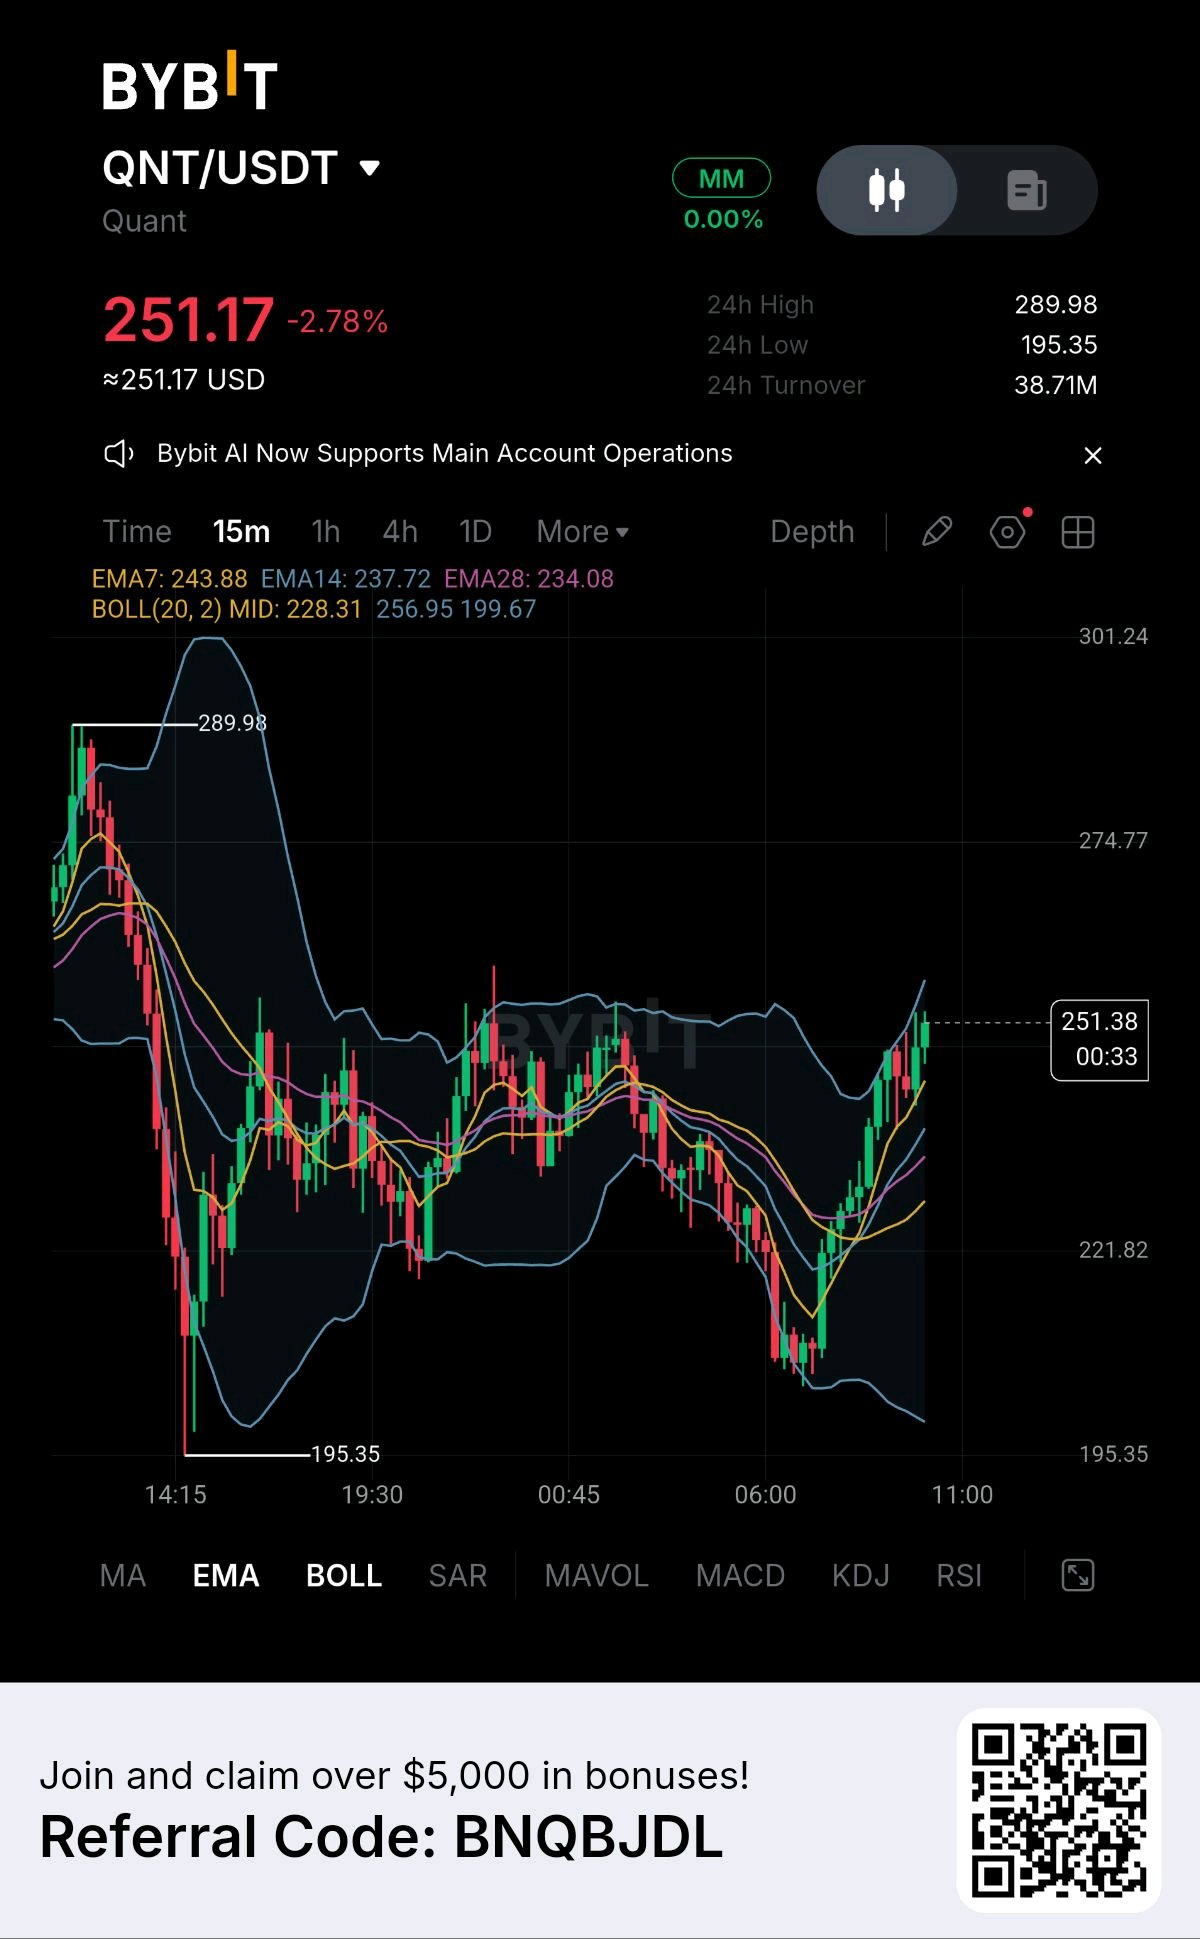
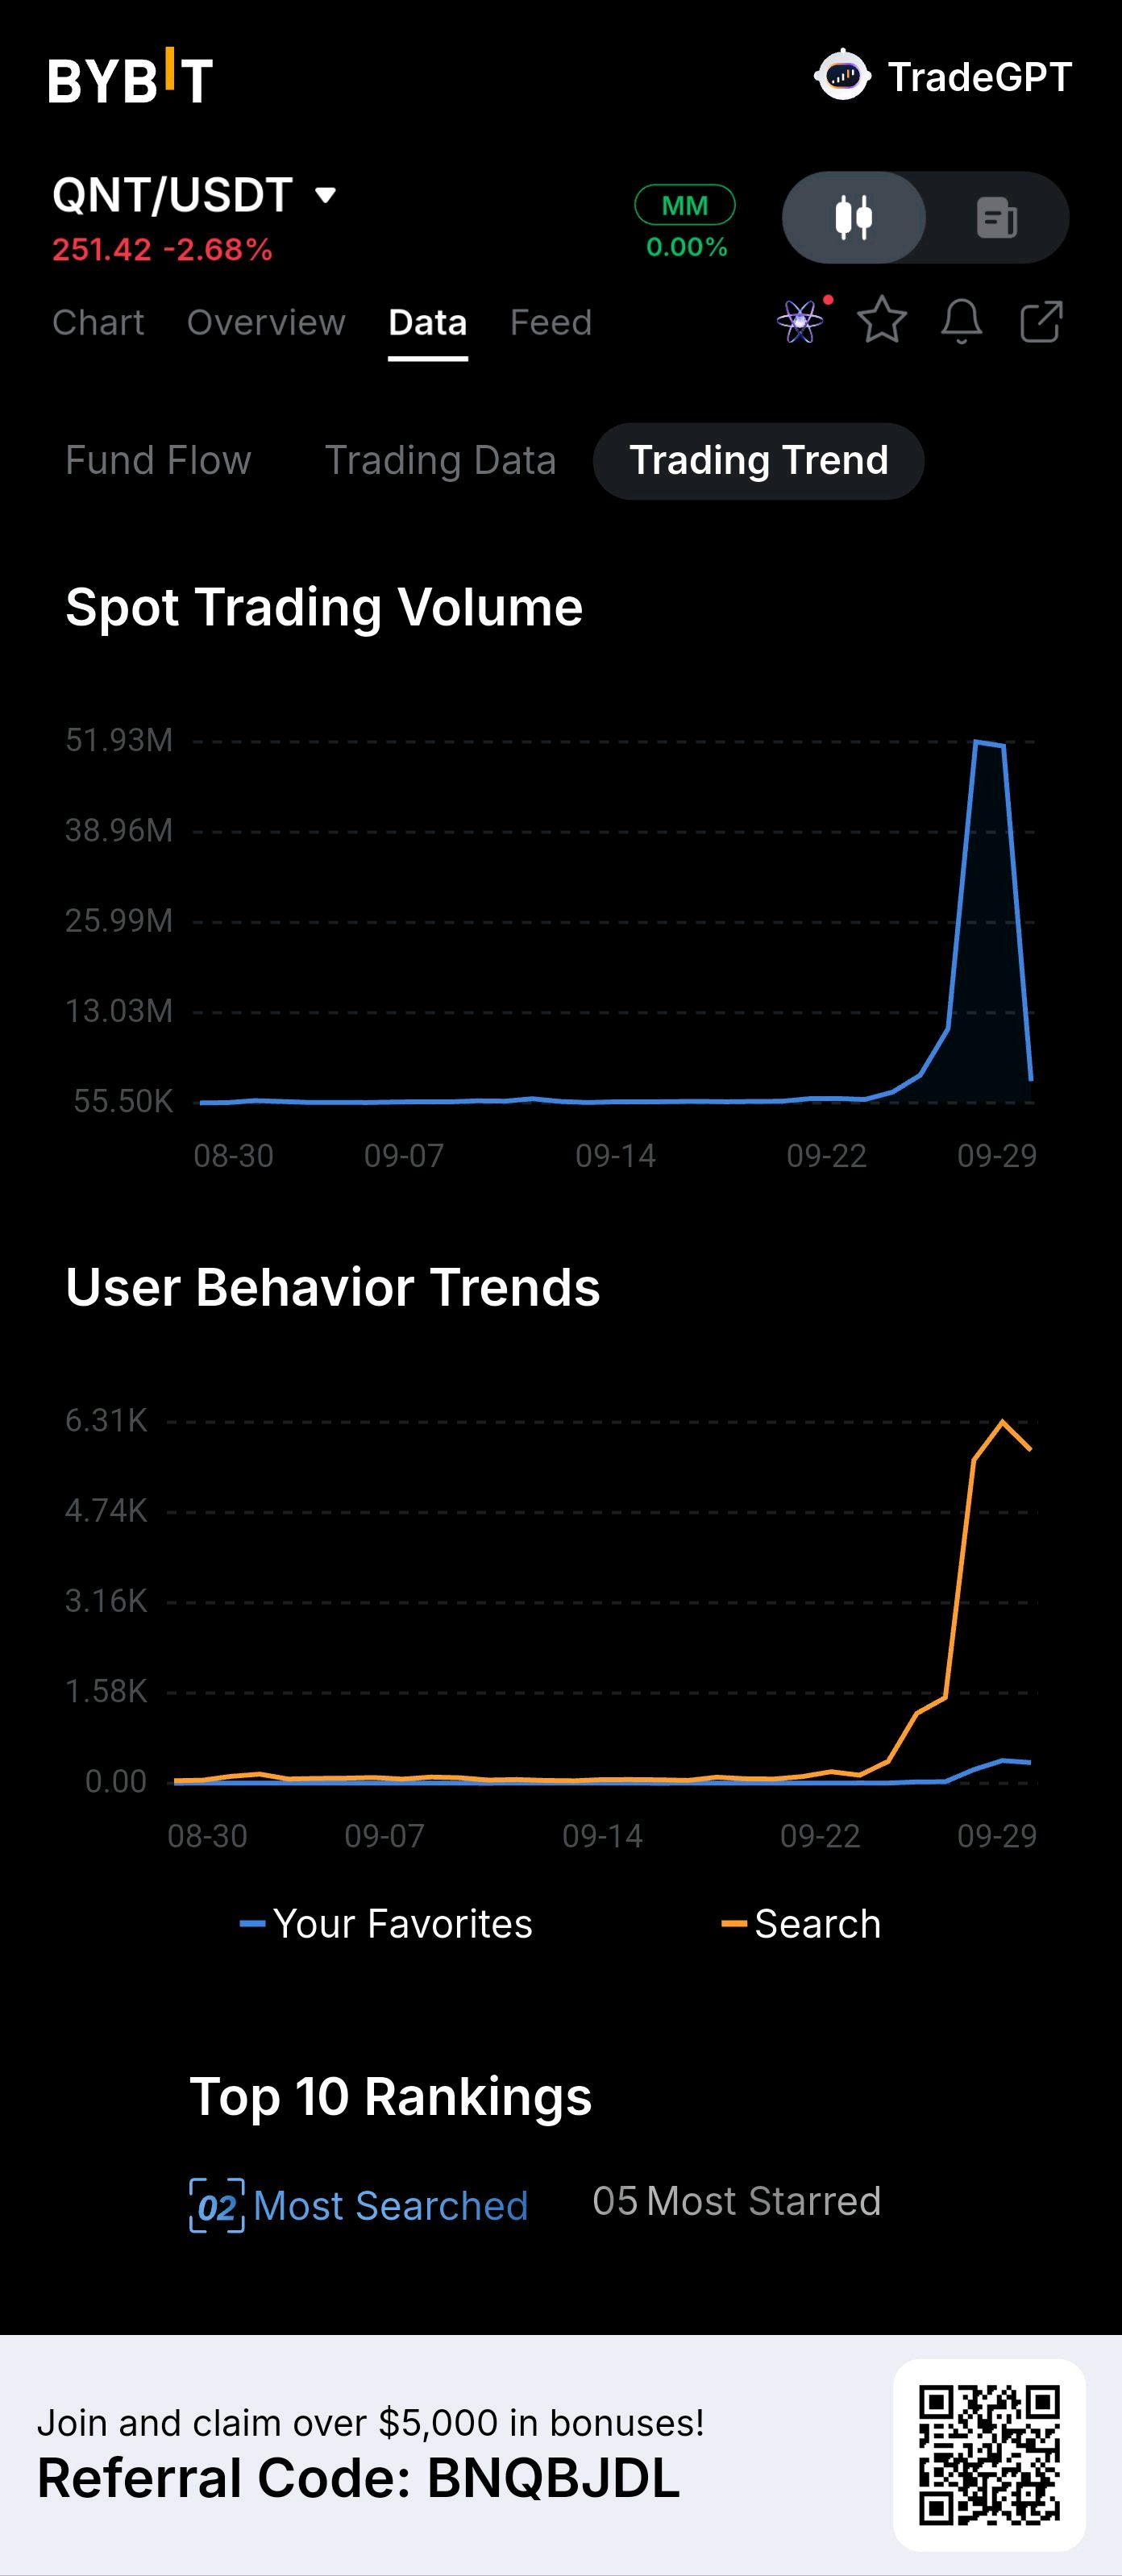
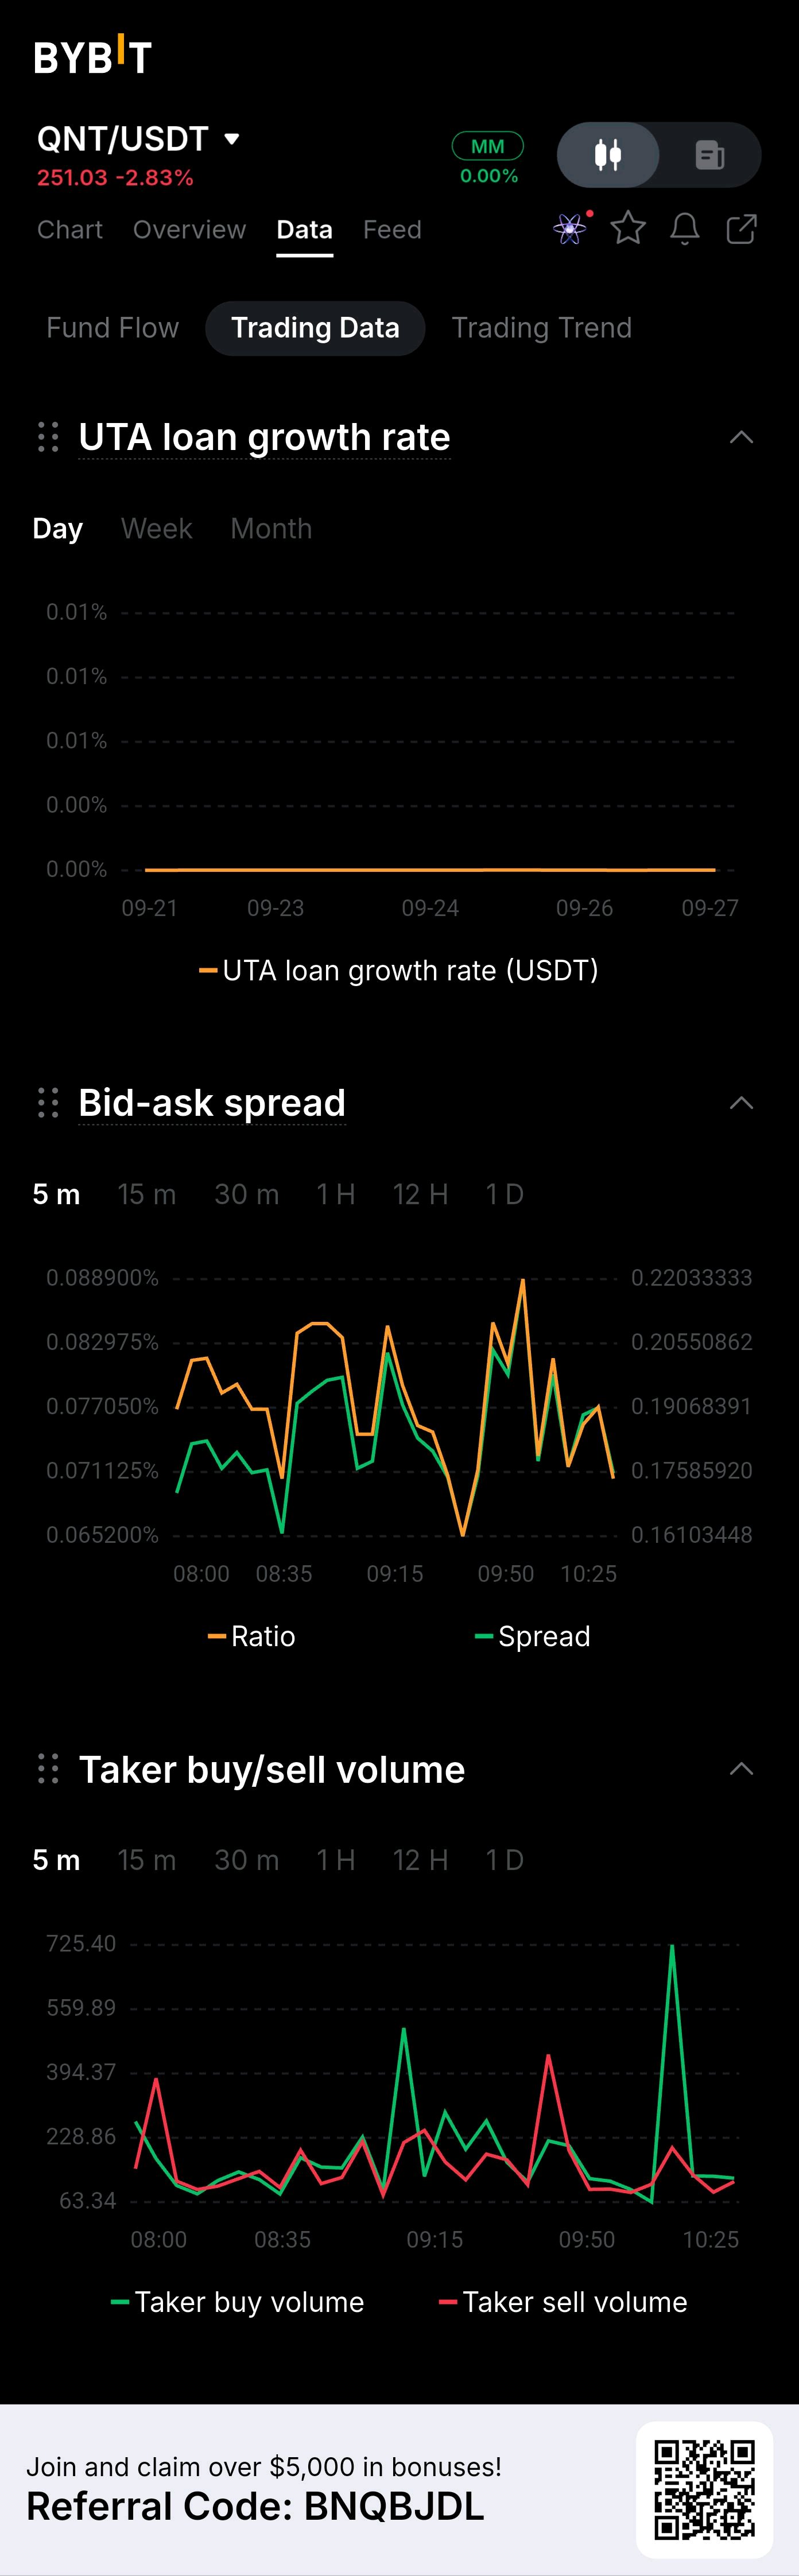
QNT Is Waking Up 🔥 QNT is showing a strong recovery after the recent drop, with price pushing back toward the $250 area. The move from the $195 zone has brought fresh momentum and much more attention to the market. What stands out to me is the sudden increase in trading activity and search interest. Buyers are clearly becoming more active, while the price is now testing an important area near the recent recovery highs. I’m watching this move closely because QNT is no longer moving quietly. The volume, attention, and recovery together make this one worth keeping on the radar. ⚡🚀 #ByXIMPACT $QNTUSDT
🔥 XAUT/USDT — The Battle Zone Is Heating Up
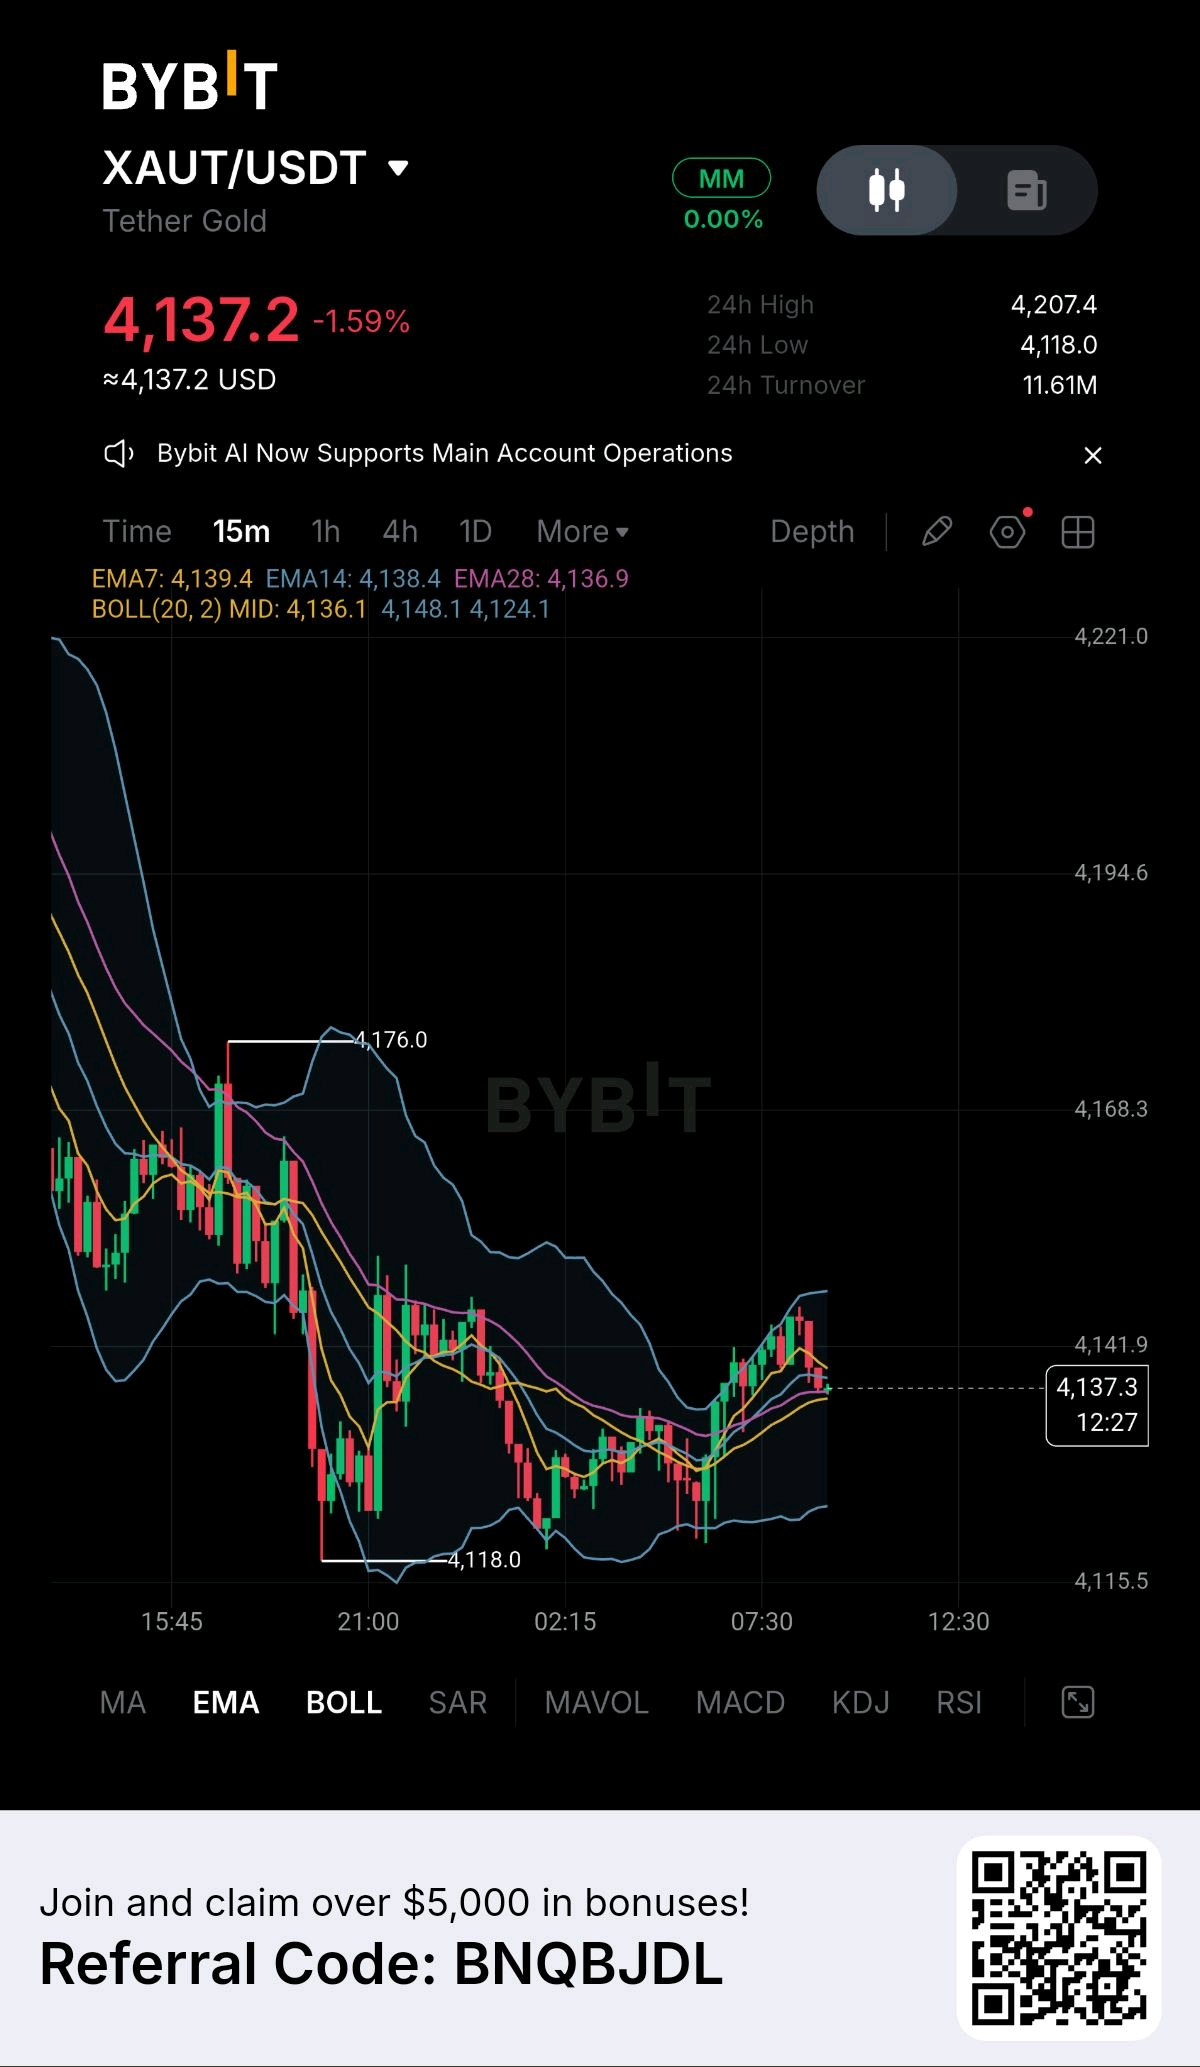
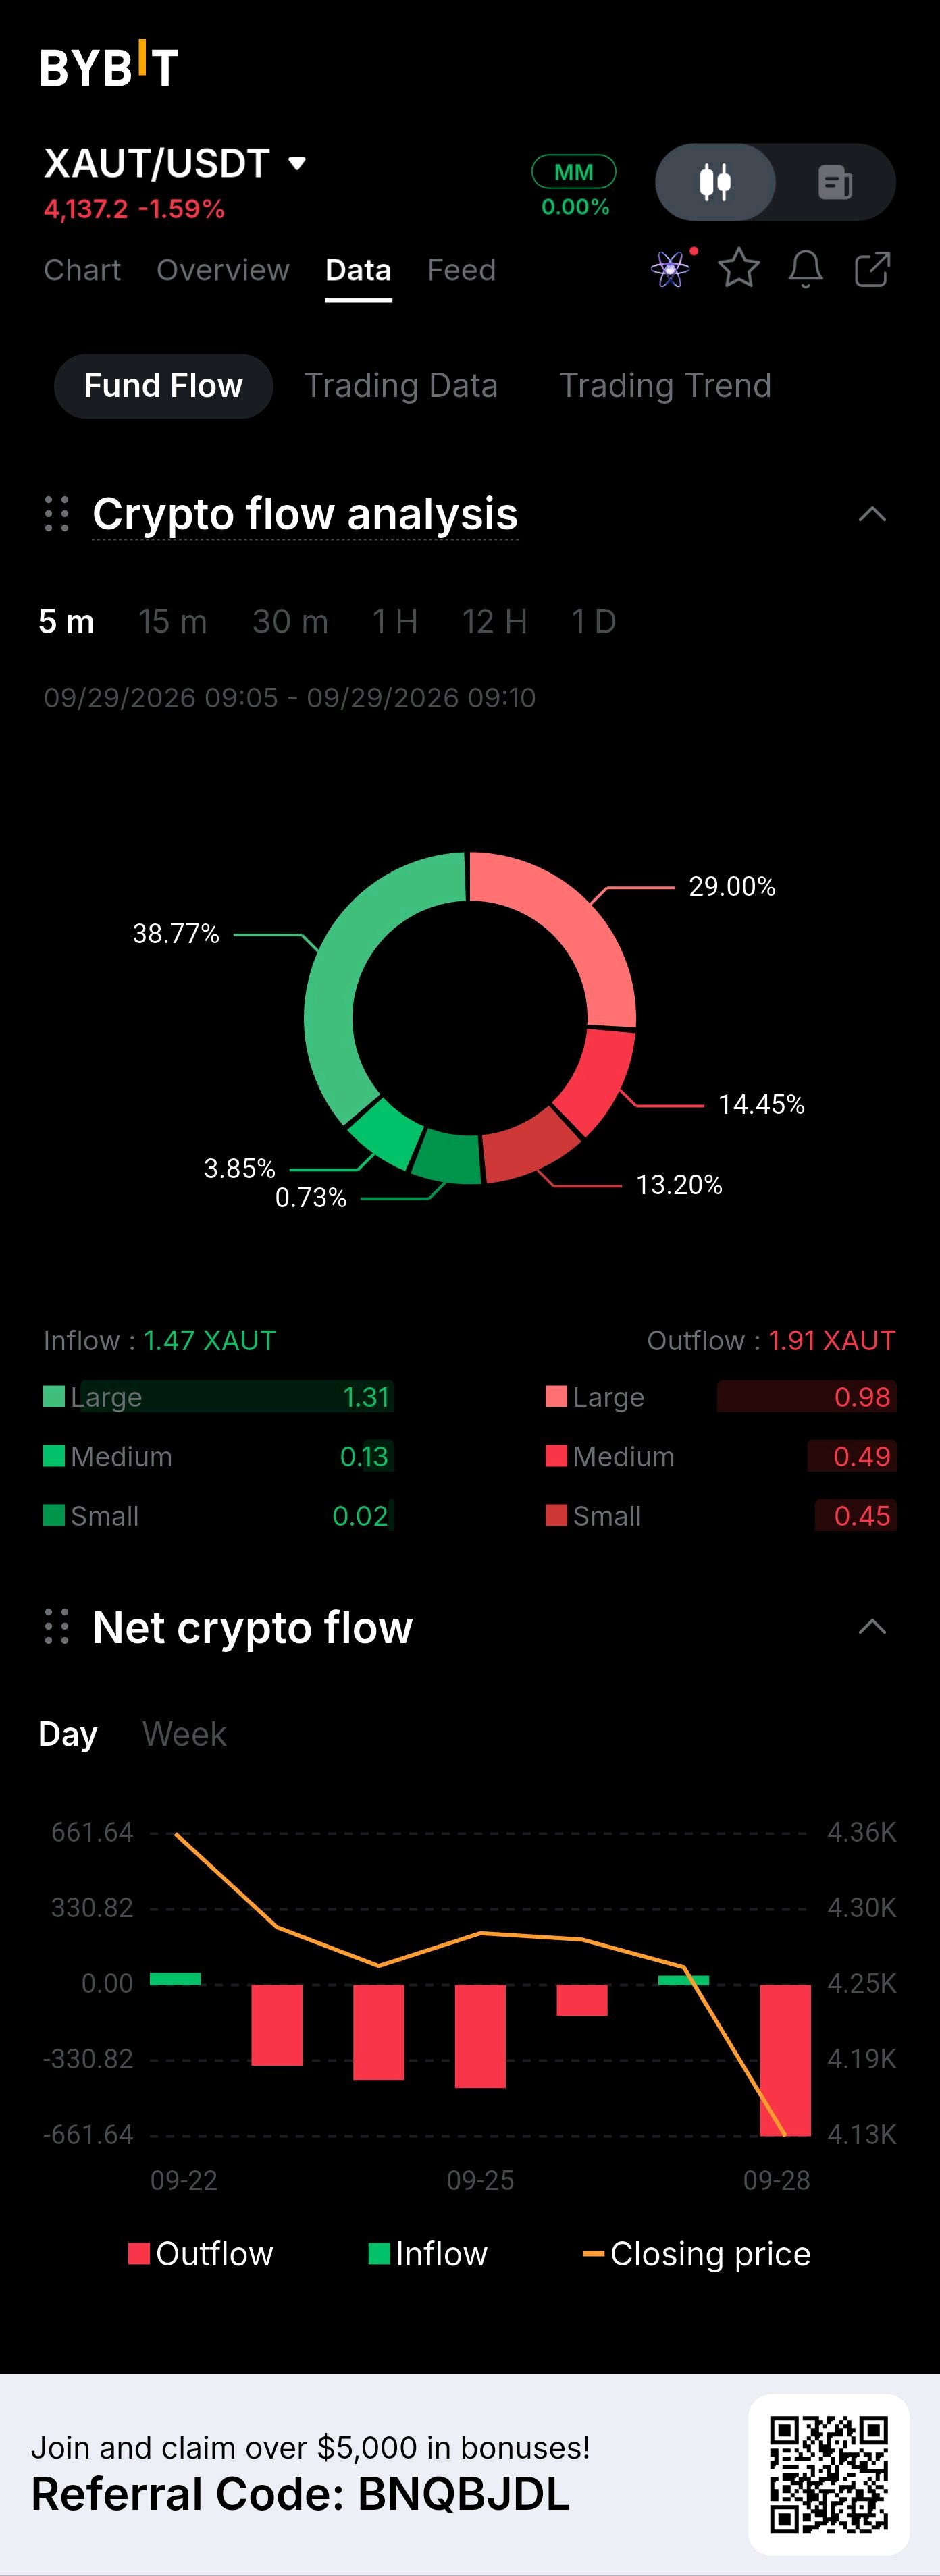
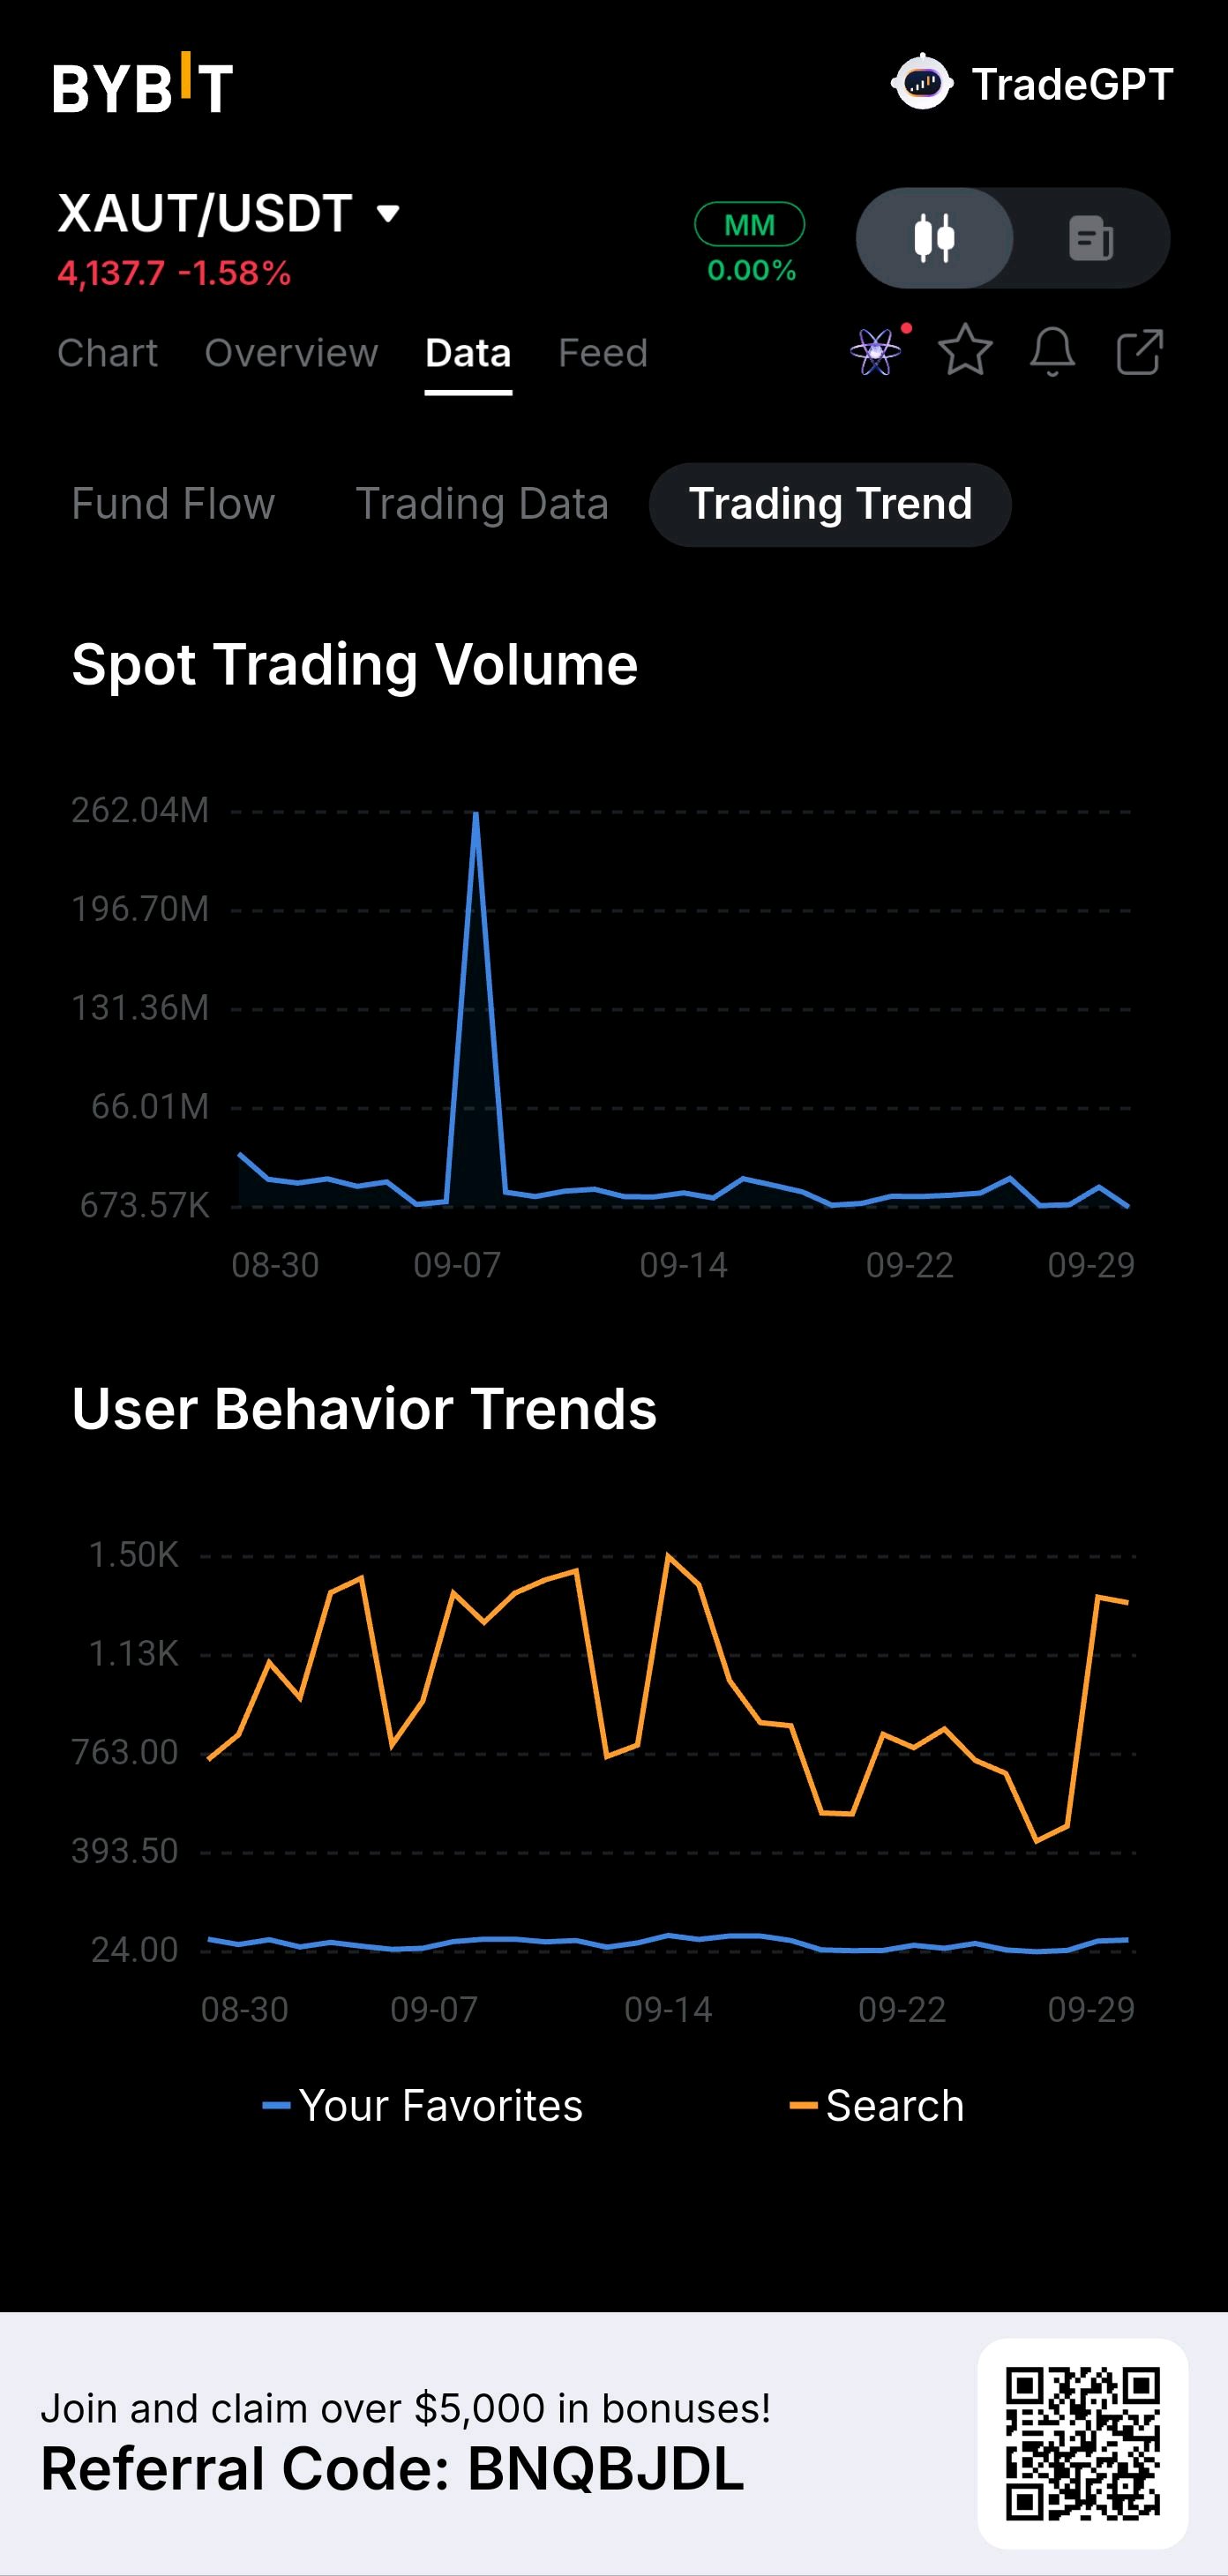
⚡ XAUT/USDT — Pressure Is Building XAUT/USDT is showing a clear shift in market activity. Price is around 4,137.2, down 1.59% today. The recent move from 4,118 brought some recovery. But sellers are still keeping strong pressure on price. The flow data is also sending an important signal. Current inflow stands at 1.47 XAUT. Outflow is higher at 1.91 XAUT. That difference shows stronger selling activity right now. The chart shows price struggling around the EMA area. The latest candles are losing some of the recovery strength. Volume has also remained active around key moves. The next reaction from this zone could be important. XAUT is now sitting at a real decision point. Holding the lower area could bring another recovery attempt. More selling pressure could push price back toward the recent low. For now, the market is clearly fighting between buyers and sellers. #ByXIMPACT $XAUTUSDT
$BTC will definitely hit $1M , very soon… I believe, yes! Only one supercycle is enough to get it there CZ hinted it alot (the supercycle) but dunno when it’s gonna happen Once in, $1M in one single cycle is doable! It’s just x10 from 100k 😂 Bitcoin is big but it’s doable maybe in two cycles if the 4 years one continue, but anyway , it gets matured every cycle Just don’t panic sell and buy it now if you haven’t already! Even if, dca Disclaimer : it’s my personal opinion and the post is in ‘bullish’ vibe. #ByXIMPACT $BTCUSDT

ALERT: $ETH SHORTS ARE EXPLODING 🚨
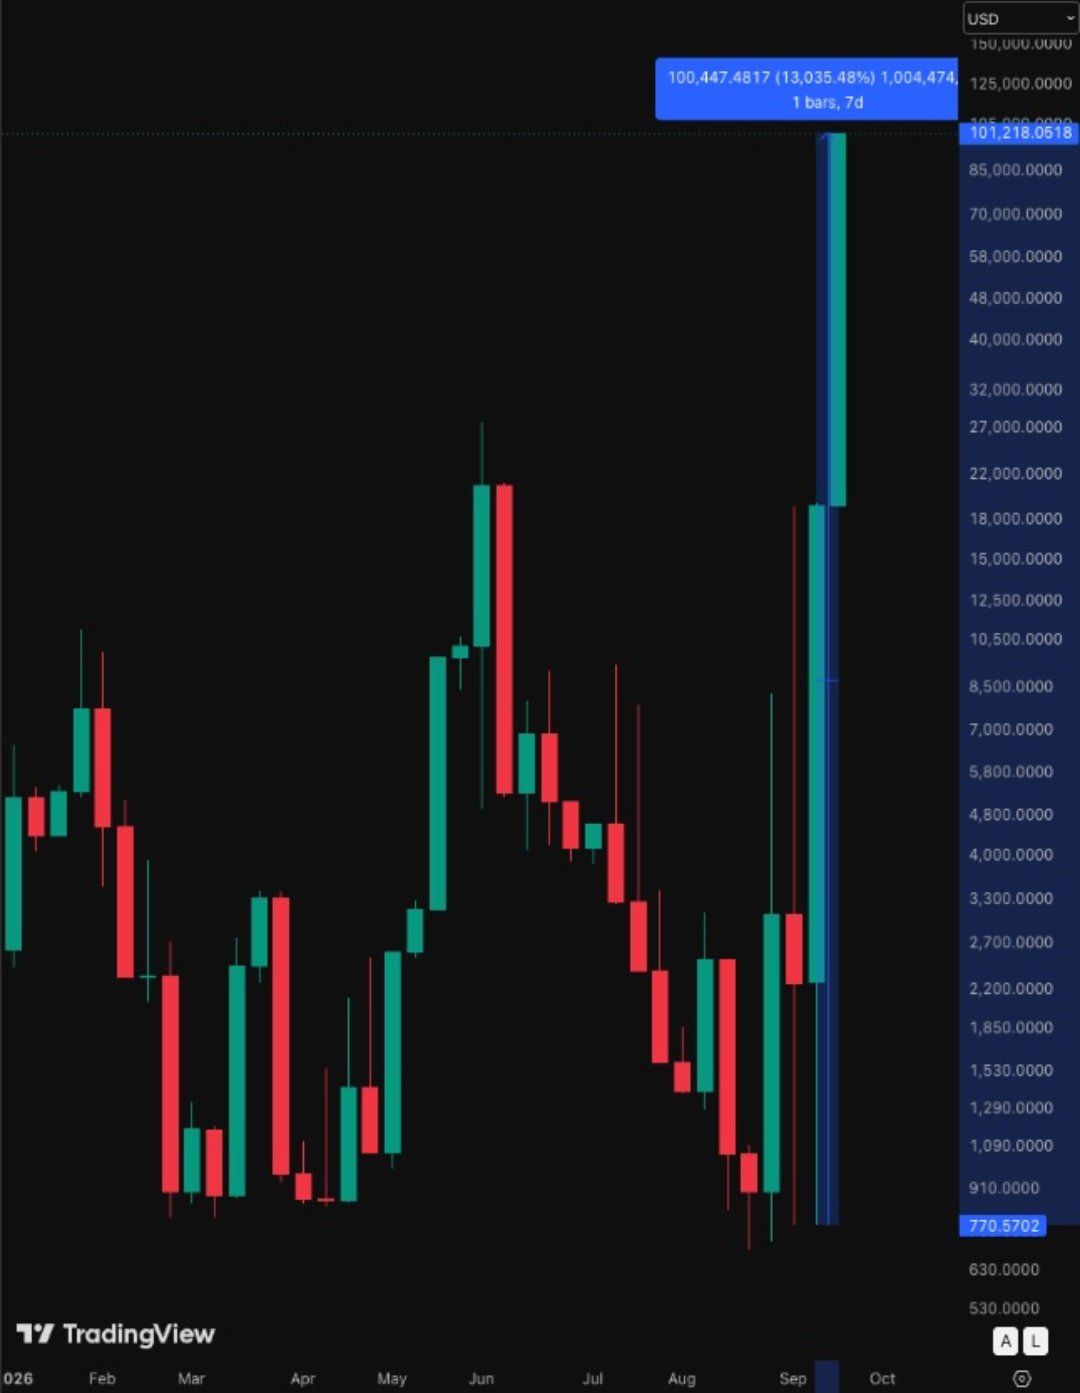
$ETHUSDT short positions on Bitfinex have jumped from around 771 ETH to over 101K ETH in just two weeks. That’s a massive buildup of shorts. If ETH starts moving higher, this crowded positioning could quickly turn into fuel for a strong short squeeze. This setup is getting very interesting. 👀 #ByXIMPACT
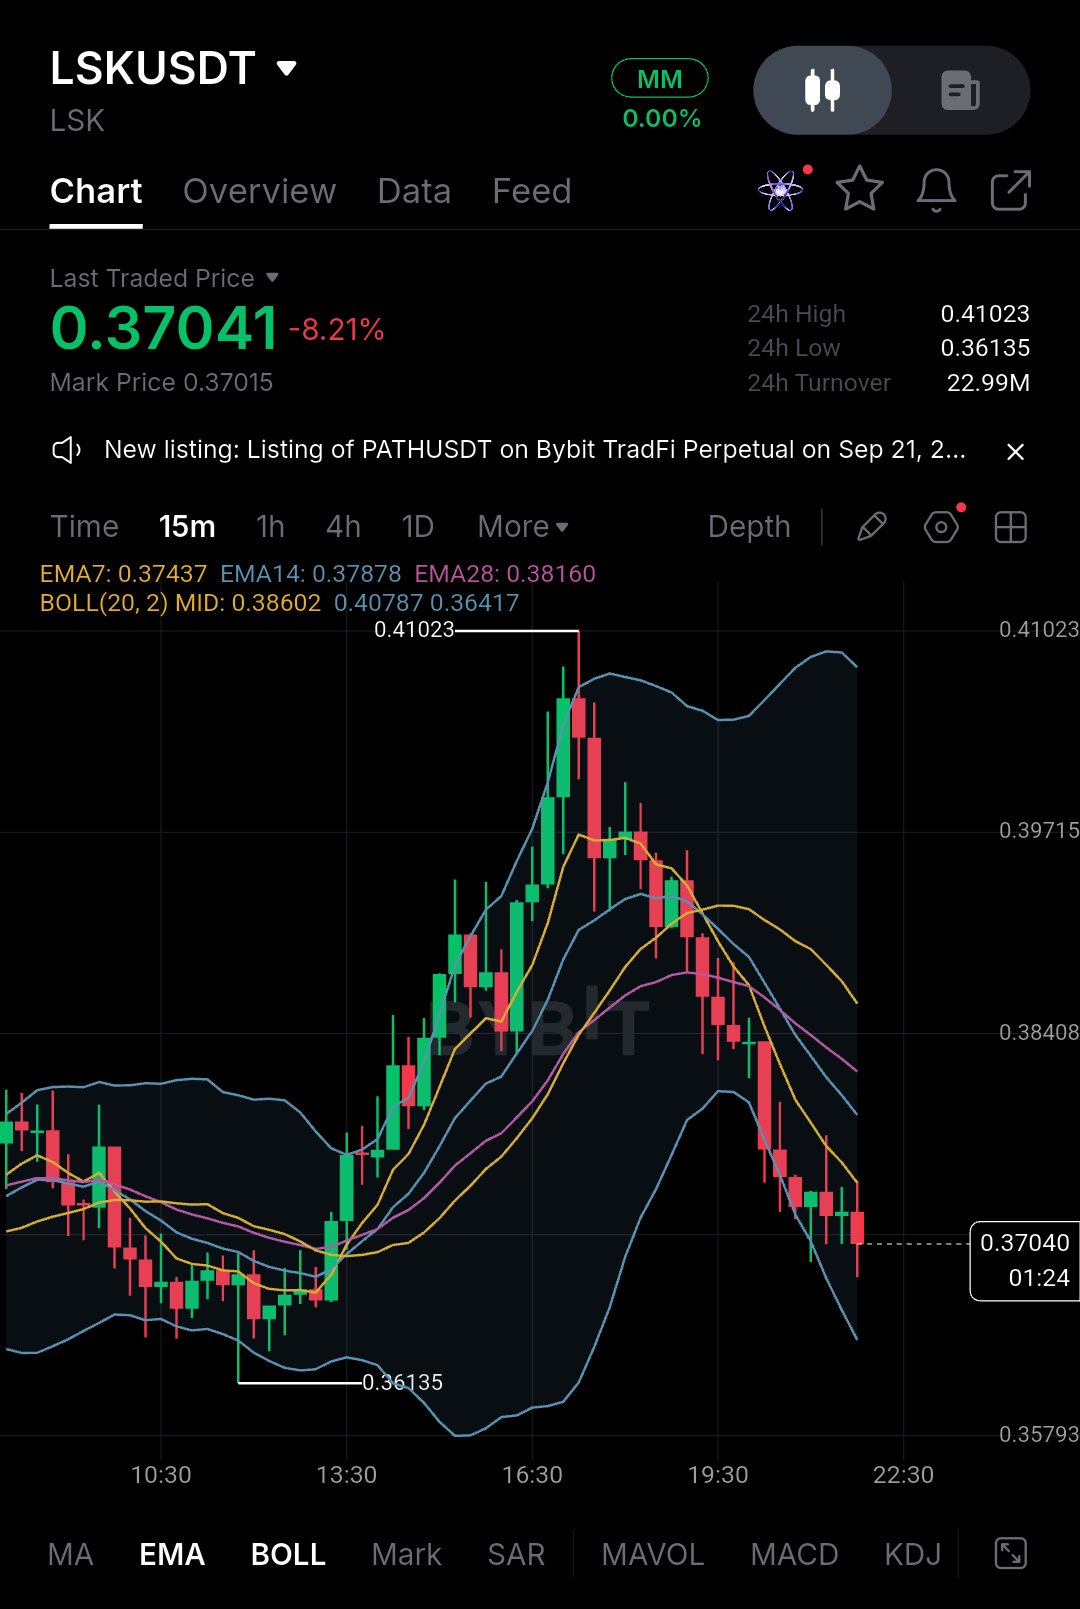
$LSK is trying to stabilize near support after a strong correction. Price is around 0.37040, while the lower Bollinger area sits near 0.36417. Buyers need to defend this zone and reclaim 0.38408 to bring stronger momentum back. EP 0.36417–0.37040 TP 0.38408 0.39715 0.40787 SL 0.36135 The setup depends on support holding. If buyers reclaim nearby resistance, LSK could start moving back toward the higher levels. Stay patient and avoid chasing the move. Let’s go LSK #BybitAIBestReplies #TradFiOptions24/7
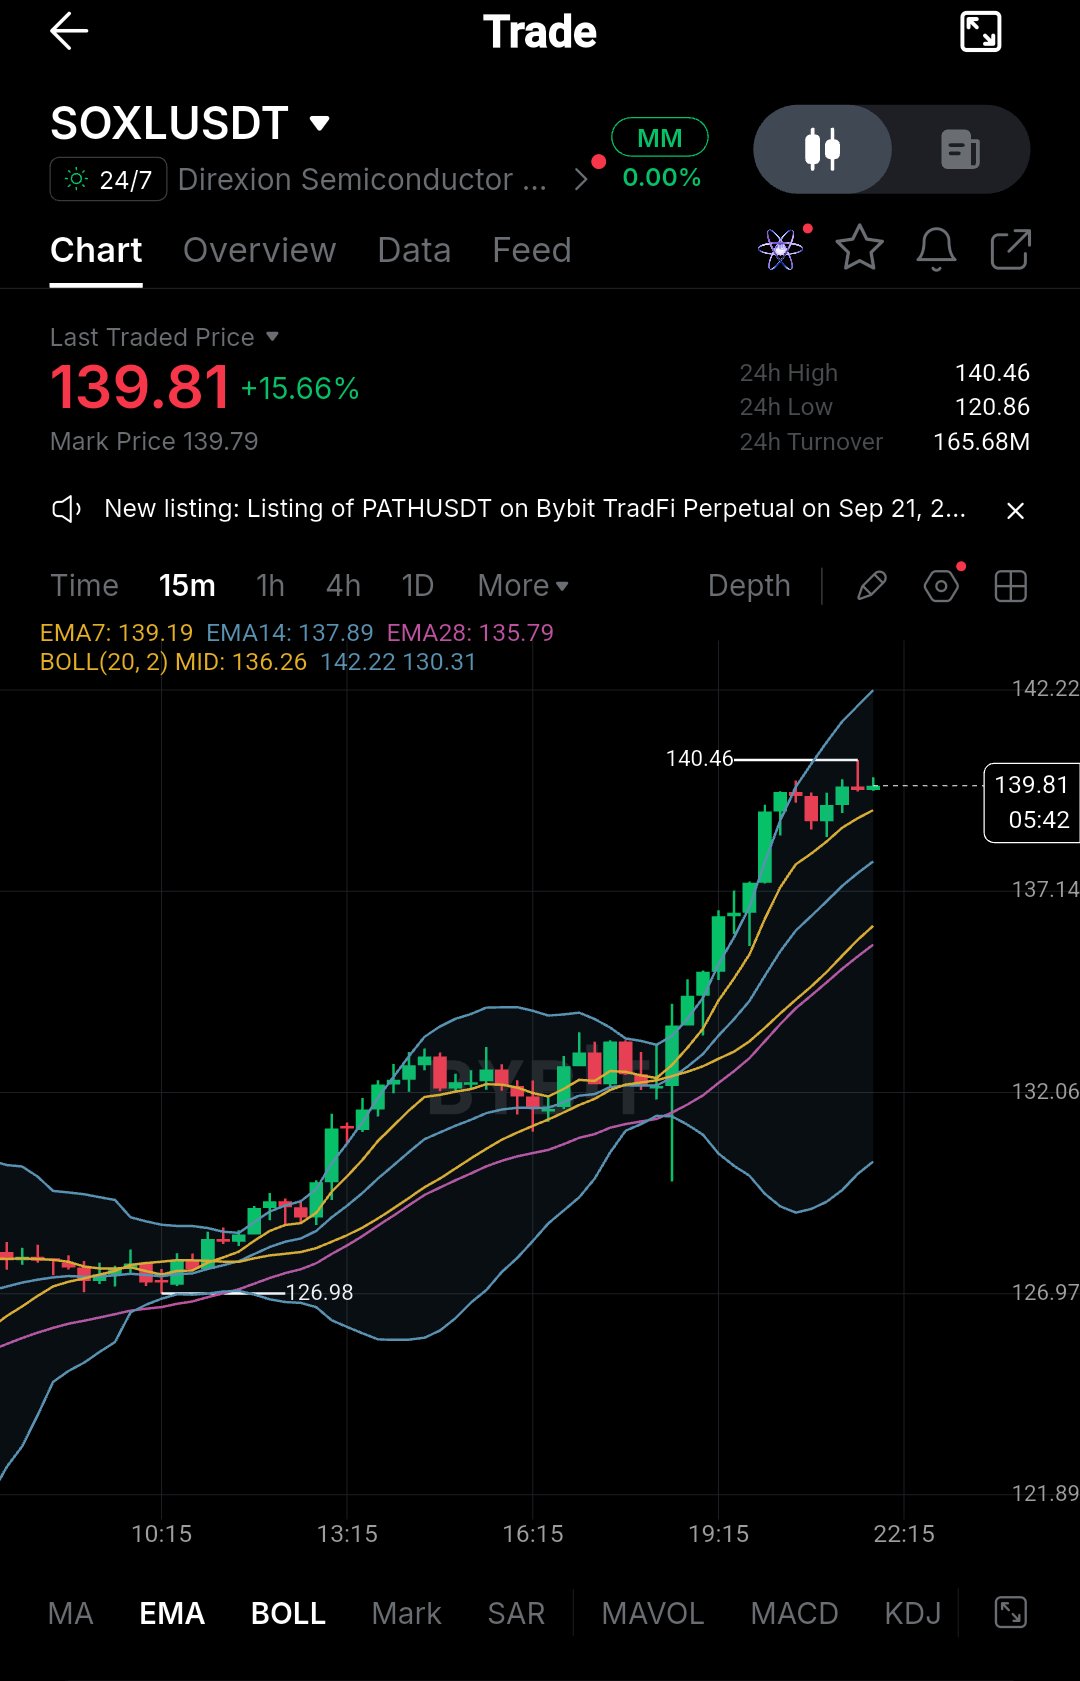
$SOXL is moving with serious strength right now. Price is sitting around 139.81, up 15.66%, after pushing to a fresh intraday high of 140.46. Buyers are clearly in control, and price is holding above the EMA7 at 139.19 and EMA14 at 137.89. As long as this area holds, the bullish structure remains intact. Coin: $SOXL Position: LONG Entry: 139.19–139.81 TP1: 140.46 TP2: 142.22 SL: 137.89 Don’t chase a fast candle just because it’s moving. Wait for confirmation and manage your risk. Take profits gradually and protect your capital. 📈 #BybitAIBestReplies #TradFiOptions24/7 $BTCUSDT
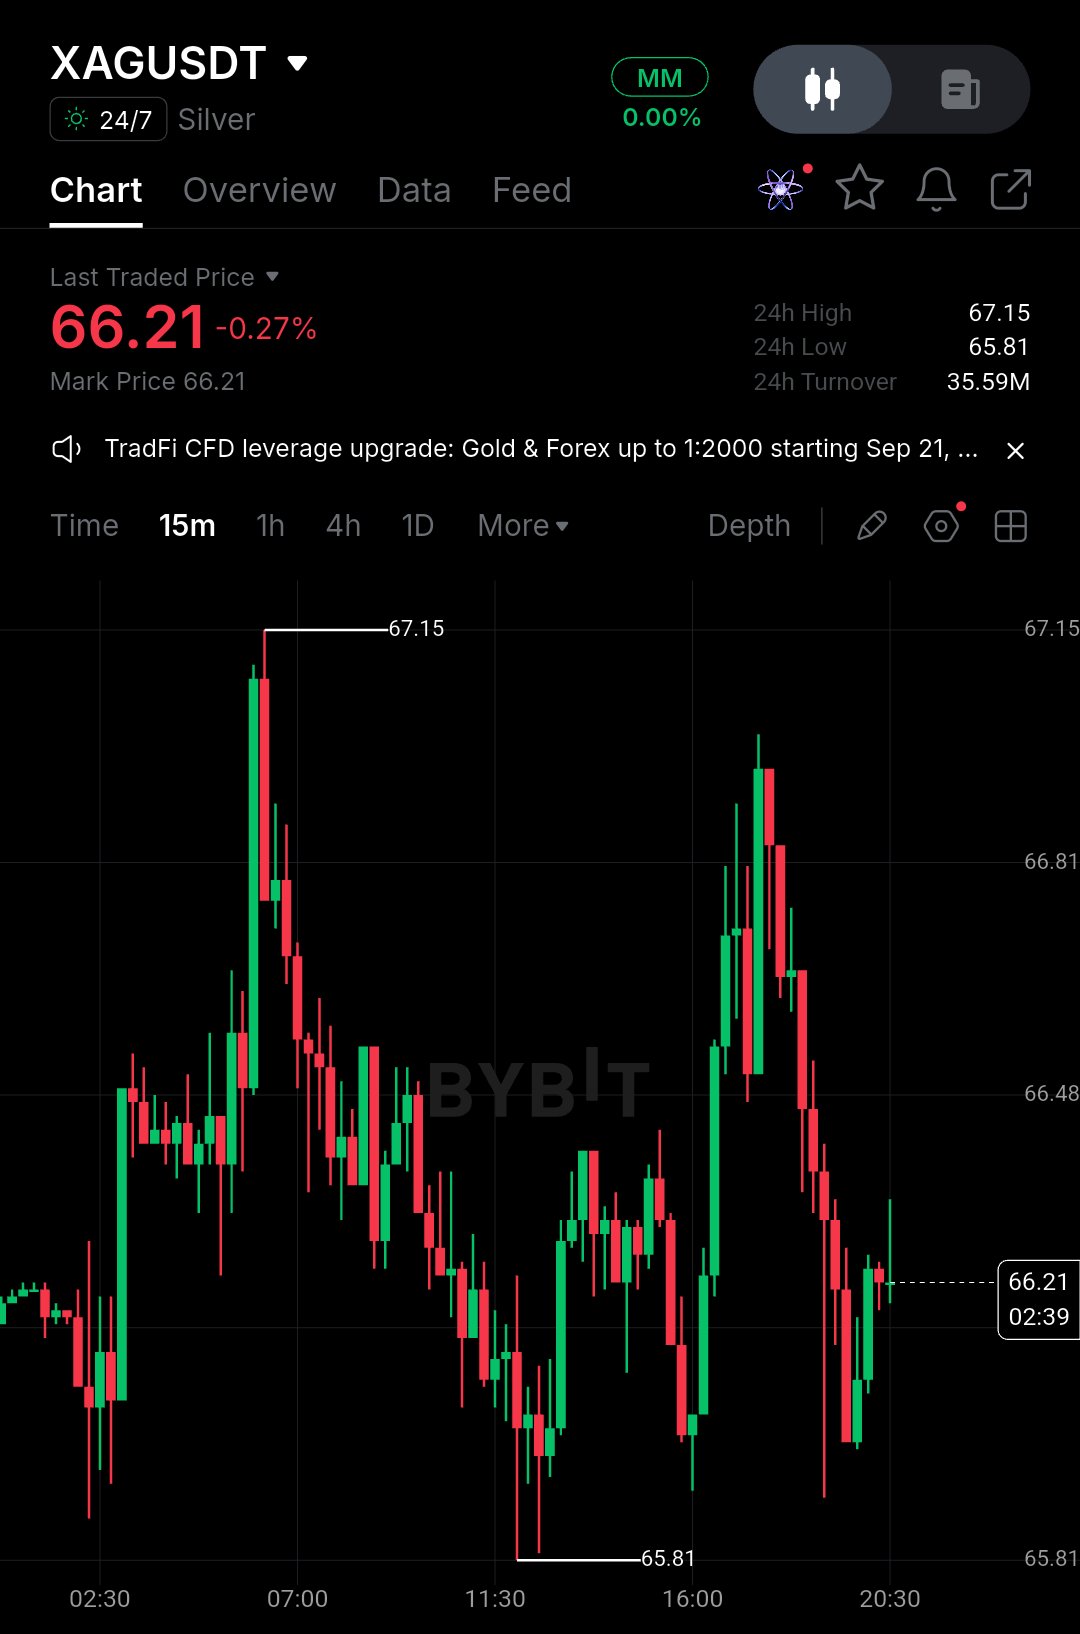
$XAG, traders, look closely at this reaction. Silver dropped from the recent high and found buyers around the $65.81 low. Now price has recovered back to $66.21, but the rebound still needs confirmation. I’m watching whether buyers can turn this bounce into a stronger recovery. ◇ 📌 Current Price: $66.21 📊 24H Change: -0.27% ▣ 24H High: $67.15 ⌁ 24H Low: $65.81 ◈ 24H Turnover: $35.59M 🟩 Entry Zone: $66.00 – $66.21 ⟢ TP1: $66.48 ⌁ TP2: $66.81 ⚡︎ TP3: $67.15 🛡️ Stop Loss: $65.81 The entry area is close to the latest recovery zone after price bounced from the session low. Holding this region keeps the rebound structure intact. TP1 at $66.48 is the first nearby resistance. If buyers reclaim it cleanly, $66.81 becomes the next level to watch, with $67.15 marking the visible high. The stop at $65.81 sits beneath the visible 24H low. A break below that level would weaken the recovery setup. Support: $65.81 / $66.00 Resistance: $66.48 / $66.81 / $67.15 My fam, this is where patience matters. Let the candles show whether buyers can defend $66.00 and push through $66.48 before treating the recovery as meaningful. ⟡ #BybitAIBestReplies #TradFiOptions24/7 #FOMC
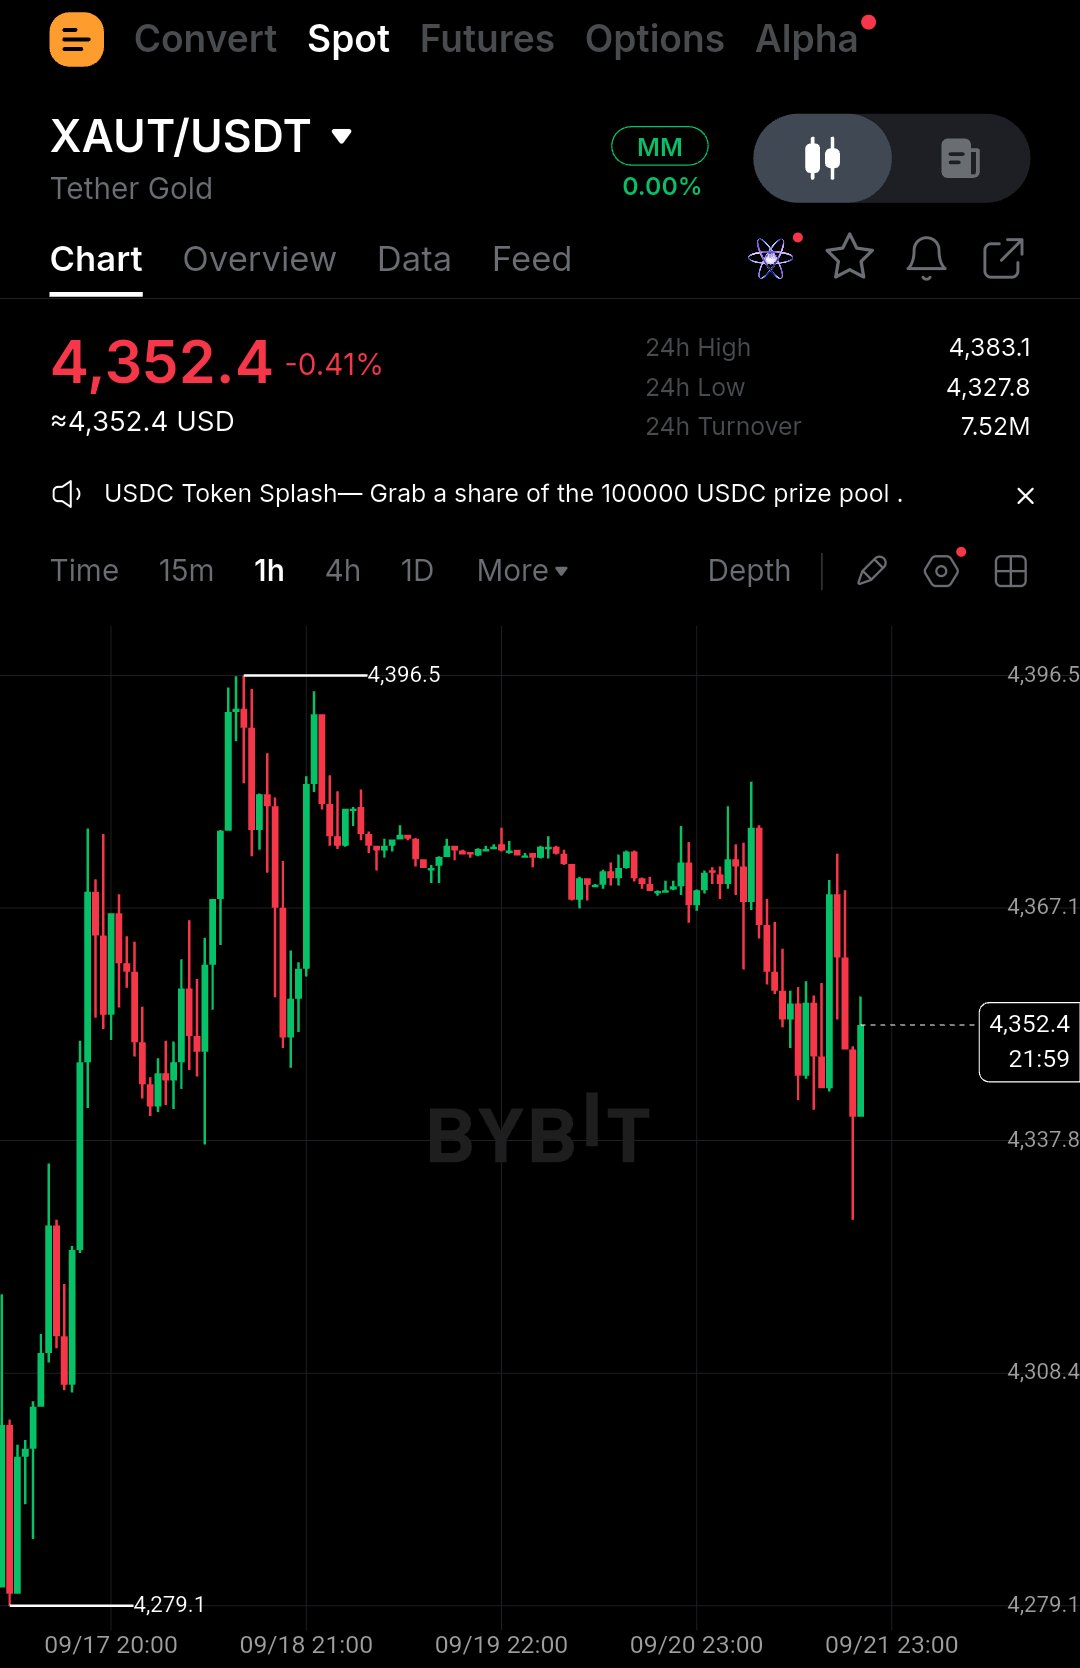
$XAUT, guys, this one deserves a close look right now. Price is holding above the recent $4,337.8 area after a sharp intraday drop. The latest candles show buyers trying to recover from the lower zone. The key question is whether this rebound can reclaim nearby resistance. ⟢ 📌 Current Price: $4,352.4 📊 24H Change: -0.41% ▣ 24H High: $4,383.1 ⌁ 24H Low: $4,327.8 ◈ 24H Turnover: $7.52M LONG SETUP — confirmation focused 🟢 Entry Zone: $4,337.8 – $4,352.4 ⟡ TP1: $4,367.1 ◇ TP2: $4,383.1 ⚡︎ TP3: $4,396.5 🛡️ Stop Loss: $4,327.8 The entry zone sits around the recent reaction area, where price has already shown a bounce. I’m watching whether buyers can keep defending this region instead of giving the recovery back. TP1 at $4,367.1 is the first nearby resistance visible in the current structure. A clean reclaim could open the way toward the $4,383.1 high, while $4,396.5 remains the higher visible resistance level. The stop at $4,327.8 keeps the setup tied to the visible 24H low. A move below that area would weaken the rebound idea considerably. Support: $4,337.8 / $4,327.8 Resistance: $4,367.1 / $4,383.1 / $4,396.5 My fam, don’t chase the reaction—watch how price behaves around $4,367.1. That next move should tell us whether buyers can actually build continuation. $XAUTUSDT #BybitAIBestReplies #TradFiOptions24/7
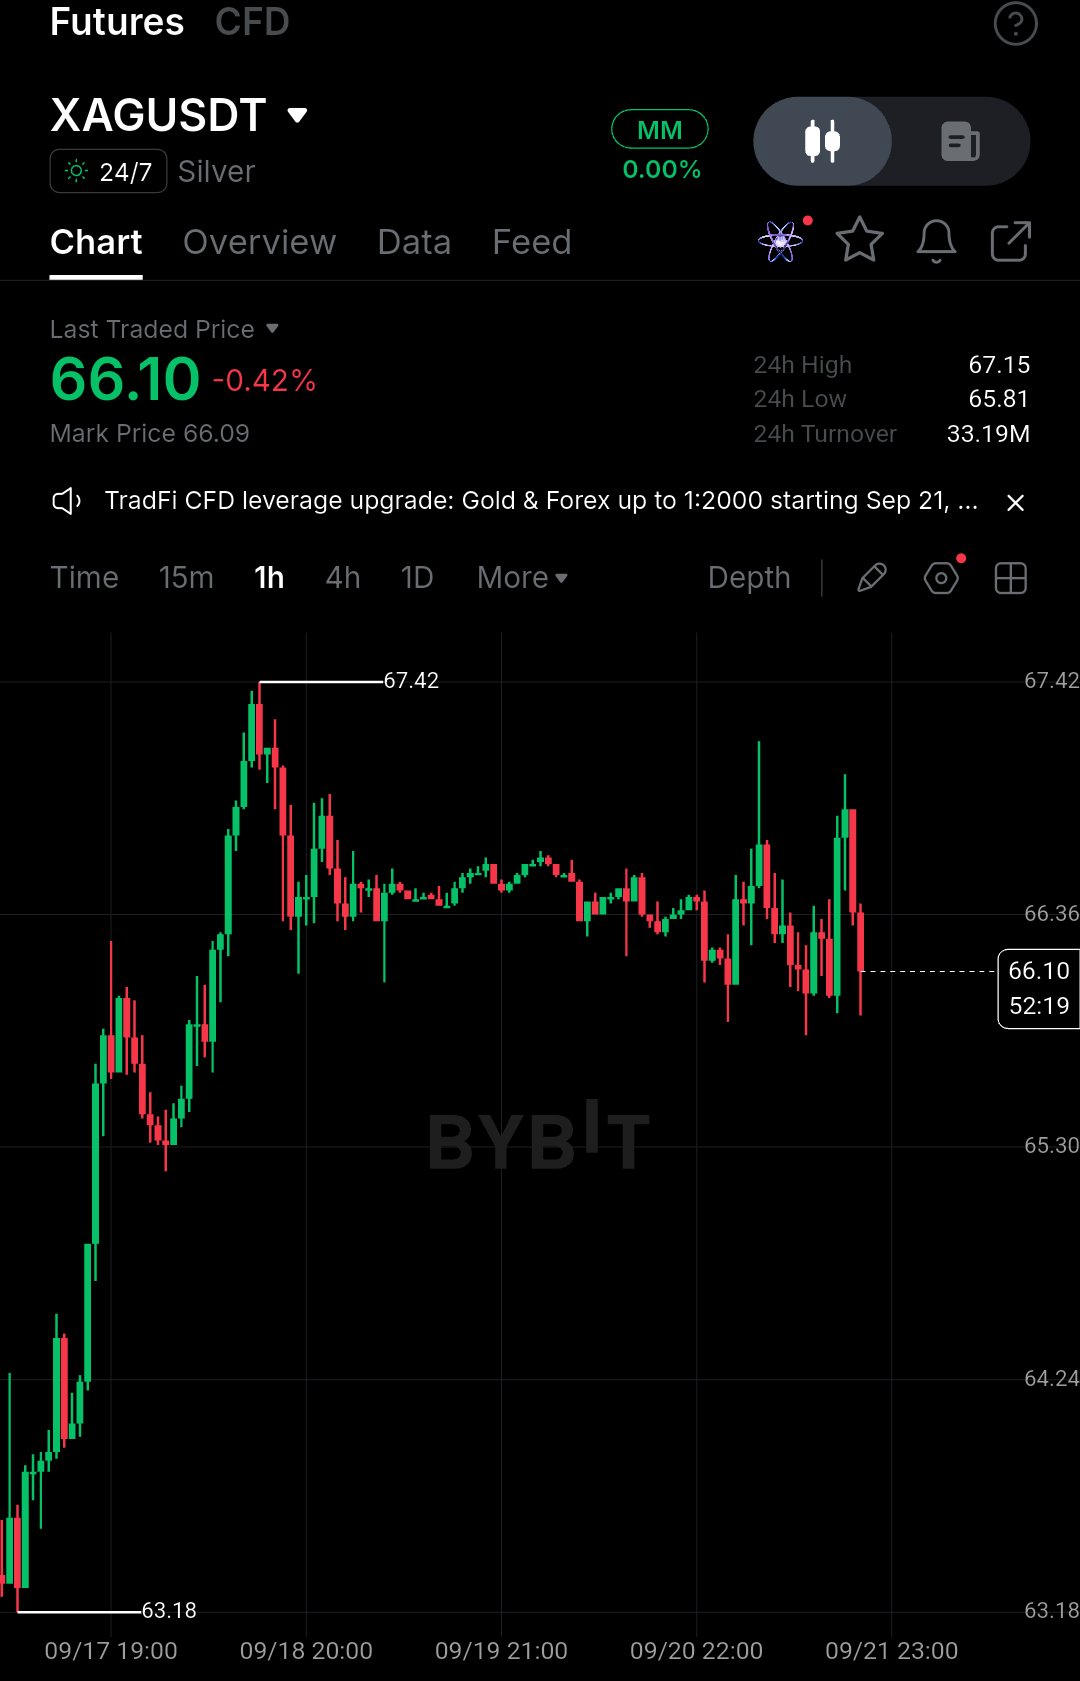
$XAGUSDT, guys, look closely at this reaction because sellers are starting to press again. Price is sitting at 66.10 after failing to hold the higher area around 67+. The latest candles show repeated rejection and the current move is leaning bearish. I’m watching the lower supports closely now — a clean break could open more downside. 📌 Current Price: 66.10 📊 24H Change: -0.42% ▣ 24H High: 67.15 ⌁ 24H Low: 65.81 ◈ 24H Turnover: 33.19M 🔻 Entry Zone: $66.10 – $66.36 ⟡ TP1: $65.81 ◇ TP2: $65.30 ⚡︎ TP3: $64.24 🛡️ Stop Loss: $67.42 The entry area matters because 66.36 has acted as a key nearby reaction zone. If sellers keep control below it, the first level I’m watching is 65.81, the current 24H low. If that support gives way, price could test 65.30 next, while 64.24 becomes the deeper downside level on this structure. The setup becomes weaker if buyers reclaim the upper resistance area. 67.42 is the major invalidation point from the visible chart structure. Support: 65.81 / 65.30 / 64.24 Resistance: 66.36 / 67.15 / 67.42 My fam, I’m not chasing the candle here. I want to see sellers confirm the weakness and push through support. Keep 65.81 on your radar — that reaction could tell us what comes next.