MIDAN
Welcome everyone 😊💯✅️
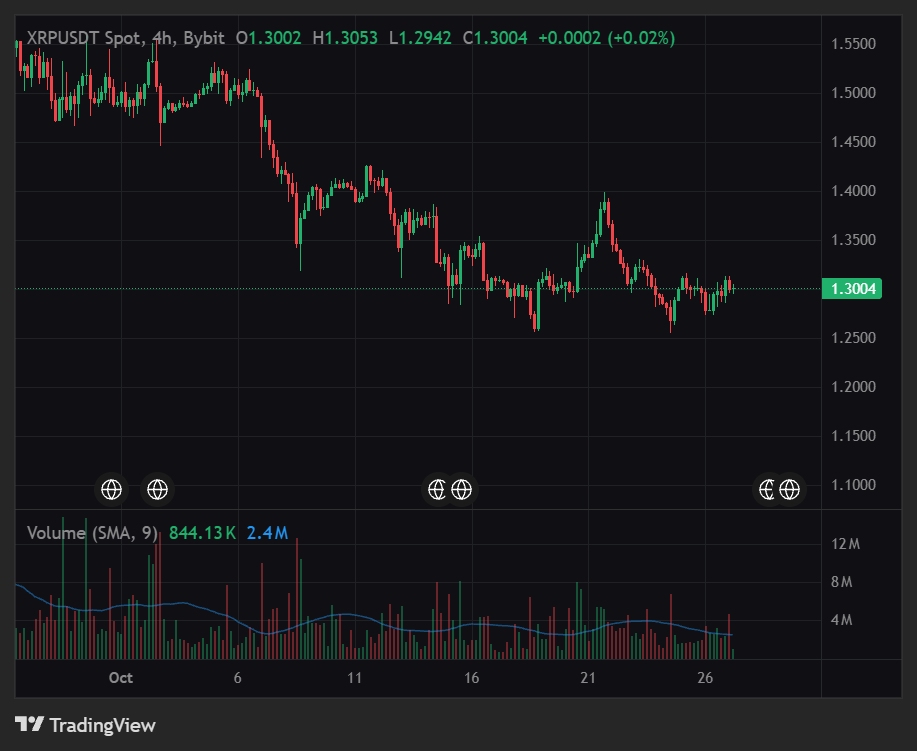
$XRP is testing a support zone $XRPUSDT Technical Analysis and Trading Setup XRP is struggling to get back into a bullish trend after a long pullback with the price sitting around $1.29. The price has been moving between $1.27 and $1.31 in the 24 hours, which means buyers are near a key support area. The main question now is whether XRP can hold the $1.26 level and start to recover or if sellers will push the price down to another support zone. Current Technical Picture * Trend Structure: The short-term trend is still under pressure with lower highs making it hard to recover. Buyers need to protect the $1.26 to $1.28 area and push the price back above $1.31 to $1.33 to create a bullish setup. A clear breakout would increase the chance of a recovery toward $1.40. * Moving Averages: The short-term momentum is still weak so a quick rise should not be seen as a confirmed trend change. Taking back the resistance zone and keeping it as support would be a sign that buyers are gaining control. * Volume and Liquidity: XRP is still seeing a lot of trading with data showing about $96M in 24-hour XRP/USDT trading volume on the market being tracked. However high volume alone does not mean there is accumulation. A breakout with buying would be a better sign. Trading Plan (Long Position) * Entry Zone: $1.2650 to $1.2850 (consider an entry only after support holds and buyers show confirmation) / breakout above $1.3320 * Target 1 (Take-Profit 1): $1.3400 * Target 2 (Take-Profit 2): $1.3700 * Target 3 (Main Target): $1.4000 * Stop-Loss: $1.2350 (below the support area) Risk Factors If XRP goes below $1.2600 and can't get back up the chance for a bullish recovery would drop a lot. More selling could lead to a drop and if the price is rejected at $1.3100 to $1.3320 it would mean buyers still don't have enough power to change the short-term trend. The key is to wait for confirmation of chasing a quick rise. Protecting money is more important, than forcing a trade when the market direction's still not clear. #ByXIMPACT #IMPACTbyTrade

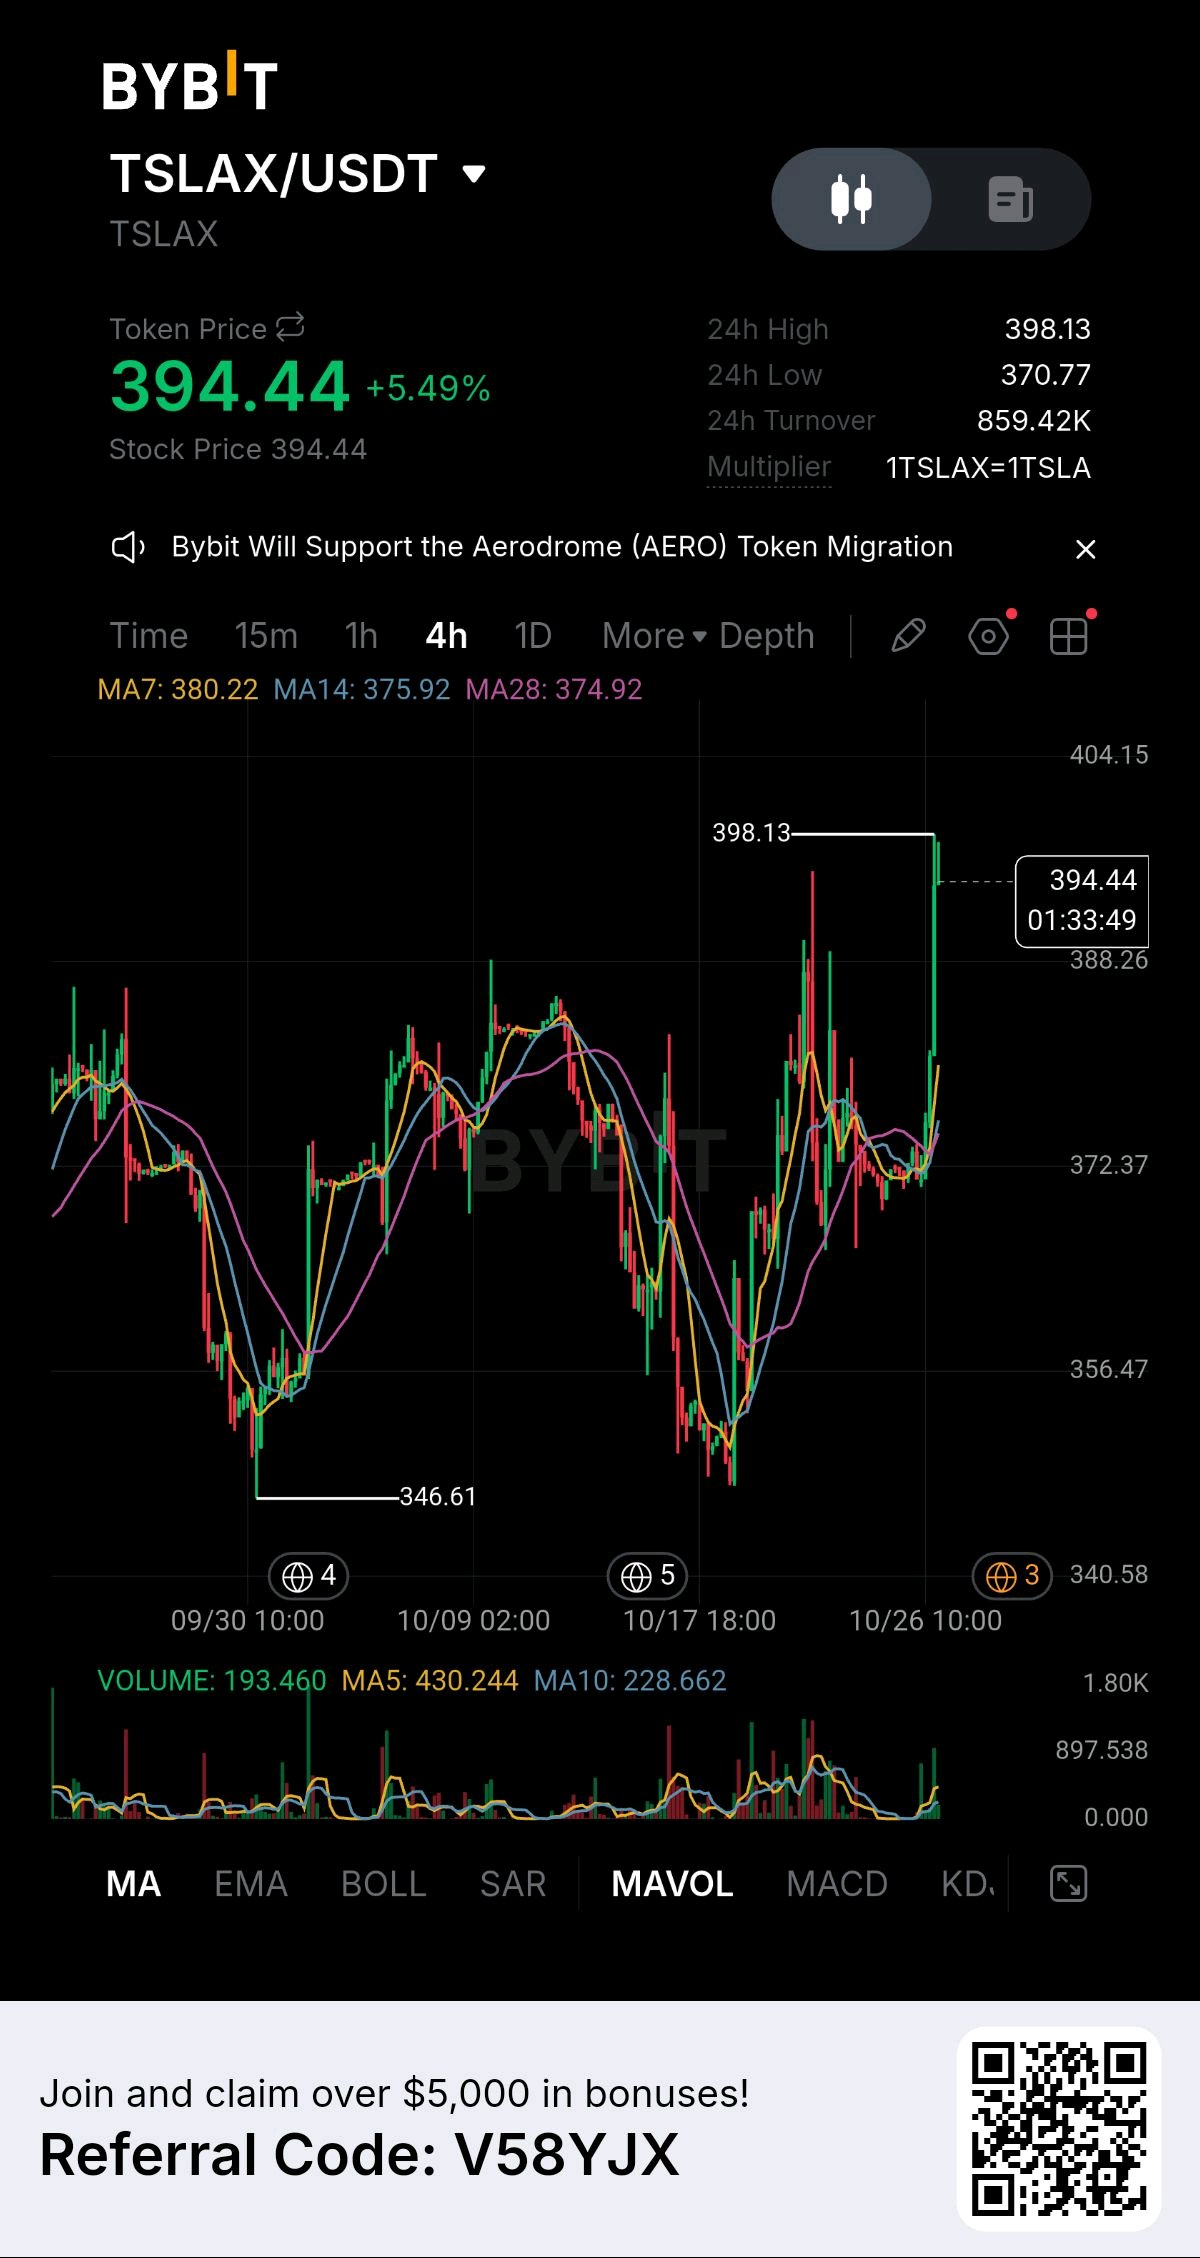
TSLAX is sitting with a circulating market around the $70M range and roughly 190k tokens outstanding, each designed to track one Tesla share on a 1:1 basis. That’s real tokenized equity exposure, not narrative. The valuation is the more interesting part. The token price continues to shadow the underlying Tesla stock closely on most venues, but the on-chain product itself remains a relatively small market compared with the size of Tesla’s public float. Liquidity is concentrated on a handful of CEXs and Solana DEXs, with daily volume typically in the low-to-mid millions rather than the tens or hundreds of millions seen in the traditional equity market. The on-chain footprint is multi-chain: TSLAX is available as an ERC-20/BEP-20 on Ethereum, Arbitrum and BNB Chain, and as an SPL token on Solana. It is issued with regulated custodians holding the actual shares, and it trades 24/7 — including when the U.S. equity market is closed. That continuous access is the core product feature. The quiet constraint is structural. Holders of TSLAX own a tokenized claim, not direct equity. There are no voting rights, no direct shareholder status, and any economic benefits (such as dividends, which Tesla does not currently pay) are handled through the token structure rather than corporate channels. Liquidity, spreads and overnight gaps can therefore diverge from the cash equity market, especially during low-volume periods or major Tesla news events outside regular trading hours. None of this says the product is wrong. It says the 24/7 crypto trading layer and the underlying equity market are still running on somewhat different clocks. Worth asking which friction — custody, liquidity depth, or regulatory access — closes first as more capital looks for on-chain equity exposure. #ByXIMPACT $TSLAXUSDT
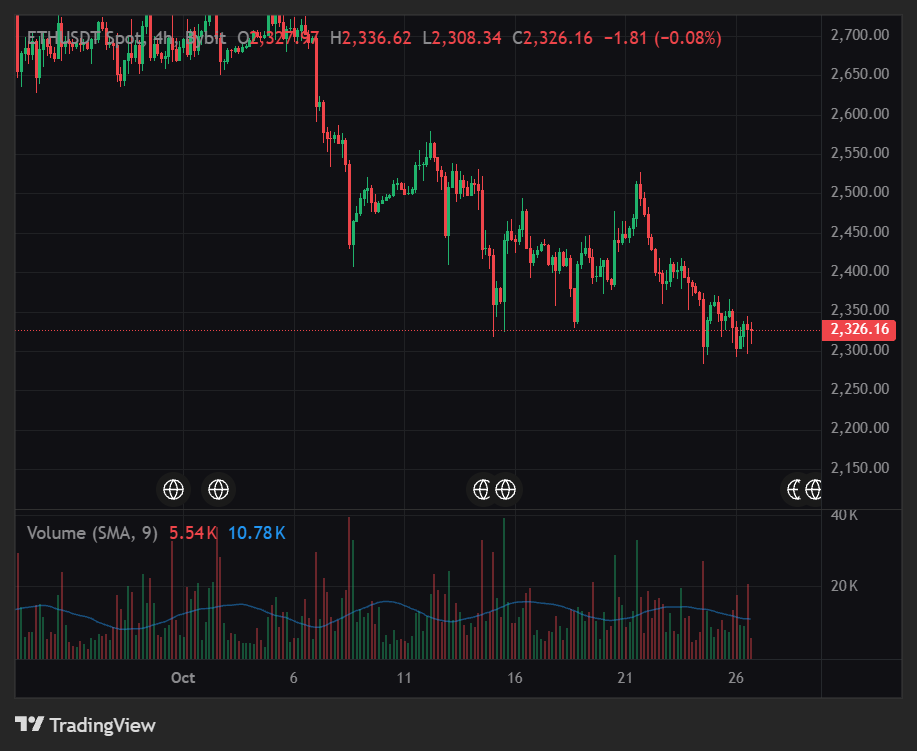
ETH/USDT is currently trading around $2,315 down 1.3% over the past 24 hours. The price has been moving between $2,293 and $2,365 showing that selling pressure is still present after the drop. Buyers are trying to hold the ground. A real recovery will need more proof. ETH has pulled back from the $2,520 level down to the $2,300 area. The drop shows that sellers are still active. However the $2,290 to $2,300 range is starting to act as a support zone where buyers may step in. A bounce from this area could open up a short-term recovery chance. Still one green candle is not enough to say the downtrend is over. Looking at the moving averages the short-term trend is still under pressure. For the recovery to become stronger buyers need to push nearby resistance and make higher lows. A sustained move above $2,365 would be a sign of improving strength. Until that happens any rally might face selling. Momentum is still cautious. ETH is trading near the end of its recent range. A rise supported by volume would make the outlook more bullish. On the hand a breakdown below support could lead to faster selling. Support 1 is at $2,290–$2,300 Support 2 is at $2,265–$2,280 support zone is at $2,230–$2,250 Resistance 1 is at $2,335–$2,365 Resistance 2 is at $2,390–$2,420 Major resistance zone is at $2,450–$2,480 The key level to watch is $2,365. If price breaks and holds above it the next targets are $2,390–$2,420. If buyers can reclaim that zone $2,450 becomes the big level to track. On the downside a clear break below $2,290 could open the way to $2,265–$2,280. After that the $2,230–$2,250 support zone could come into play. ETH is sitting near a support level.. The short-term trend is still weak. Buyers must show strength with a confirmed breakout. A simple bounce won't be enough. Watch price behavior and volume before making any trade decisions. **Bullish setup** Entry: $2,365–$2,380 after a confirmed breakout and a successful retest Stop-loss: $2,325 Take-profit 1: $2,400 Take-profit 2: $2,450 Take-profit 3: $2,480 This setup fails if price falls back below the breakout zone. **Bearish setup** Entry: $2,285–$2,295 after a confirmed breakdown and a failed retest Stop-loss: $2,335 Take-profit 1: $2,265 Take-profit 2: $2,250 Take-profit 3: $2,230 This setup fails if ETH reclaims $2,335 and stays above it. Invalidate the case if price moves above $2,420. The bearish case invalidates if price breaks below $2,265. These are trade ideas based on the current market structure, not guarantees. Always check the chart. Avoid chasing price spikes. Size your positions according to the distance, between entry and stop-loss. This is not a recommendation. It is an update. #ByXIMPACT $ETHUSDT
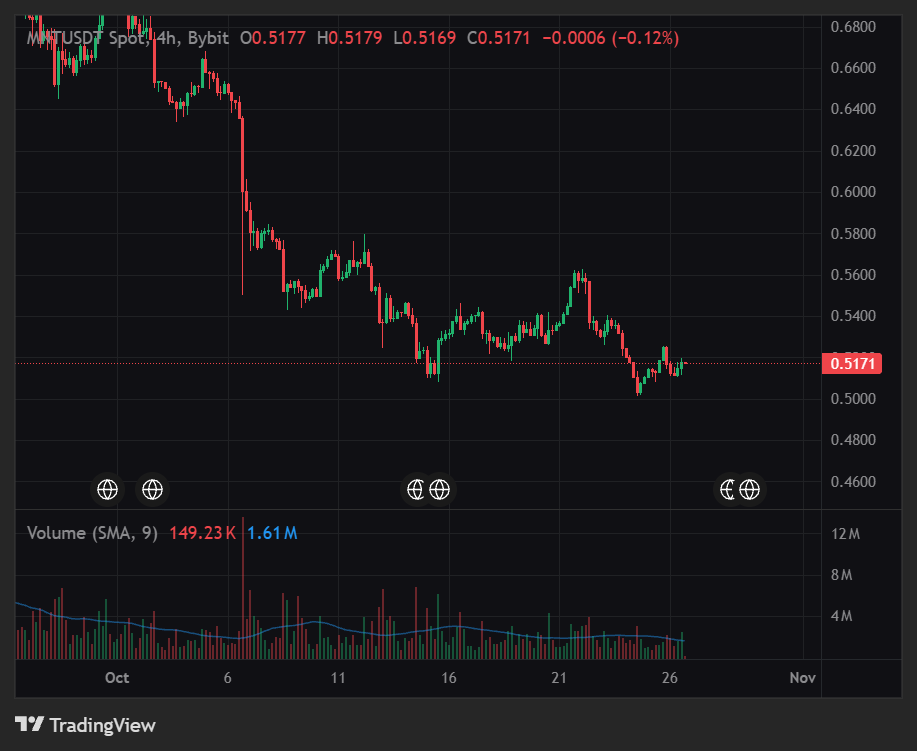
MNT/USDT — Market Update MNT is showing signs of short-term stabilization after facing significant selling pressure over the past month. The price is trading around $0.518, with buyers attempting to defend the $0.500 support zone. The key thesis for a potential long position is based on maintaining this support and building enough momentum to challenge the $0.530 resistance level. However, the broader trend remains under pressure, and the recent recovery is not yet a confirmed reversal. Buyers need to reclaim nearby resistance and sustain the move with stronger trading volume. If support holds, MNT could attempt a recovery toward higher levels, but a breakdown could extend the current weakness. **Data & Risk Analysis** * **Bullish scenario** * **Entry point ($0.505–$0.515):** This zone may offer a potential entry if buyers defend support and price action confirms a bullish reaction. Avoid entering without confirmation, especially while the broader trend remains weak. * **Movement potential ($0.530 → $0.550):** The first target near $0.530 represents an important local resistance area. A confirmed breakout with stronger buying volume could open the way toward $0.550. * **Moving averages:** Short-term indicators show mixed momentum, while longer-term moving averages continue to reflect selling pressure. A sustained recovery above resistance would improve the bullish outlook. * **Trading volumes:** Stronger volume during an upward move would support the recovery thesis. A price increase without meaningful volume could struggle to sustain itself. * **Risk factors and unfavorable scenarios:** * **Broader market weakness:** A sharp decline in Bitcoin or a wider altcoin sell-off could push MNT below its current support zone. * **Support breakdown ($0.500):** A decisive four-hour candle close below $0.500 would weaken the bullish structure and increase the risk of a move toward $0.480. **3. Trading Plan** **MNT / LONG** * **Buy Entry:** $0.505–$0.515, after bullish confirmation * **TP1:** $0.530 * **TP2:** $0.540 * **TP3:** $0.550 * **SL Level:** $0.495 **Market Outlook:** MNT is attempting to stabilize, but buyers still need to prove that the recovery has enough strength to overcome resistance. Watch the $0.500 support and $0.530 breakout level closely. If price loses support, protecting capital should take priority over maintaining a bullish bias. This is a conditional trading setup, not a guaranteed outcome. Confirm current prices before entering and always manage risk carefully. #ByXIMPACT $MNTUSDT
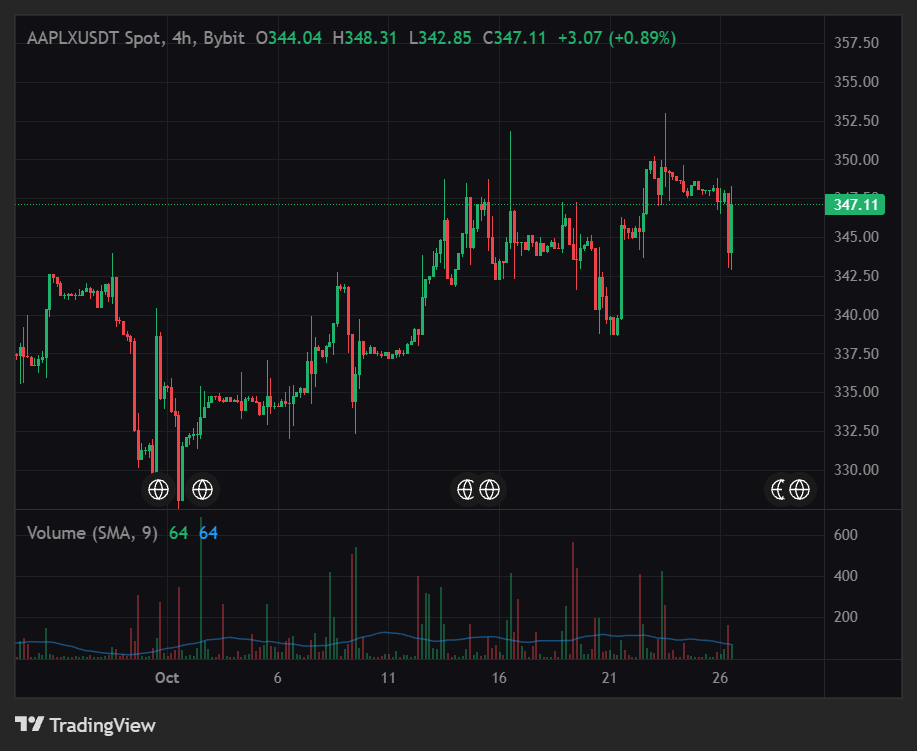
AAPLX/USDT — Market Update AAPLX is approaching an important technical zone where the next move will depend on whether buyers can maintain support and push the price above local resistance. The key thesis for a potential long position is based on a successful support retest followed by a recovery in buying momentum. However, confirmation is necessary before expecting a sustained upward move. The current trading structure should be evaluated through short-term price action, moving averages, and trading volume. A clear break above resistance could create an opportunity for further upside, while a rejection may lead to another support test. Entering too early without confirmation could expose the position to unnecessary risk. Data & Risk Analysis Bullish scenario Entry point: Consider entering after a confirmed support retest and a clear bullish reaction. The ideal setup is one where buyers defend the level and price begins forming higher lows. Movement potential: The first target should be the nearest confirmed resistance, followed by the next resistance zone if buying momentum strengthens. A sustained breakout could support further upside, but each target depends on market conditions. Moving averages: Reclaiming short-term moving averages could indicate improving momentum. Continued trading below them would suggest that the recovery remains uncertain. Trading volumes: Rising volume during a resistance breakout would strengthen the bullish scenario. Weak participation could increase the risk of a false breakout. Risk factors and unfavorable scenarios: Underlying market weakness: A decline in the broader equity market could put additional pressure on AAPLX and weaken the bullish setup. Support breakdown: A decisive four-hour candle close below confirmed support would invalidate the long thesis and increase the risk of further downside. Avoid holding the position if the setup fails. 3. Trading Plan AAPLX / LONG Buy Entry: After a confirmed support retest Target Zone: First resistance → Second resistance → Breakout extension SL Level: Below confirmed support Market Outlook: AAPLX needs to demonstrate sustained buying pressure before a bullish continuation becomes convincing. Wait for a clear entry signal, manage position size carefully, and avoid chasing sudden price movements. This is a conditional trading scenario, not a guaranteed outcome. Confirm current price levels before entering and always manage your risk. #ByXIMPACT $AAPLXUSDT

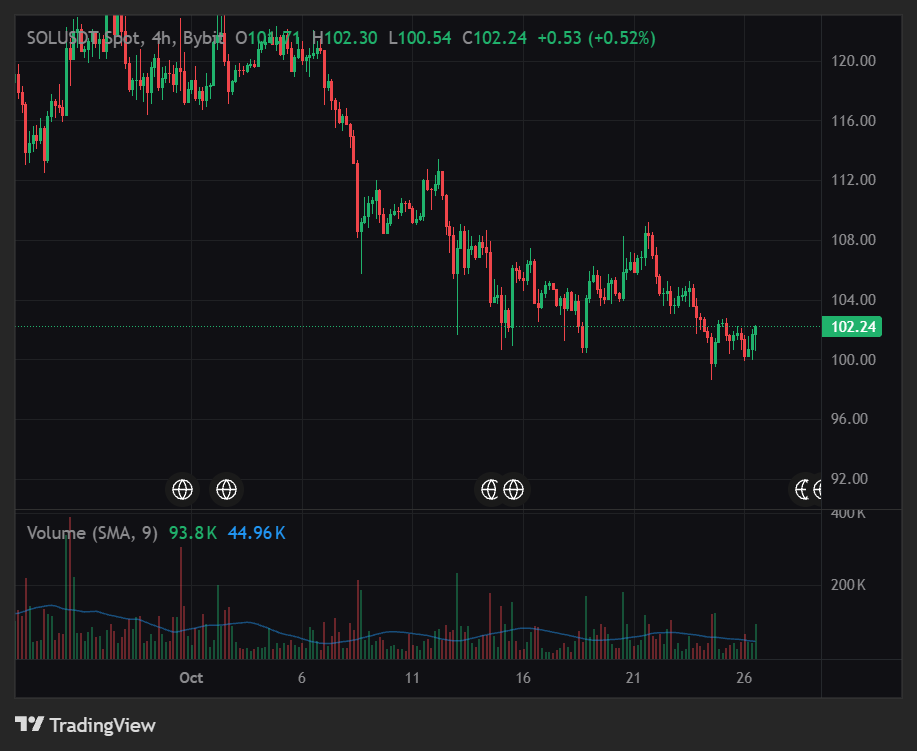
SOL/USDT — Market Update SOL is approaching an important decision zone as traders look for signs of a sustained recovery. The key thesis for a potential long position is based on buyers defending nearby support and building enough momentum to challenge local resistance. However, a clear breakout confirmation is still important before expecting a stronger upward move. If buyers regain control of the short-term trend and maintain higher lows, SOL could establish a foundation for further upside. A breakout supported by increasing trading volume would strengthen the bullish scenario, while repeated rejection at resistance could lead to another support retest. Data & Risk Analysis Bullish scenario Entry point: Consider a long entry near a confirmed support retest after buyers demonstrate strength. Avoid entering simply because the price is falling into a potential support zone. Movement potential: The first target should be the nearest confirmed resistance, followed by higher resistance levels if bullish momentum continues. Each breakout should be supported by stronger buying activity. Moving averages: A recovery above the short-term moving averages could indicate improving momentum. If SOL remains below them, sellers may still control the local trend. Trading volumes: Increasing volume during an upward breakout would support the bullish case. Weak volume could increase the likelihood of a false breakout. Risk factors and unfavorable scenarios: Bitcoin correction: A sudden decline across the broader crypto market could increase selling pressure on SOL and weaken the recovery setup. Support breakdown: A decisive four-hour candle close below the confirmed support level would invalidate the bullish structure and could expose SOL to further downside. 3. Trading Plan SOL / LONG Buy Entry: After a confirmed support retest Target Zone: Nearest resistance → Higher resistance levels SL Level: Below the confirmed support zone Market Outlook: SOL needs to demonstrate consistent buying pressure before a stronger bullish continuation becomes convincing. Wait for confirmation, protect your capital, and avoid chasing sudden price movements. This is a technical market scenario, not a guaranteed outcome. Always manage risk before entering a trade. #ByXIMPACT $SOLUSDT
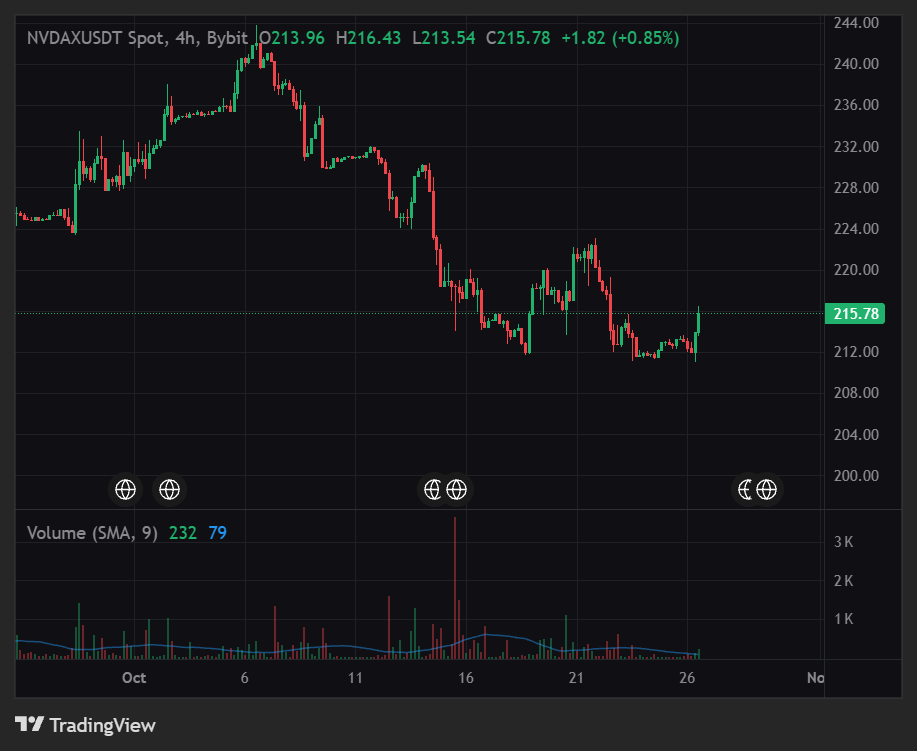
NVDAX/USDT — Price Stabilizes Near $212 as Traders Watch Resistance NVDAX/USDT is trading around $212.25, showing a modest recovery after recent selling pressure. Price is moving within an approximate 24-hour range of $210.84–$213.55. The market is attempting to stabilize, but buyers still need to break through nearby resistance before a stronger recovery can be confirmed. Context NVDAX has pulled back from its recent highs near $240 and is now trading around $212. The broader short-term structure remains under pressure, although the latest price action suggests some stabilization near $210–$211. A bounce from support could create a recovery opportunity, but continued rejection near resistance may lead to another test of lower levels. Moving-Average Structure The recent decline has weakened the short-term structure. Rather than assuming a bullish reversal, traders should watch whether price can reclaim nearby resistance and establish higher lows. A sustained move above $216 would improve the recovery outlook, while continued trading below this level would keep the market vulnerable to further selling. Momentum Price is consolidating after a broader pullback. Momentum could improve if buyers break above the recent intraday high with stronger trading activity. However, a move below $210.80 would suggest that sellers are regaining control. Support and Resistance Support 1: $210.80–$211.00 Support 2: $208.50–$209.00 Major support zone: $205.00–$206.00 Resistance 1: $213.50–$214.00 Resistance 2: $216.00–$218.00 Major resistance zone: $220.00–$222.00 Level to Watch A sustained move above $214 could open the way toward $216–$218. If buyers reclaim that zone, $220–$222 becomes the next area to monitor. On the downside, a decisive break below $210.80 could expose $208.50–$209.00, followed by the $205–$206 support zone. Consideration NVDAX represents a tokenized stock-linked asset. Its price can be influenced by the underlying equity value, market liquidity, and differences between token trading conditions and traditional stock-market hours. These factors can create additional volatility and price-tracking risks. Trade Plan Bullish setup Entry: $213.80–$214.20 after a confirmed breakout and successful retest Stop-loss: $211.80 Take-profit 1: $216.00 Take-profit 2: $218.00 Take-profit 3: $221.00 The bullish setup weakens if price falls back below the reclaimed breakout zone. Bearish setup Entry: $210.50–$210.80 after a confirmed breakdown and failed retest Stop-loss: $213.00 Take-profit 1: $209.00 Take-profit 2: $206.00 Take-profit 3: $203.00 The bearish setup weakens if price reclaims $213 and holds above it. Invalidation and Risk A sustained move above $218 would strengthen the recovery scenario. A decisive break below $208.50 would increase downside risk. These levels are conditional reference points based on the latest available market snapshot, not guaranteed outcomes. Check the live chart before entering, avoid chasing sudden candles, and size positions according to the distance between entry and stop-loss. Not a call — a structural update. #ByXIMPACT $NVDAXUSDT
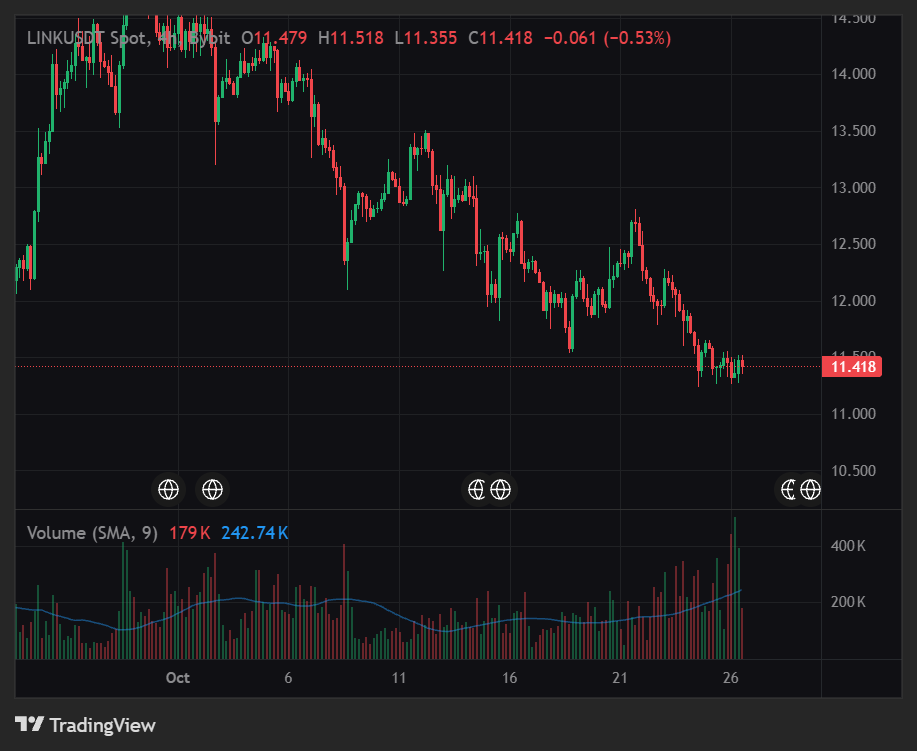
LINK/USDT — Buyers Defend Support, But the Downtrend Remains a Concern LINK/USDT is trading around $11.45, showing a modest recovery after a sharp decline from the $15.50 area. Price is attempting to stabilize near an important support zone, but the broader short-term structure remains weak. Buyers need to reclaim nearby resistance before a sustained bullish reversal becomes convincing. Context LINK has lost more than 25% from its late-September highs. The latest price action shows some stabilization around $11.30–$11.45, but sellers still have the advantage while price remains below major short-term resistance. A small bounce is not enough to confirm a trend reversal. Moving-Average Structure Price remains below the 50-day moving average near $12.30 and the 100-day average around $11.50–$11.55. The 200-day average near $11.00 is an important longer-term reference. Reclaiming $11.65 would be an early sign of improving momentum, while a move above $11.90–$12.00 would provide stronger evidence of recovery. Momentum The daily RSI is around 36, indicating weak momentum, while the MACD remains bearish. This suggests selling pressure is still present, although a short-term rebound is possible if buyers defend support. Support and Resistance Support 1: $11.25–$11.30 Support 2: $10.90–$11.00 Major support zone: $10.50–$10.60 Resistance 1: $11.60–$11.67 Resistance 2: $11.90–$12.00 Major resistance zone: $12.25–$12.35 Level to Watch A sustained move above $11.67 could open the way toward $11.90–$12.00. A stronger recovery above $12.00 would improve the bullish outlook. On the downside, a decisive break below $11.25 could expose the $10.90–$11.00 support zone. If that area fails, further downside toward $10.50 becomes possible. Consideration The current structure favors caution rather than aggressive buying. LINK is approaching an important support area, but there is not yet clear confirmation that buyers have regained control. Watch for a successful retest, stronger volume, and improving momentum before committing to a directional trade. Trade Plan Bullish setup Entry: $11.65–$11.70 after a confirmed breakout and successful retest Stop-loss: $11.25 Take-profit 1: $11.94 Take-profit 2: $12.00 Take-profit 3: $12.30 This setup becomes less attractive if price breaks back below the reclaimed resistance zone. Bearish setup Entry: $11.20–$11.25 after a confirmed breakdown and failed retest Stop-loss: $11.67 Take-profit 1: $11.00 Take-profit 2: $10.90 Take-profit 3: $10.50 This setup weakens if price reclaims $11.67 and holds above it. Invalidation and Risk A sustained move above $12.00 would weaken the immediate bearish outlook. A decisive daily close below $11.00 would increase downside risk. These are conditional setups based on the latest available market snapshot, not guaranteed outcomes. Check the live price before entering, account for fees and slippage, and size each position according to your stop-loss distance. Not a call — a structural update. #ByXIMPACT $LINKUSDT

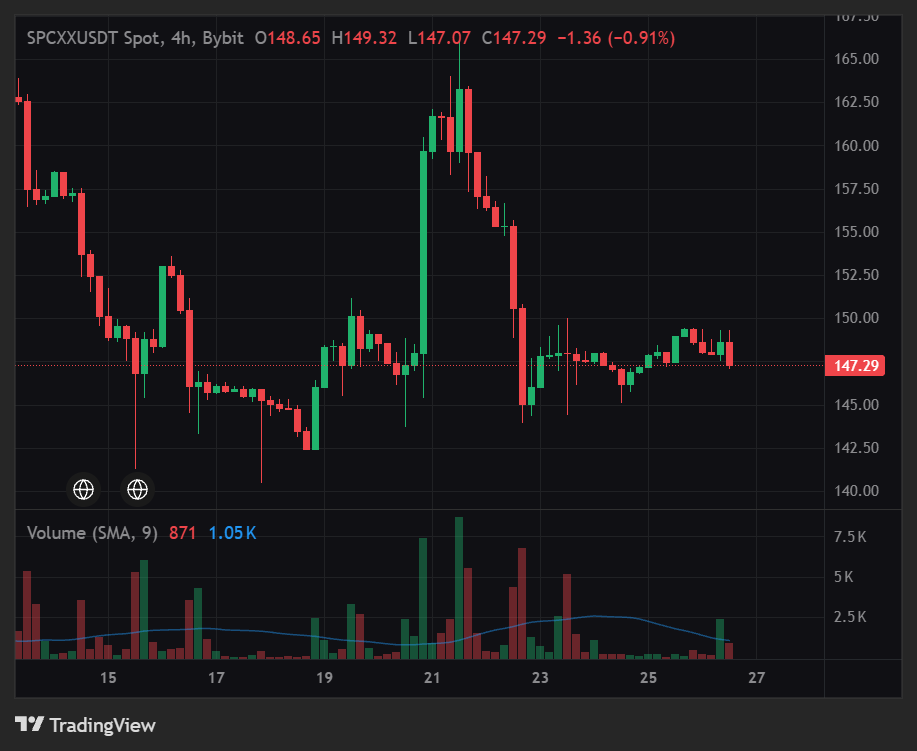
SPCXX/USDT — Price Holds Near $148 as Traders Watch the Next Breakout SPCXX/USDT is trading around $148.35, moving within a tight intraday range of approximately $147.35–$149.42. Price is consolidating after recent weakness, with buyers attempting to defend the current support zone. The next directional move will depend on whether buyers can reclaim resistance or sellers push price toward lower levels. Context SPCXX has pulled back from its recent highs near $170 and is now stabilizing around $148. The latest price action suggests the market is searching for a short-term base, but a clear reversal has not yet been confirmed. Trading activity remains important because a breakout without sufficient participation may quickly lose momentum. Moving-Average Structure The short-term structure remains cautious following the recent decline. A sustained recovery above nearby resistance would improve the outlook, while continued rejection below the $150 area could keep sellers in control. Moving-average readings should be checked on the live chart before using them to confirm a trade. Momentum Price is consolidating near the lower end of its recent range. This can create an opportunity for a recovery if buyers step in, but it can also lead to another decline if support fails. A confirmed breakout supported by stronger volume would provide a clearer signal. Support and Resistance Support 1: $147.00–$147.50 Support 2: $145.00–$146.00 Major support zone: $142.00–$144.00 Resistance 1: $149.50–$151.00 Resistance 2: $154.00–$157.00 Major resistance zone: $160.00–$165.00 Level to Watch A sustained move above $151 could open the way toward $154–$157. If buyers maintain momentum beyond that zone, $160 becomes the next area to monitor. On the downside, a break below $147 could expose $145–$146, followed by the $142–$144 support zone. Consideration SPCXX is a tokenized stock-linked asset, so its price can be influenced by the underlying equity valuation as well as token liquidity and market conditions. Token trading can continue outside traditional equity-market hours, and price differences or thinner liquidity may increase execution risk. Trade Plan Bullish setup: Entry zone: $149.50–$151.00 after a confirmed breakout and successful retest. Stop-loss: $147.00. Take-profit 1: $154.00. Take-profit 2: $157.00. Take-profit 3: $160.00. Bearish setup: Entry zone: $146.50–$147.00 after a confirmed breakdown and failed retest. Stop-loss: $149.50. Take-profit 1: $145.00. Take-profit 2: $143.00. Take-profit 3: $140.00. These are conditional setups based on the current reference range. Recheck live prices before entering, as a gap or rapid move can change the risk-to-reward calculation. Invalidation and Risk A sustained move above $151 would strengthen the recovery scenario. A decisive break below $145 would increase downside risk. Avoid chasing sudden candles, and size positions according to the distance to your stop-loss. Not a call — a structural update. #ByXIMPACT $SPCXXUSDT

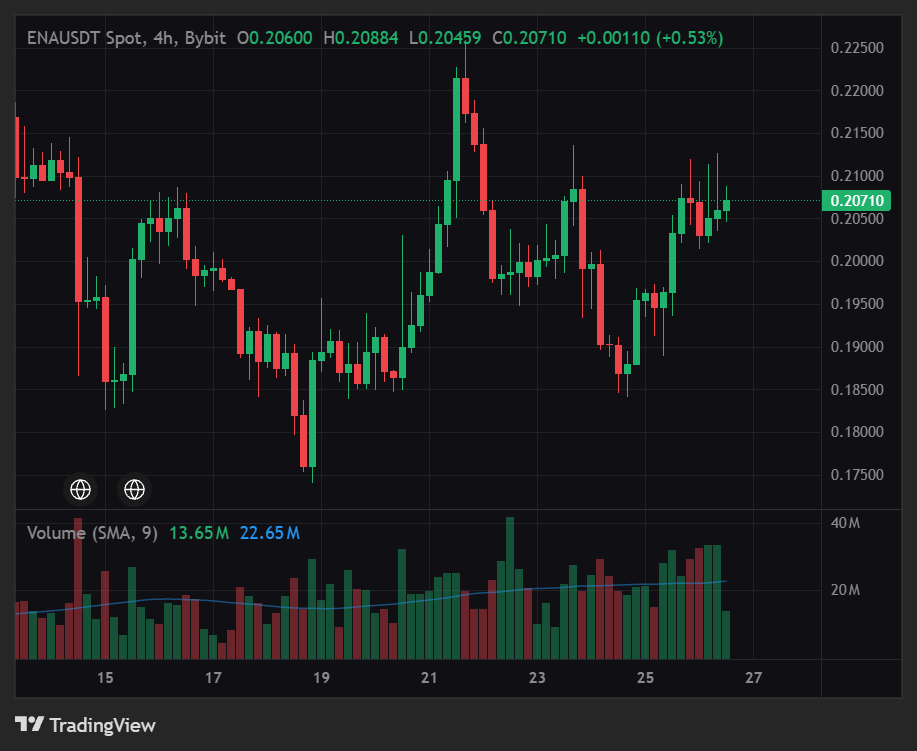
ENAUSDT Market Update* ENA is pushing toward its 24h high near 0.2126 after a strong recovery, with buyers trying to keep the momentum alive. The short-term picture looks promising, but price is approaching resistance where sellers could step in. I wouldn't chase the move here. I'd rather wait for a controlled pullback and see if buyers can defend the support zone before entering. Entry: 0.2050 - 0.2080 TP1: 0.2125 TP2: 0.2180 TP3: 0.2240 SL: 0.2010 A clean break below 0.2030 would weaken this setup and signal that buyers are losing control. Stay patient, protect your capital, and don't let a green candle make the decision for you. These levels are based on the latest available market data and may change with price action. This isn't financial advice. I'm not a financial advisor, so manage your position size carefully, especially when using leverage. #ByXIMPACT #WSOT2026 #IMPACTbyTrade #MyByXTake $ENAUSDT
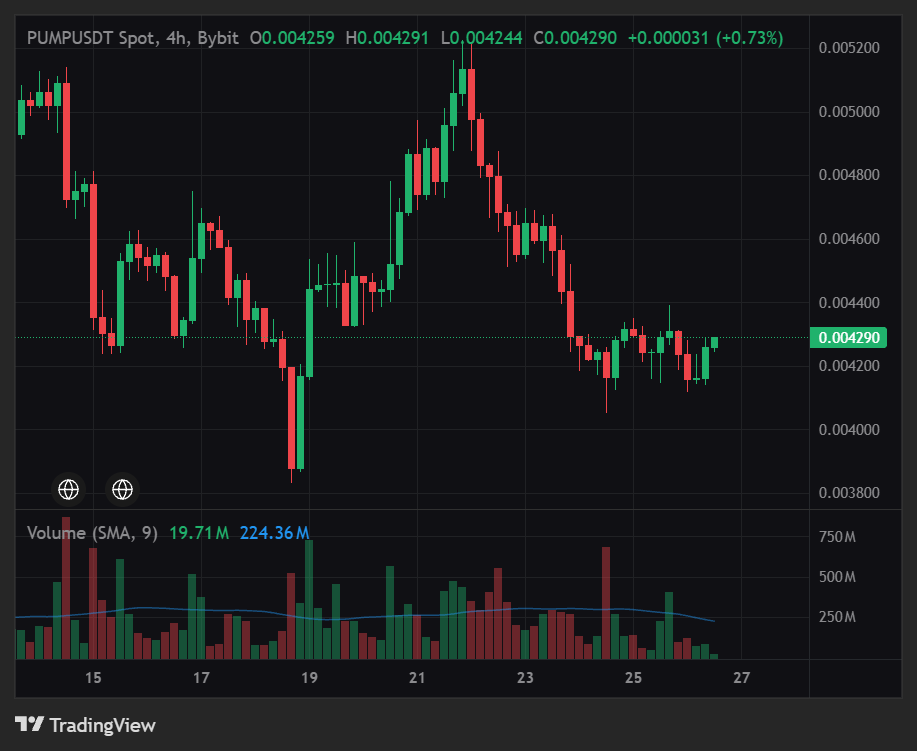
PUMP/USDT — Market Update PUMP is approaching an important decision zone as buyers attempt to stabilize the price after recent market pressure. The key thesis for a potential long position is based on the defense of the $0.00400 support area and the possibility of a recovery toward nearby resistance. However, the market still needs stronger buying momentum to confirm a sustained upward move. Buyers need to reclaim short-term resistance and maintain support to improve the bullish structure. A breakout supported by rising volume could open the way toward higher price levels, while a rejection may lead to another test of lower support. Patience and confirmation are important before entering a position. Data & Risk Analysis Bullish scenario Entry point ($0.00405–$0.00415): A potential entry zone if buyers defend support and price action confirms a recovery. Avoid entering solely because the price touches this area. Movement potential ($0.00430 → $0.00455): The first target near $0.00430 represents a potential local resistance test. If buyers break through this level with strong volume, the next target is around $0.00455. Trading volumes: Increasing buying volume during a resistance breakout would strengthen the bullish case. Weak volume or repeated rejection could signal that buyers lack sufficient momentum. Risk factors and unfavorable scenarios: Bitcoin correction: A sharp decline across the broader crypto market could increase selling pressure on PUMP and invalidate the recovery setup. Support breakdown ($0.00395): A decisive four-hour candle close below this level would weaken the bullish structure and expose the price to further downside. Avoid holding a long position if the setup is invalidated. 3. Trading Plan PUMP / LONG Buy Entry: $0.00405–$0.00415, after confirmation of support TP1: $0.00430 TP2: $0.00445 TP3: $0.00455 SL Level: $0.00395 Market Outlook: The setup remains conditional on buyers defending support and reclaiming resistance. Wait for confirmation, manage position size carefully, and avoid chasing sudden price spikes. This is a technical scenario, not a guaranteed outcome. Always manage risk before entering a trade. #ByXIMPACT #WSOT2026 #IMPACTbyTrade #MyByXTake $PUMPUSDT
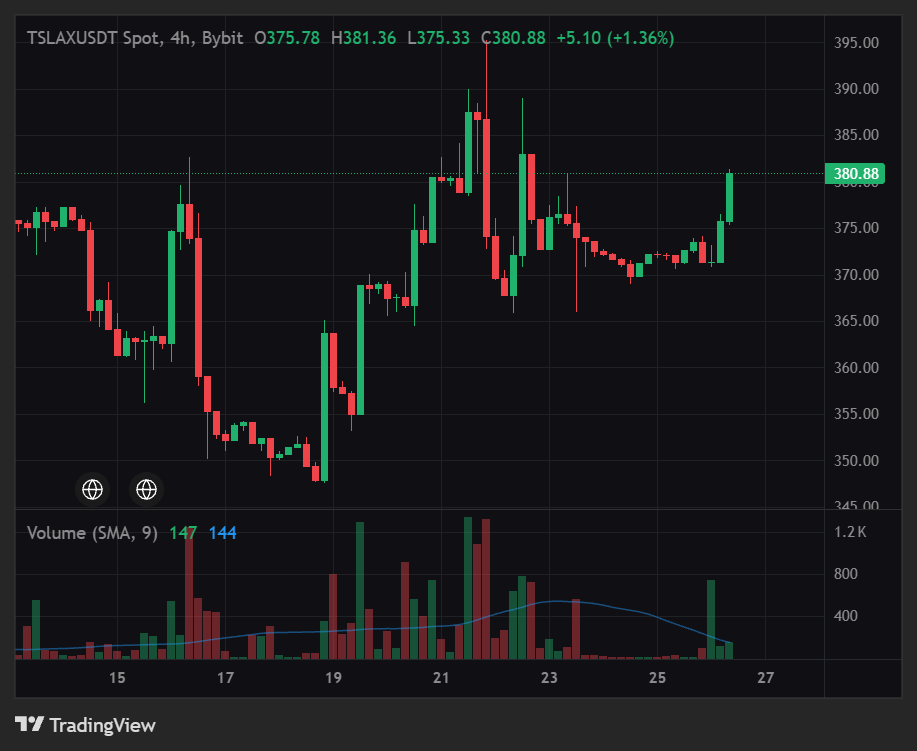
TSLAX/USDT — Buyers Need to Reclaim Resistance TSLAX/USDT is stabilizing after a pullback from the $380 area. The key question is whether buyers can defend support and push price through resistance. Until a breakout is confirmed, both bullish and bearish scenarios remain possible. Support and Resistance Support 1: $368–$370 Support 2: $362–$365 Major support: $355–$360 Resistance 1: $375–$378 Resistance 2: $382–$388 Major resistance: $395–$400 Bullish Trade Plan Entry: $375–$378, only after a breakout and successful retest Stop-loss: $368 Take-profit 1: $382 Take-profit 2: $388 Take-profit 3: $395 The bullish setup weakens if price falls below the reclaimed resistance zone. Avoid entering if price has already moved too far beyond the planned entry. Bearish Trade Plan Entry: $367–$368, only after a confirmed breakdown and failed retest Stop-loss: $375 Take-profit 1: $365 Take-profit 2: $360 Take-profit 3: $355 The bearish setup weakens if price reclaims $375 and holds above it. Risk Management These are conditional plans, not guaranteed outcomes. Risk only a small, predefined portion of your trading capital, and calculate position size based on the distance between entry and stop-loss. Tokenized stock assets can experience liquidity gaps and price-tracking differences, so stop orders may execute at a worse price than expected. Not a call — a structural update. do everything at your own research DYOR #ByXIMPACT $TSLAXUSDT

TSLAX/USDT — Price Stabilizes Near $372 as Traders Watch Resistance TSLAX/USDT is trading around $372 based on the latest available market snapshot, following a pullback from the $380 area. Price is attempting to stabilize, but buyers still need to reclaim nearby resistance before a stronger bullish continuation becomes convincing. Context TSLAX has recovered from the $350 area and recently moved toward $380 before losing some momentum. The recovery shows renewed buying interest, but the latest pullback suggests sellers remain active near resistance. The next move depends on whether buyers can defend the current support zone. Moving-Average Structure The short-term structure is mixed after the recent pullback. Holding above nearby support could help price build a stronger base, while reclaiming the $378–$382 area would improve the recovery outlook. A breakdown below support would suggest the market needs more time to stabilize. Momentum Price is consolidating after a recent recovery, leaving room for movement in either direction. A breakout supported by stronger trading activity would provide better confirmation than a quick move above resistance followed by an immediate rejection. Support and Resistance Support 1: $368–$370 Support 2: $362–$365 Major support zone: $355–$360 Resistance 1: $375–$378 Resistance 2: $382–$388 Major resistance zone: $395–$400 Level to Watch A sustained move above $378 could open the way toward $382–$388. If buyers reclaim that zone, the $395–$400 area becomes the next level to monitor. On the downside, a break below $368 could expose the $362–$365 support zone and potentially bring $355–$360 into focus. Consideration TSLAX represents a tokenized stock-linked asset, so its price can be influenced by the underlying equity market as well as token liquidity and trading conditions. Crypto trading activity may also differ from traditional stock-market hours. These factors can affect price tracking and short-term volatility. Trade Plan Bullish setup: Wait for a confirmed breakout above $378 and a successful retest. Potential targets are $382, $388, and $395 as an extended target. Reassess if price falls back below the reclaimed breakout zone. Bearish setup: If price breaks below $368 and fails to reclaim it, downside levels to watch are $365 and $360, with $355 as an extended target. A sustained recovery above $378 would weaken this bearish setup. Invalidation and Risk A sustained move above $388 would strengthen the recovery structure. A decisive break below $362 would increase downside risk. Avoid chasing sudden moves, and account for liquidity and price-tracking risks when managing position size. Not a call — a structural update. #ByXIMPACT $TSLAXUSDT

ERA/USDT — Buyers Take Control, But Can Price Hold
ERA/USDT is trading around $0.093–$0.095, up roughly 20–25% over the past 24 hours. Price has rebounded sharply from the $0.07 area and recently tested resistance near $0.10. Momentum is clearly stronger, but after such a fast move, short-term pullbacks and profit-taking remain possible. Context ERA has been building upward momentum after recovering from its recent lows near $0.054. The latest rally has brought price back toward the $0.10 psychological level, with elevated trading activity supporting the move. However, a sharp rally can attract both fresh buyers and sellers looking to secure profits. Moving-Average Structure The short-term structure has improved, with price trading above several key moving averages on the daily chart. This supports the recovery, although the next test is whether ERA can hold above nearby support after its rapid advance. A loss of the breakout area would weaken the bullish structure. Momentum Momentum indicators are showing a bullish bias, but volatility is elevated. Price is approaching a resistance zone where a rejection could trigger a temporary correction. A sustained breakout with continued trading activity would provide stronger confirmation of further upside. Support and Resistance Support 1: $0.088–$0.090 Support 2: $0.082–$0.085 Major support zone: $0.074–$0.078 Resistance 1: $0.098–$0.100 Resistance 2: $0.104–$0.106 Major resistance zone: $0.110–$0.116 Level to Watch A sustained move above $0.100 could open the way toward $0.104–$0.106, followed by the $0.110–$0.116 zone. However, rejection near $0.10 followed by a break below $0.088 could signal that the rally is losing strength. Consideration The strong price increase and elevated trading activity suggest renewed market interest. Still, rapid gains can reverse quickly, especially when price approaches a major psychological resistance level. Chasing the rally without confirmation could expose traders to a sharp pullback. Trade Plan Bullish setup: Wait for a confirmed breakout above $0.100 and a successful retest. Potential targets are $0.104 and $0.110, with $0.116 as an extended target. Reassess if price falls back below the reclaimed breakout zone. Bearish setup: If ERA breaks below $0.088 and fails to reclaim it, downside levels to watch are $0.085 and $0.078. A strong recovery above $0.095 would weaken this bearish setup. Invalidation and Risk A sustained move above $0.100 would strengthen the bullish continuation scenario. A decisive loss of $0.082 would put the current recovery under greater pressure. Avoid chasing sudden candles, and use position sizes that account for ERA's elevated volatility. Not a call — a structural update. $ERAUSDT #MyByXTake #ByXIMPACT

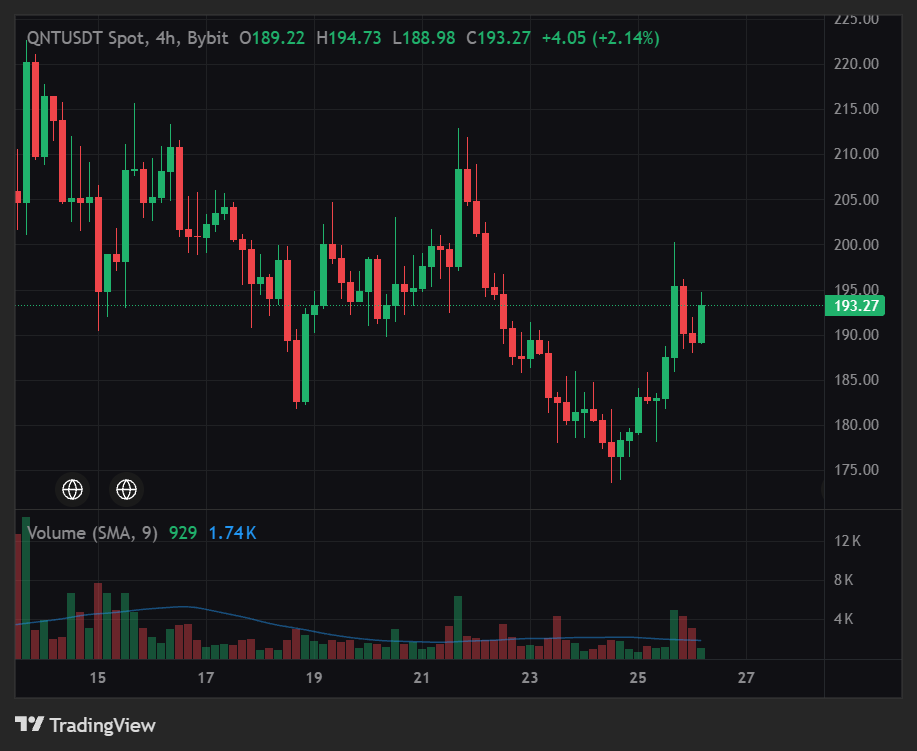
QNT/USDT — Buyers Are Back, But Can the Recovery Continue? QNT/USDT is trading around $189, up roughly 3–4% over the past 24 hours. After a strong rebound from recent lows, buyers are attempting to regain control. However, price is approaching an important resistance zone where sellers could step in again. QNT has recovered after recent selling pressure, with the latest bounce bringing price back toward $190. The broader recovery looks constructive, but the market still needs to break through nearby resistance before a stronger bullish continuation becomes convincing. **Moving-Average Structure** QNT remains above its important longer-term moving averages, supporting the broader recovery structure. However, short-term averages around $190–$198 may create resistance. A sustained move above this area would strengthen the bullish case. **Momentum** Momentum has improved following the rebound, while the daily RSI remains near neutral territory. This leaves room for further movement in either direction. The key question is whether buyers can maintain pressure without allowing price to fall back into the previous range. **Support and Resistance** Support 1: $187–$189 Support 2: $183–$185 Major support zone: $174–$178 Resistance 1: $193–$198 Resistance 2: $200–$205 Major resistance zone: $211–$216 $QNTUSDT Level to Watch** A sustained move above $198 could open the way toward $200–$205, followed by the $211–$216 zone. On the downside, losing $187 could weaken the recovery and bring lower support levels into focus. **Consideration** The recent rebound is encouraging, but one strong move does not guarantee a sustained uptrend. Watch how price behaves around $193–$198, especially whether buyers can hold a breakout rather than allowing a quick rejection. Trade Plan Bullish setup:** Wait for a confirmed breakout above $198 and a successful retest. Potential targets are $205 and $211, with $216 as an extended target. Reassess if price falls back below the reclaimed resistance zone. **Bearish setup:** If QNT breaks below $187 and fails to reclaim it, downside levels to watch are $183 and $178. A recovery above $193 would weaken this bearish setup. **Invalidation and Risk** A sustained move above $198 would strengthen the bullish outlook, while a decisive break below $183 would put the recovery under greater pressure. Avoid chasing sudden candles, and manage risk carefully around volatile price swings. Not a call — a structural update. #ByXIMPACT #MyByXTake

XAUT/USDT — Gold Holds Near $4,000 as Traders Watch the Next Move XAUT/USDT is trading around $3,997, showing a modest daily recovery after recent selling pressure. Price is stabilizing near the $4,000 psychological level, but the broader short-term structure still needs confirmation before calling it a bullish reversal. **Context** XAUT has pulled back from the $4,300 area toward the $4,000 zone. The recent slowdown in selling suggests the market may be trying to establish support, although a small bounce alone does not confirm that buyers have regained control. **Moving-Average Structure** The key question is whether price can reclaim short-term moving averages and hold above them. Until that happens, recovery attempts could face renewed selling pressure. **Momentum** The market is consolidating near a psychological level. A stronger move above nearby resistance would improve the recovery outlook, while a fresh rejection could bring support levels back into focus. **Support and Resistance** Support 1: $3,980–$3,990 Support 2: $3,950–$3,960 Major support zone: $3,900–$3,920 Resistance 1: $4,010–$4,030 Resistance 2: $4,080–$4,120 Major resistance zone: $4,150–$4,190 **Level to Watch** A sustained move above $4,030 could open the way toward $4,080–$4,120. However, a break below $3,980 would weaken the current stabilization and could expose lower support zones. **Consideration** Gold-backed tokens can follow movements in physical gold, but short-term price action may also be affected by market liquidity and token-specific risks. The $4,000 area is important, but confirmation matters more than the level itself. **Trade Plan** Bullish setup: Wait for a confirmed breakout above $4,030 and a successful retest. Potential targets are $4,080 and $4,120, with $4,150 as an extended target. Reassess if price falls back below the breakout zone. Bearish setup: If price breaks below $3,980 and fails to reclaim it, downside levels to watch are $3,960 and $3,920. A move back above $4,010 would weaken this setup. **Invalidation and Risk** A strong reclaim of $4,080 would improve the recovery structure. A decisive loss of $3,950 would increase downside risk. Avoid chasing breakouts, and manage position size carefully. Not a call — a structural update. #MyByXTake #ByXIMPACT $XAUTUSDT

TSLAX/USDT — Selling Pressure Is Building Again
TSLAX/USDT is showing renewed weakness after falling from the $384 area toward $352. The latest available daily data shows a close near $351.58 on October 17, with price struggling to hold the recovery levels established earlier in the month. The recent structure favors caution until buyers can reclaim resistance. TSLAX is a tokenized asset designed to track Tesla stock, so its price action is influenced by the underlying equity market as well as token-market liquidity. It should not be analyzed exactly like a typical altcoin. The token rallied strongly around the start of October, moving from the $355 region toward $385. However, that advance failed to hold, and price has since formed a sequence of lower highs. The latest decline toward $350 suggests sellers remain active. This is not yet a confirmed bottoming structure; buyers need to defend support and reclaim lost levels before the trend can improve. Turnover has varied significantly across recent sessions. Historical data shows daily trading volume rising during some of the larger price moves, but the recent decline has not yet produced a confirmed bullish reversal. Moving-average structure: The broader technical picture remains cautious. One recent technical snapshot placed the 50-day moving average around $365.71 and the 200-day moving average around $377.39, both above the price region seen during the latest decline. That leaves the following areas important to monitor: - $355–$358: first recovery zone - $362–$366: intermediate resistance - $375–$378: stronger overhead supply - $385: recent swing-high region These are reference zones from recent price history, not verified live moving-average readings for today's candle. Momentum: The move from around $384 toward $352 shows that sellers have regained short-term control. However, a decline alone does not prove that downside momentum will continue indefinitely. A sustained hold above $350, followed by a reclaim of $358–$362, would be an early sign of stabilization. If price instead breaks support on expanding volume, the bearish structure would remain intact. Support and Resistance: Resistance: $355–$358 is the first hurdle. Above that, $362–$366 is the next important zone. A stronger recovery would require reclaiming $375–$378. Support: $350–$352 is the immediate area to watch. If price breaks decisively below it, the $340–$345 region becomes a possible downside area, followed by $330 if selling pressure accelerates. Level to watch: $358–$362. A convincing close above this zone with improving volume would be the first meaningful sign that buyers are regaining control. Until then, rallies may continue to face selling pressure. Consideration: TSLAX has given back a significant portion of its early-October recovery. The main concern is not simply the percentage decline, but the failure to hold higher prices after the rally. I would avoid chasing a bounce near support without confirmation. The stronger setup is to wait for either a clear reclaim of resistance or a confirmed breakdown with a failed retest. Trade plan: I'm not buying blindly into the current weakness. Two conditional setups stand out: 1. Bullish setup: A confirmed 4H close above $362 with expanding volume could open a move toward $375–$378, with $385 as an extended target. A protective stop could sit below $355, adjusted to the actual entry and volatility. 2. Bearish setup: A confirmed 4H close below $350, followed by a failed reclaim, could expose $340–$345 and potentially $330. A protective stop could sit above $358, depending on the entry. These levels are scenario-based technical references, not guaranteed outcomes. Check the live chart and available liquidity before placing any trade. Invalidation and risk note: A sustained reclaim above $366 would weaken the immediate bearish case. A decisive breakdown below $350 would increase the risk of further downside. Remember that tokenized stock products can have liquidity, tracking, and trading-access risks in addition to the underlying stock's volatility. Position sizing and confirmation matter more than predicting the exact bottom. The bigger story is whether TSLAX can stabilize around $350 or whether sellers force another leg lower. Until the $358–$362 zone is reclaimed, the safer approach is to remain patient. Not a call — a structural update. #ByXIMPACT #TSLATookOffLiterally #TSLAtooktothemoon $TSLAXUSDT

BITCOIN DOMINANCE ABOVE 60%
BITCOIN DOMINANCE ABOVE 60% - ALTCOINS STILL UNDER PRESSURE! Bitcoin dominance has reportedly reached around 60.28%, while 153 out of 169 tracked cryptocurrencies remain below their pre-drop price levels despite the recent market recovery. ẞ **BITCOIN IS SHOWING RELATIVE STRENGTH!** What could this mean for the crypto market? $BTC continues to outperform many altcoins during the recovery. • Several altcoins are still struggling to regain lost ground. If Bitcoin dominance keeps rising, altcoins could face further pressure. • A decline in dominance may indicate renewed interest in alternative cryptocurrencies. 1 Does this mean altcoin season is over? Not necessarily. Bitcoin dominance is one indicator to watch, but market trends can change quickly. 00 The key question: Will Bitcoin continue leading the market, or will altcoins begin catching up? What's your view - **BTC dominance higher or an altcoin recovery next? #ByXIMPACT $BTCUSDT #USCPI

I DON'T EXPECT CPI TO RUIN CRYPTO! Tomorrow's U.S. CPI report could bring volatility, but I don't think we should automatically expect the worst for crypto. Yes, hotter-than-expected inflation could delay Fed rate cuts, push Treasury yields higher, and strengthen the dollar. That would create short-term pressure, especially for altcoins. But remember, markets react to expectations, not just the headline number. #CPIWatch If inflation comes in close to expectations or cooler than forecast, risk appetite could improve, potentially giving and altcoins room to move higher. Core CPI will be particularly important in determining the market's reaction. Not Financial Advice. DYOR. #ByXIMPACT $BTCUSDT

MNT/USDT — Relief Bounce or Another Leg Down? MNT/USDT is trading around $0.564, down roughly 0.9% over the last 24 hours. After a sharp decline over the past week, Mantle is attempting to stabilize near the $0.55–$0.56 support zone. The recovery remains fragile, and buyers still need to reclaim higher resistance levels before the chart can show meaningful structural improvement. CoinMarketCap +1 Context: MNT has faced sustained selling pressure, with the recent seven-day decline indicating that sellers still have control of the broader short-term structure. The current price action near $0.56 could be the beginning of a base, but it is too early to call it a confirmed reversal. The market needs to establish higher lows and break the sequence of lower highs before the bullish case becomes stronger. The key question is whether buyers can defend $0.55 or whether another rejection pushes price toward the next support zone around $0.52–$0.53. CoinLore +1 Turnover is reported at roughly $17M over 24 hours. That gives some indication of market participation, but a recovery needs stronger buying volume to confirm that demand is returning. A bounce without expanding volume can fade quickly, particularly after a sharp weekly decline. Moving-average structure: The available technical readings show mixed short-term signals, but the broader trend remains under pressure. - MA5: approximately $0.5653 - MA10: approximately $0.5647 - MA20: approximately $0.5640 - MA50: approximately $0.5636 - MA200: approximately $0.5949 Shorter moving averages are clustered near the current price, suggesting that MNT is attempting to stabilize in the short term. However, the 200-period average remains considerably higher, reflecting the broader recovery challenge. These readings are reference levels from the available technical snapshot, not a verified exchange-specific chart. Investing.com CA Momentum: The latest available technical readings are mixed. RSI on one technical snapshot is near 52.7, while another daily analysis places it around 40.6. These readings come from different data and timeframe calculations, so they should not be treated as interchangeable. The practical takeaway is that short-term momentum may be improving, but there is not enough evidence to confirm a sustained bullish reversal. Investing.com CA +1 Support and Resistance: Resistance: $0.58 is the first recovery level to watch. Above that, $0.60 becomes the more important breakout area. A sustained move above $0.60 would weaken the immediate bearish structure. Support: $0.55–$0.56 is the current demand zone. If price breaks below $0.55, the next downside area is $0.52–$0.53, followed by the psychological $0.50 level. CoinLore +1 Level to watch: $0.58–$0.60. A convincing reclaim of this zone with expanding volume would be the first meaningful sign that buyers are regaining control. Until then, the current stabilization remains a potential relief move within a broader corrective structure. Consideration: MNT is showing signs of short-term stabilization, but the weekly decline cannot be ignored. Buyers need to defend $0.55 and reclaim resistance rather than simply rely on a small bounce. The stronger setup is to wait for confirmation. Entering before the breakout means taking on the risk that the current support zone fails and price continues lower. Trade plan: I'm not buying blindly into this stabilization. Two conditional setups stand out: 1. Bullish setup: A confirmed 4H close above $0.60 with expanding volume could open a move toward $0.63–$0.65. A protective stop could sit below $0.575, adjusted to the actual entry and volatility. 2. Bearish setup: A confirmed 4H close below $0.55, followed by a failed reclaim, could expose $0.53 and then $0.52. A protective stop could sit above $0.565, depending on the entry. These are conditional scenarios, not guaranteed outcomes. CoinLore +1 Invalidation and risk note: A sustained move above $0.60 would weaken the immediate bearish case, while a decisive breakdown below $0.55 would reopen the downside. The main risk is a false breakout in either direction. Wait for candle-close confirmation and volume, keep position size controlled, and avoid chasing a move after it has already extended. The bigger story is whether Mantle can build a stable base after its recent decline. Until $0.60 is reclaimed, patience is more useful than assuming the bottom is in. Not a call — a structural update. #ByXIMPACT $MNTUSDT