BlockChainMafia
1035ლაიქი0წესები 124Fans102გამოწერა
Trader | Market Analyst Sharing my market opinions, chart setups, trends, and data-based observations. I focus on understanding price action, managing risk, and
Trader | Market Analyst Sharing my market opinions, chart setups, trends, and data-based observations. I focus on understanding price action, managing risk, and
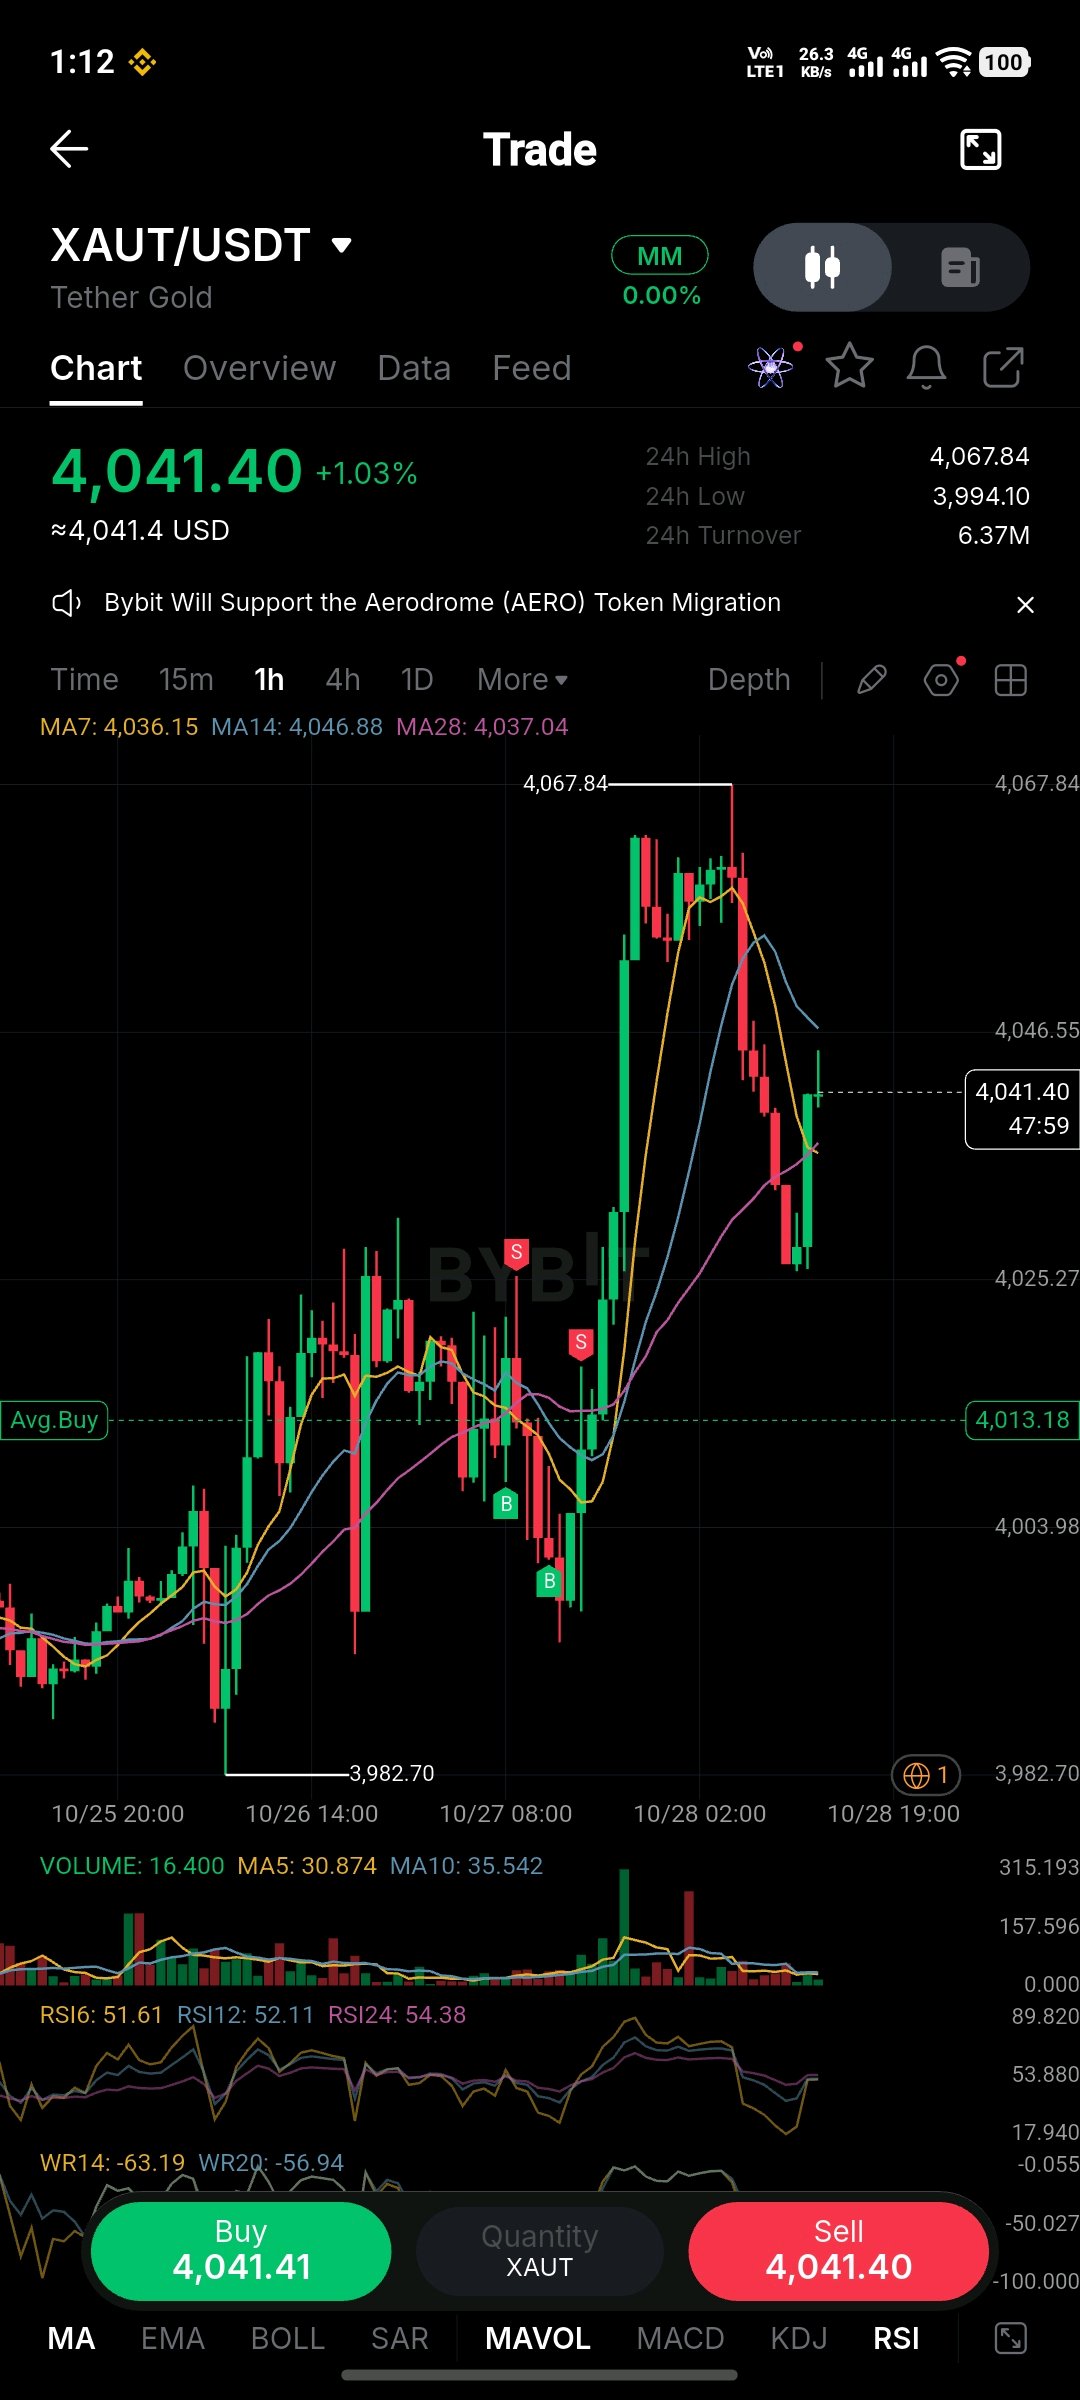
🚀 XAUT/USDT – BUY THE DIP OR WATCH THE BREAKOUT! I'm watching XAUT closely as buyers try to push the price higher after a strong recovery from the $4,025 support area. The price is currently trading at $4,041.40, up 1.03% in 24 hours. Bulls are showing fresh interest, but an important resistance zone is still ahead. 🟢 BUY ZONE: $4,032 – $4,038 🎯 TAKE-PROFIT TARGETS: - TP1: $4,047 - TP2: $4,058 - TP3: $4,067 🛑 STOP-LOSS: $4,018 📊 KEY LEVELS TO WATCH: - Support 1: $4,025 - Support 2: $4,013 - Support 3: $4,004 - Resistance 1: $4,046 - Resistance 2: $4,067 🔥 MARKET FEELING: CAUTIOUSLY BULLISH The 1-hour RSI is around 51, showing a slight improvement in buying strength. I'm looking for XAUT to break above $4,047 with strong volume. If buyers hold control, we could see another move toward $4,067. However, losing $4,025 could bring fresh selling pressure. ⚠️ Don't rush into a trade. Wait for confirmation, manage your risk, and protect your capital. Every move needs a smart plan! ❤️ Follow my account for more trading updates and fresh opportunities. 📢 Share this signal with your trading friends and trading fam! $XAUTUSDT
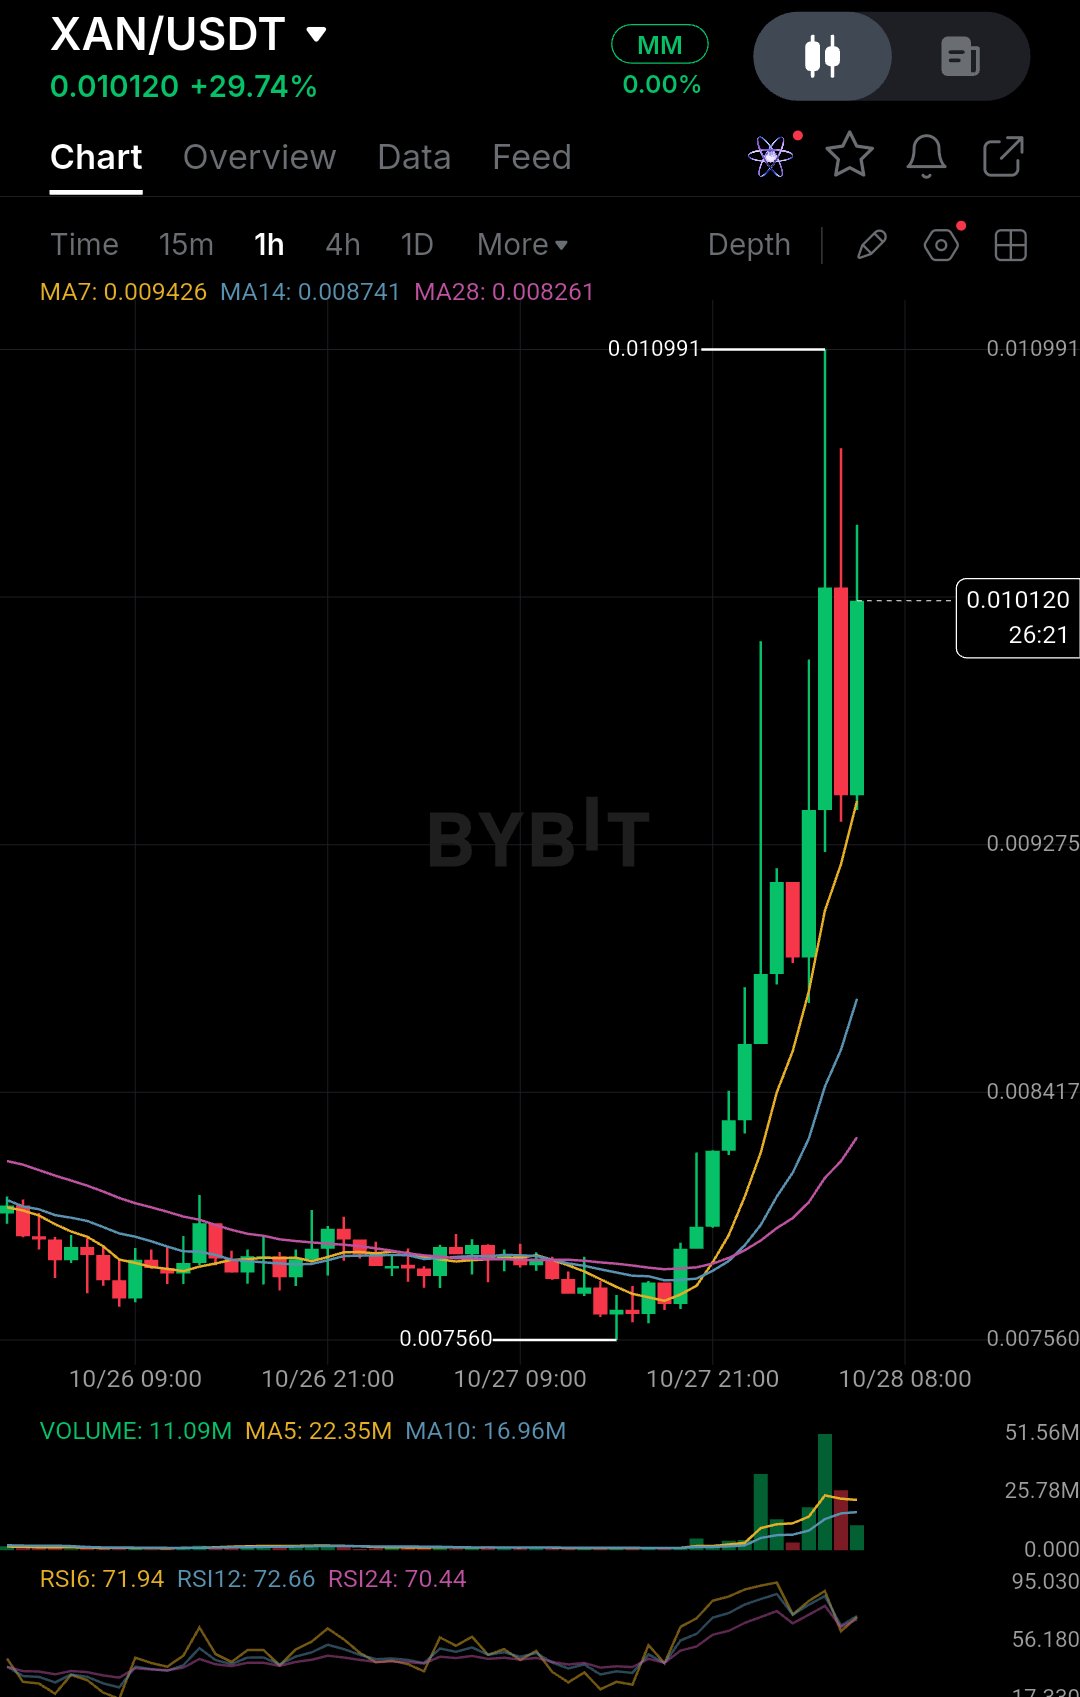
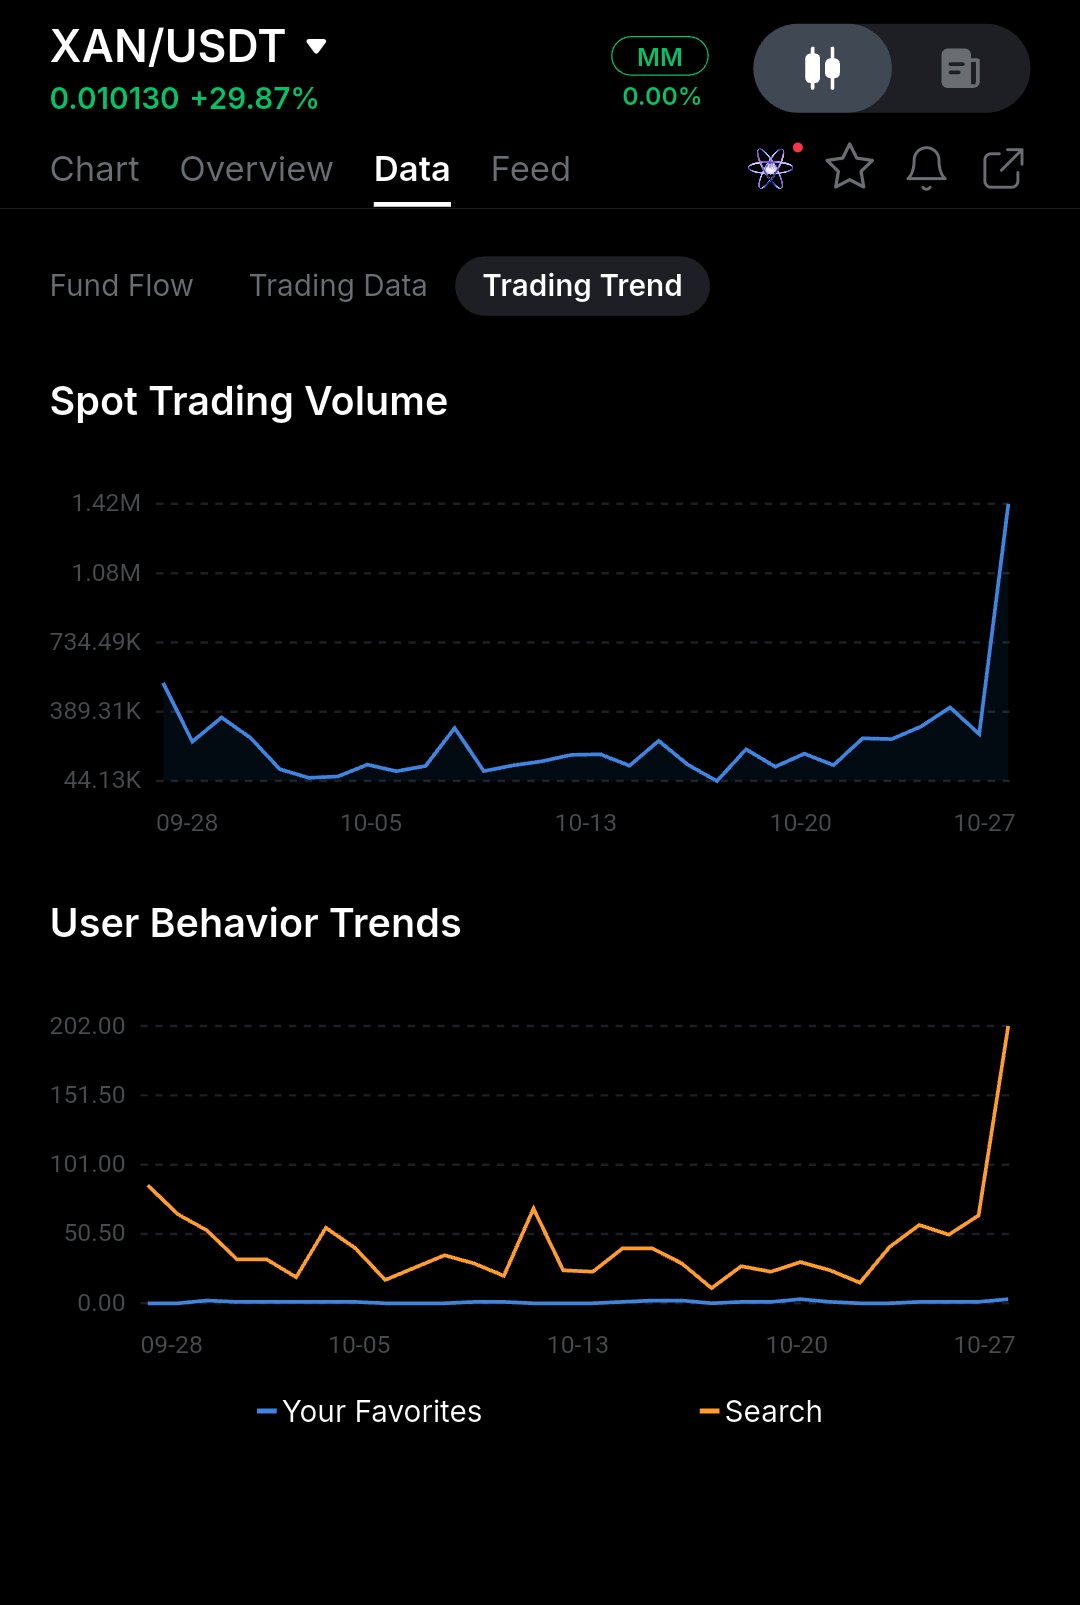
XAN is trading at $0.010120, recording an impressive 29.74% gain in the latest market snapshot, with its recent trading range between $0.007560 and $0.010991, its maximum supply stands at 10 billion tokens, although circulating supply estimates vary across market data providers, the sharp upward movement reflects growing market attention and stronger trading activity, but the key question is whether buyers can maintain this momentum and turn the recent rally into a sustainable recovery Anoma is developing blockchain infrastructure designed to simplify interactions between decentralized applications and multiple networks, its intent centric architecture allows users to express their desired outcomes while the underlying system coordinates transactions, potentially improving interoperability, privacy, and usability, the project has reported deployments across Ethereum, Arbitrum, Base, Optimism, BNB Chain, and Monad, while AnomaPay, AnomaSwaps, and AnomaVaults represent important application areas, its long term adoption will depend on developer participation, practical applications, and measurable user activity rather than technical promises alone XAN has a maximum supply of 10 billion tokens, with 25% allocated to community, marketing, and liquidity, 19% to research and ecosystem development, 10% to the foundation, 31% to institutional backers, and 15% to core contributors, Governance V2 launched on September 16, 2026, allowing holders to participate in decisions involving protocol functionality, treasury management, and token supply, however, sustainable token demand will depend on actual network usage and economic activity, while reliable consolidated protocol revenue figures remain limited, making transaction growth and recurring application demand important indicators to monitor Token unlocks remain an important risk for XAN holders, with official documentation describing a twelve month lockup followed by gradual releases over thirty six months for several major allocations, vesting began on September 29, 2026, and third party trackers indicate that approximately 202.7 million to 208.3 million XAN could be released around October 29, although exact figures should be verified against official contracts, these releases do not automatically mean immediate selling, but they increase the amount of tokens potentially available to the market, making liquidity, investor behavior, and circulating supply changes particularly important during the coming weeks Technically, XAN has advanced from its previous consolidation near $0.007560, with hourly moving averages showing MA7 at $0.009426, MA14 at $0.008741, and MA28 at $0.008261, immediate resistance stands near $0.010991, while support around $0.009275 to $0.009426 is important for maintaining bullish momentum, RSI readings around 70 to 73 indicate strong but extended buying pressure, a sustained breakout above resistance could strengthen the recovery, whereas losing support may expose $0.008741 and $0.008261, the next one to two weeks will depend on the October 29 token unlock, broader crypto market conditions, and further ecosystem developments, leaving XAN bullish in the short term but vulnerable to profit taking and additional supply $XANUSDT #ByXIMPACT
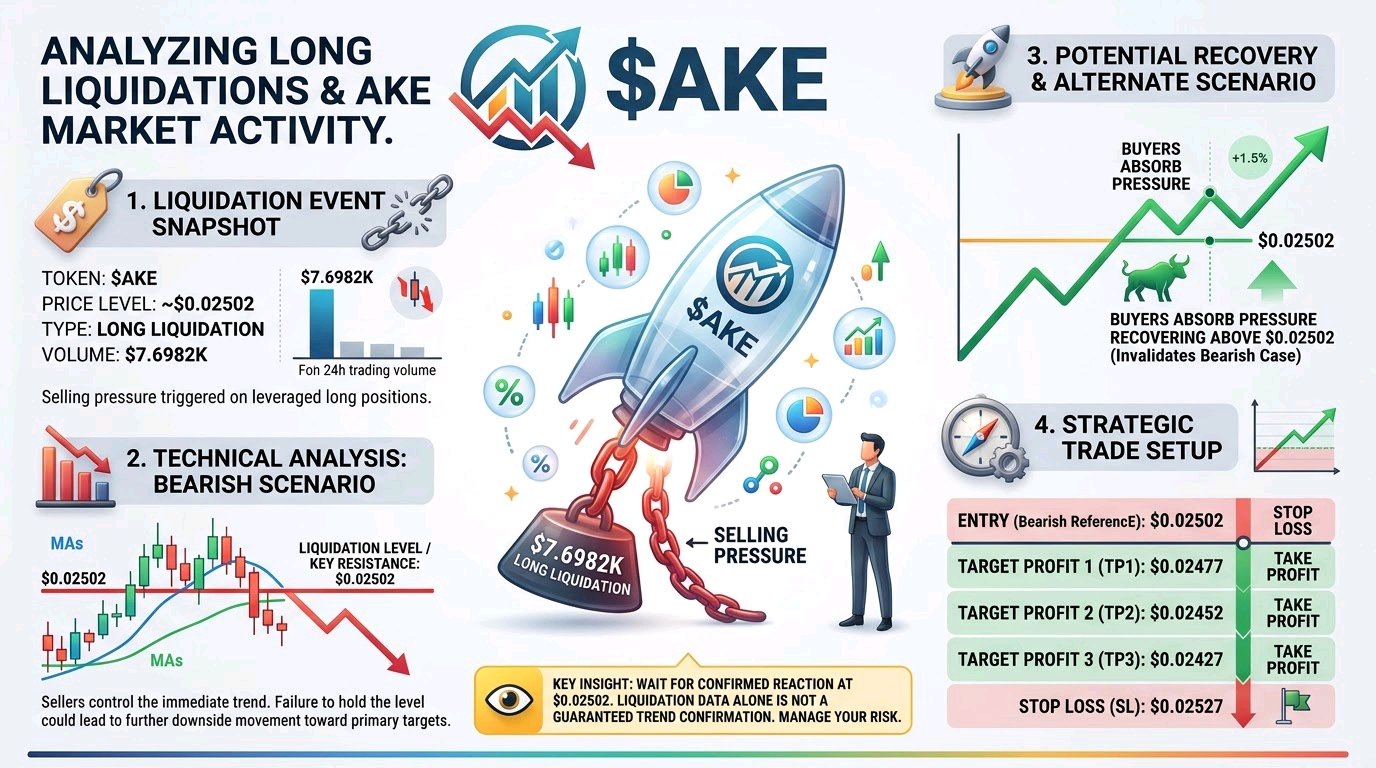
$AKE — Everyone, another long liquidation has appeared in the latest market activity. AKE recorded $7.6982K in liquidations around $0.02502, showing pressure on leveraged buyers. 🔴 This development could create additional downside pressure if sellers continue controlling the next move. 📌 LIQUIDATION PRICE: $0.02502 ◈ Long Liquidation: $7.6982K TECHNICAL ANALYSIS The liquidation suggests that bullish traders experienced pressure around the reported price. If selling continues, AKE could attempt another downward move. However, if buyers step in and absorb the selling pressure, a recovery attempt could develop. The next reaction is important because liquidation activity alone cannot confirm a sustained bearish trend. TRADE SETUP 🔴 Entry: $0.02502 ⟡ TP1: $0.02477 ◈ TP2: $0.02452 ⚡ TP3: $0.02427 🛡️ Stop Loss: $0.02527 The entry uses the reported liquidation price as a reference for a bearish scenario. TP1 is the first downside objective, while TP2 and TP3 represent further potential targets. The stop loss defines the risk boundary. SUPPORT & RESISTANCE Key reference: $0.02502 〽️ MARKET OUTLOOK AKE could experience further weakness if sellers maintain control. If buyers absorb the pressure and price starts recovering, the bearish scenario becomes weaker. Guys, keep this level on your radar. Wait for the market reaction, manage your risk and avoid entering blindly. #ByXIMPACT
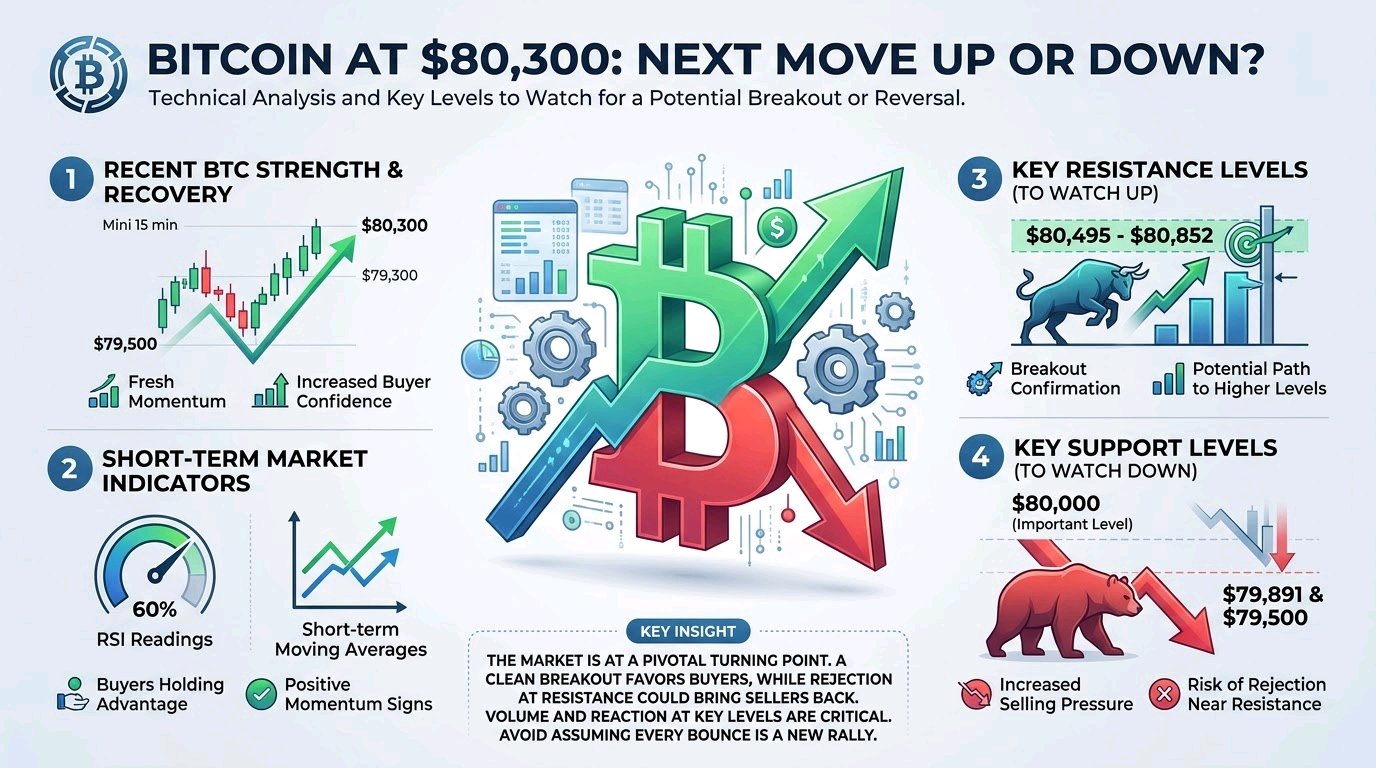
Bitcoin at $80,300: Is the Next Move Up or Down? Bitcoin is showing fresh strength, but the real test is still ahead. After dropping toward $79,500, BTC bounced back to around $80,300, giving buyers a reason to feel more confident. Now, everyone is watching to see whether this recovery can continue. Looking at the 15-minute chart, Bitcoin is trading above its short-term moving averages. The RSI readings are also showing positive momentum, which suggests buyers currently have the advantage. However, momentum alone does not guarantee that the price will keep rising. Here are the key levels to watch: Resistance sits around $80,495 to $80,852. If Bitcoin breaks above this zone and holds there, it could open the door for another upward move. On the downside, $80,000 is an important short-term level to watch. If selling pressure increases, support around $79,891 and $79,500 could become important again. The biggest risk is assuming that every bounce means a new rally has started. Bitcoin can recover quickly, but it can also reverse when buyers lose strength. Trading volume and the way price reacts at these levels will matter more than excitement. My view: BTC looks stronger in the short term, but confirmation is still needed. A clean breakout could favor buyers, while rejection near resistance may bring sellers back into control. The market is at an important turning point. Will buyers push Bitcoin higher, or will resistance stop the rally again? The next price reaction could reveal the answer. #ByXIMPACT $BTCUSDT
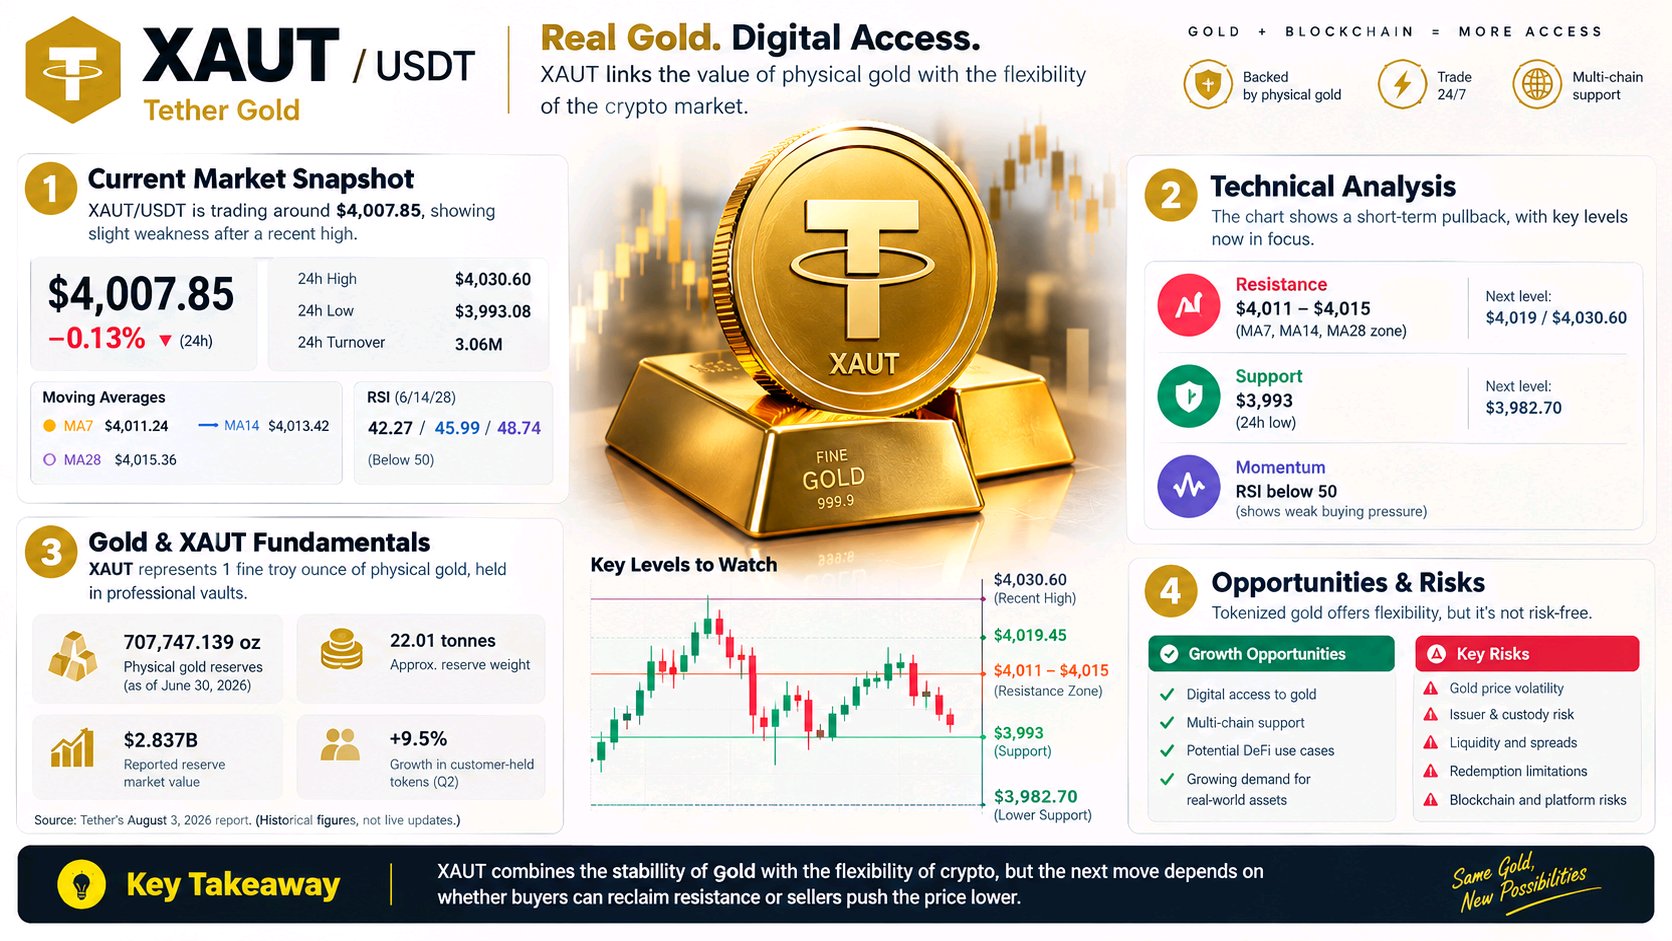
$XAUTUSDT Market Update: Gold Faces a Critical Turning Point! XAUT/USDT is trading around $4,007.85, pulling back from its recent high of $4,030.60. The 1-hour chart shows weakening momentum, with price sitting below all three moving averages. Buyers now need to step in to prevent further downside pressure. 📊 Key Levels to Watch - Resistance: $4,011–$4,015 - Major Resistance: $4,030.60 - Support: $3,993 - Lower Support: $3,982.70 🚀 If buyers reclaim resistance, XAUT could attempt another recovery toward $4,030. But if sellers break below $3,993, further weakness may follow. Gold's bigger picture depends on interest rates, dollar strength, and global demand. For now, the key question is simple: will buyers defend the current zone, or will sellers take control? The next move could reveal where momentum is heading. 👀 #ByXIMPACT
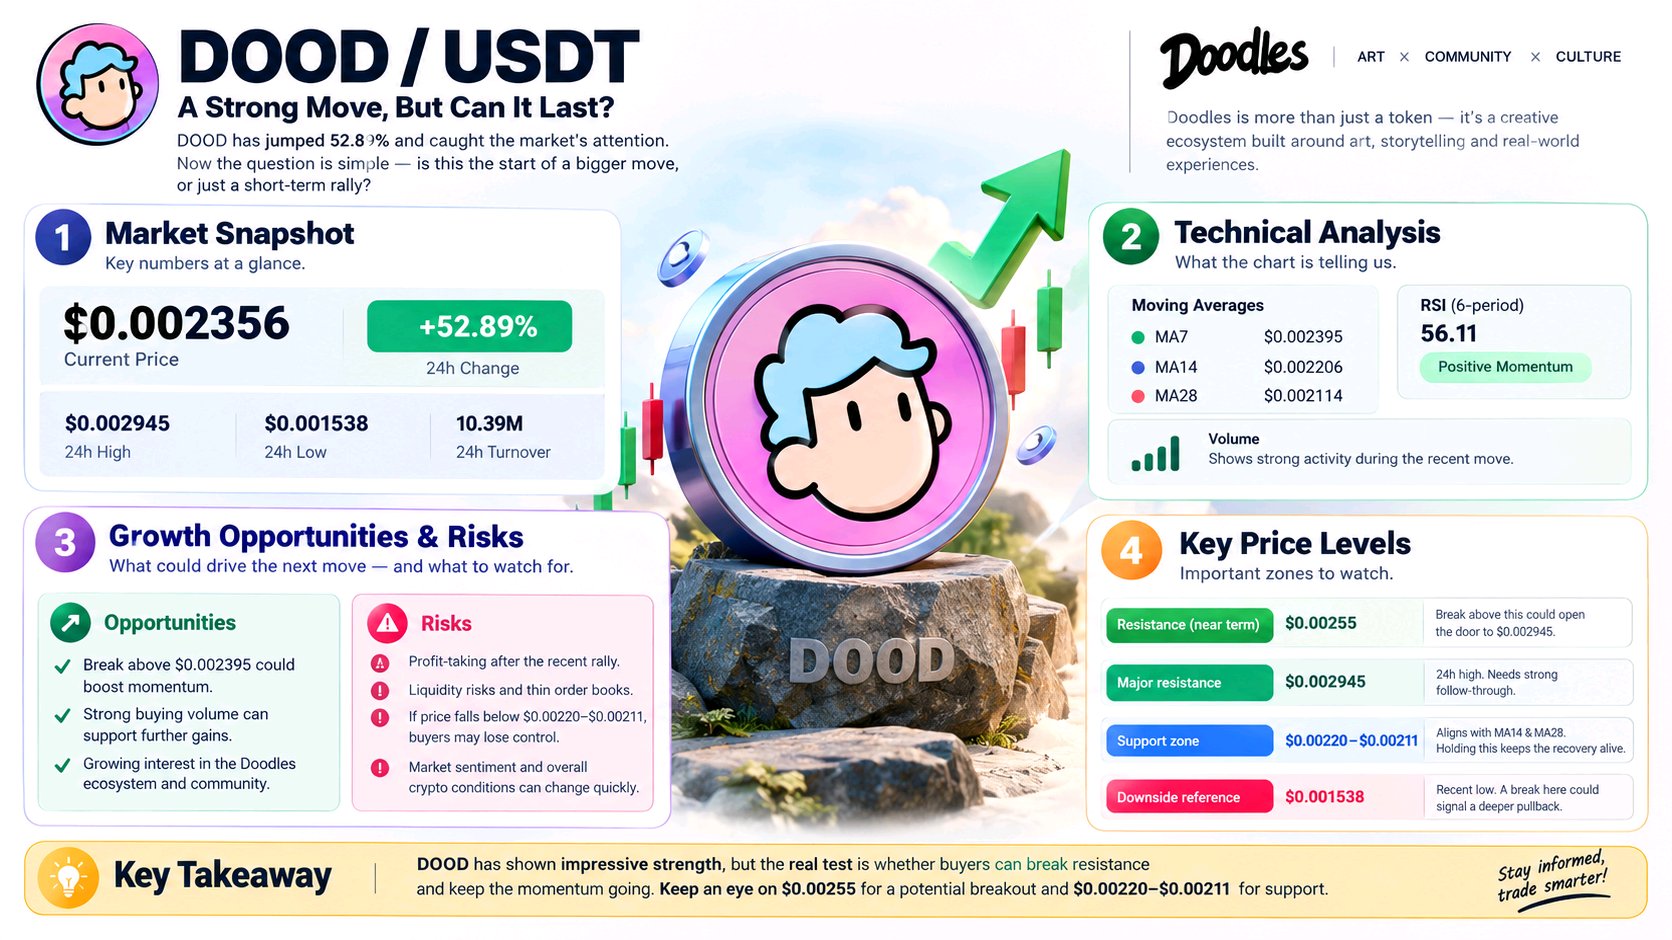
$DOODUSDT Price Analysis: Can This 52% Rally Go Even Higher? DOOD has caught the market’s attention with a strong move upward. According to the Binance screenshot, the token is trading at $0.002356, up 52.89%, after touching a high of $0.002945. But here’s the big question: Is DOOD preparing for another move up, or are buyers starting to lose momentum? Let’s look at what the chart is telling us. 📊 What’s Happening With DOOD? DOOD has made a strong recovery from its recent low of $0.001538. Buyers stepped in, pushed the price higher, and brought fresh attention to the market. However, the price has pulled back from its recent high. This isn’t automatically a bad sign, but it shows that some sellers are stepping in as the price rises. The next move will depend on whether buyers can hold their ground. 🔍 Important Price Levels Resistance: $0.00255 This is an important level to watch. If DOOD breaks above it and holds, buyers could attempt another move toward $0.002945. First support: $0.00220–$0.00211 These levels line up with the chart’s moving averages. Holding this area could help keep the recovery alive. Major downside reference: $0.001538 This is the recent low shown in the screenshot. A significant drop toward this level would signal that the rally has lost considerable strength. These levels are reference points, not guaranteed price targets. 📈 Are Buyers Still in Control? The chart shows DOOD trading above its 14-period and 28-period moving averages, which is an encouraging sign. Its RSI readings are also around 56–59, suggesting positive momentum without reaching the commonly used overbought zone. Still, the price is slightly below its 7-period moving average. That means short-term momentum needs to improve before another strong move can be confirmed. ⚡ What Could Happen Next? Bullish scenario: If DOOD moves above $0.002395 and breaks through $0.00255 with strong buying volume, the market could see another attempt toward $0.002945. Bearish scenario: If buyers fail to defend the $0.00220–$0.00211 area, selling pressure could increase and push the price lower. Neither scenario is confirmed yet. Watching price action and trading volume will be more useful than chasing the rally after a big green move. ⚠️ The Risk You Shouldn't Ignore A token rising more than 50% in a short period can attract attention quickly, but sharp rallies can reverse just as fast. Liquidity, profit-taking, market sentiment, and changes in demand can all affect DOOD’s next move. A strong price chart alone does not guarantee long-term project growth. 🎯 Final Thoughts DOOD has shown impressive strength, but the real test starts now. Can buyers push through resistance and keep the momentum alive, or will sellers turn this rally into a deeper pullback? Keep your eyes on $0.00255 for a potential breakout and $0.00220–$0.00211 for support. The next move could reveal whether DOOD has enough strength to continue its recovery. #ByXIMPACT
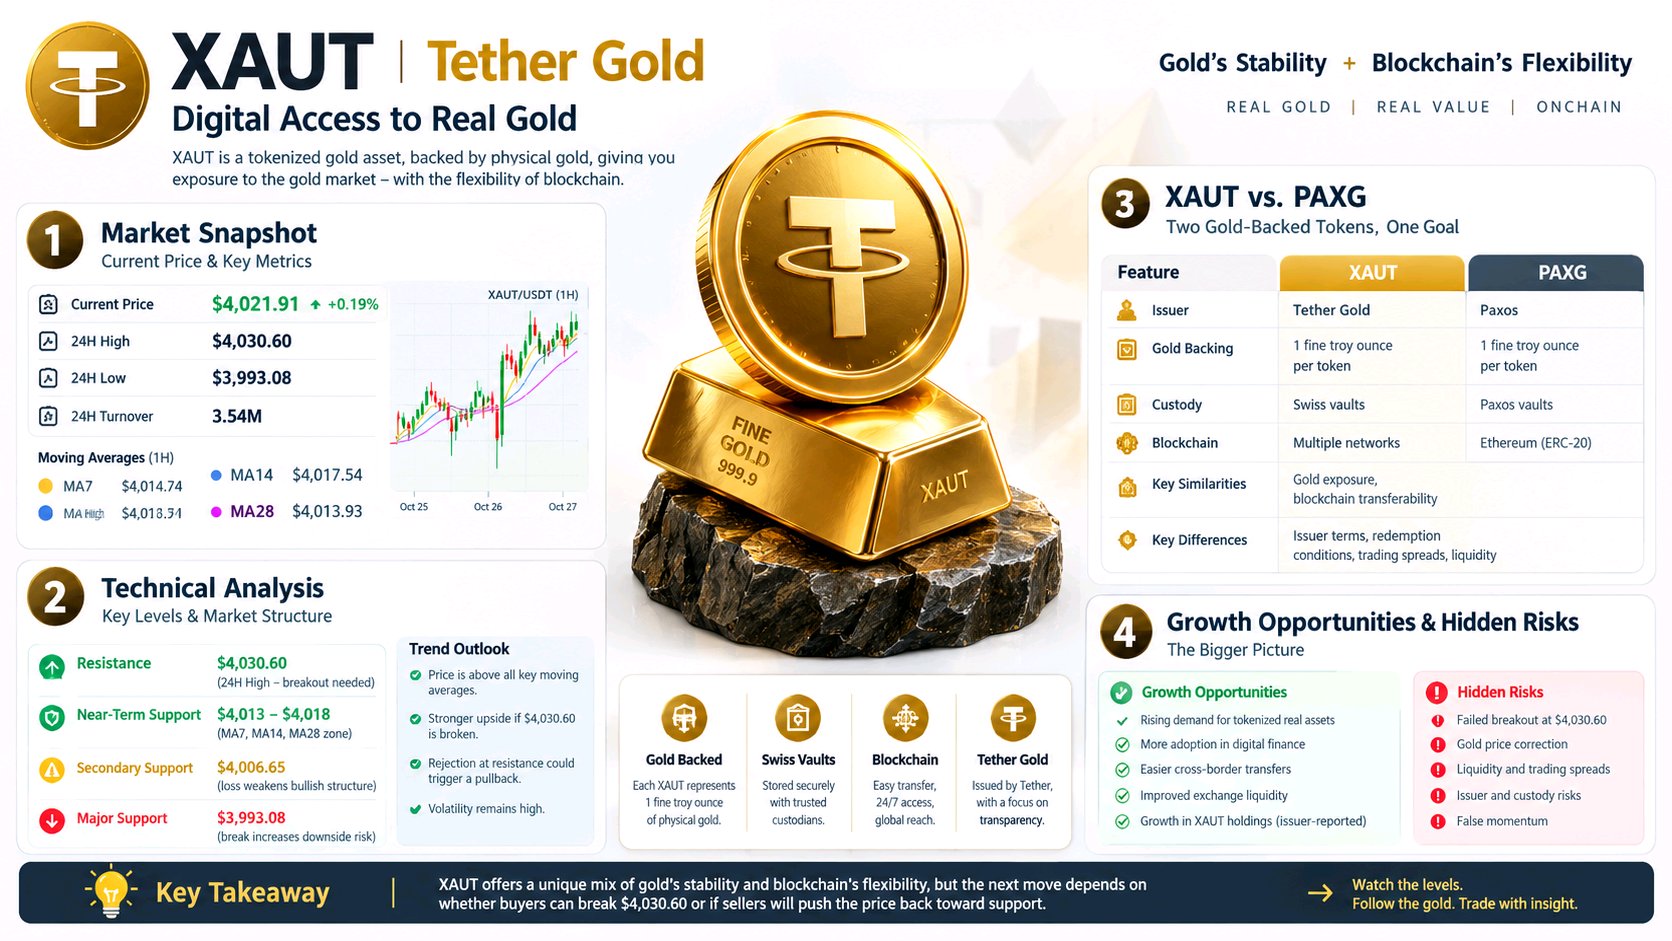
🟡 $XAUTUSDT (TETHER GOLD) — BIG MOVE COMING? 🚀🔥 XAUT is trading at $4,021.91, up 0.19%, as buyers attempt to push the price toward a key resistance zone. 👀 📊 MARKET SNAPSHOT ➜ Current Price: $4,021.91 ➜ 24H High: $4,030.60 ➜ 24H Low: $3,993.08 🎯 KEY LEVELS TO WATCH 🟢 Resistance: $4,030.60 🟢 Support: $4,013–$4,018 🟡 Next Support: $4,006.65 🔴 Major Support: $3,993.08 📈 BULLISH SCENARIO If buyers break above $4,030.60 and hold the level, bullish momentum could strengthen and open the door to further upside. 📉 BEARISH SCENARIO If sellers reject the price and push XAUT below $4,013, a pullback toward $4,006.65 or even $3,993.08 could follow. 🔥 THE BIG QUESTION Can bulls break resistance, or will sellers take control? The next move depends on price confirmation and gold market momentum. ⚡ Watch the levels. Trade smart. No breakout is confirmed yet. #ByXIMPACT
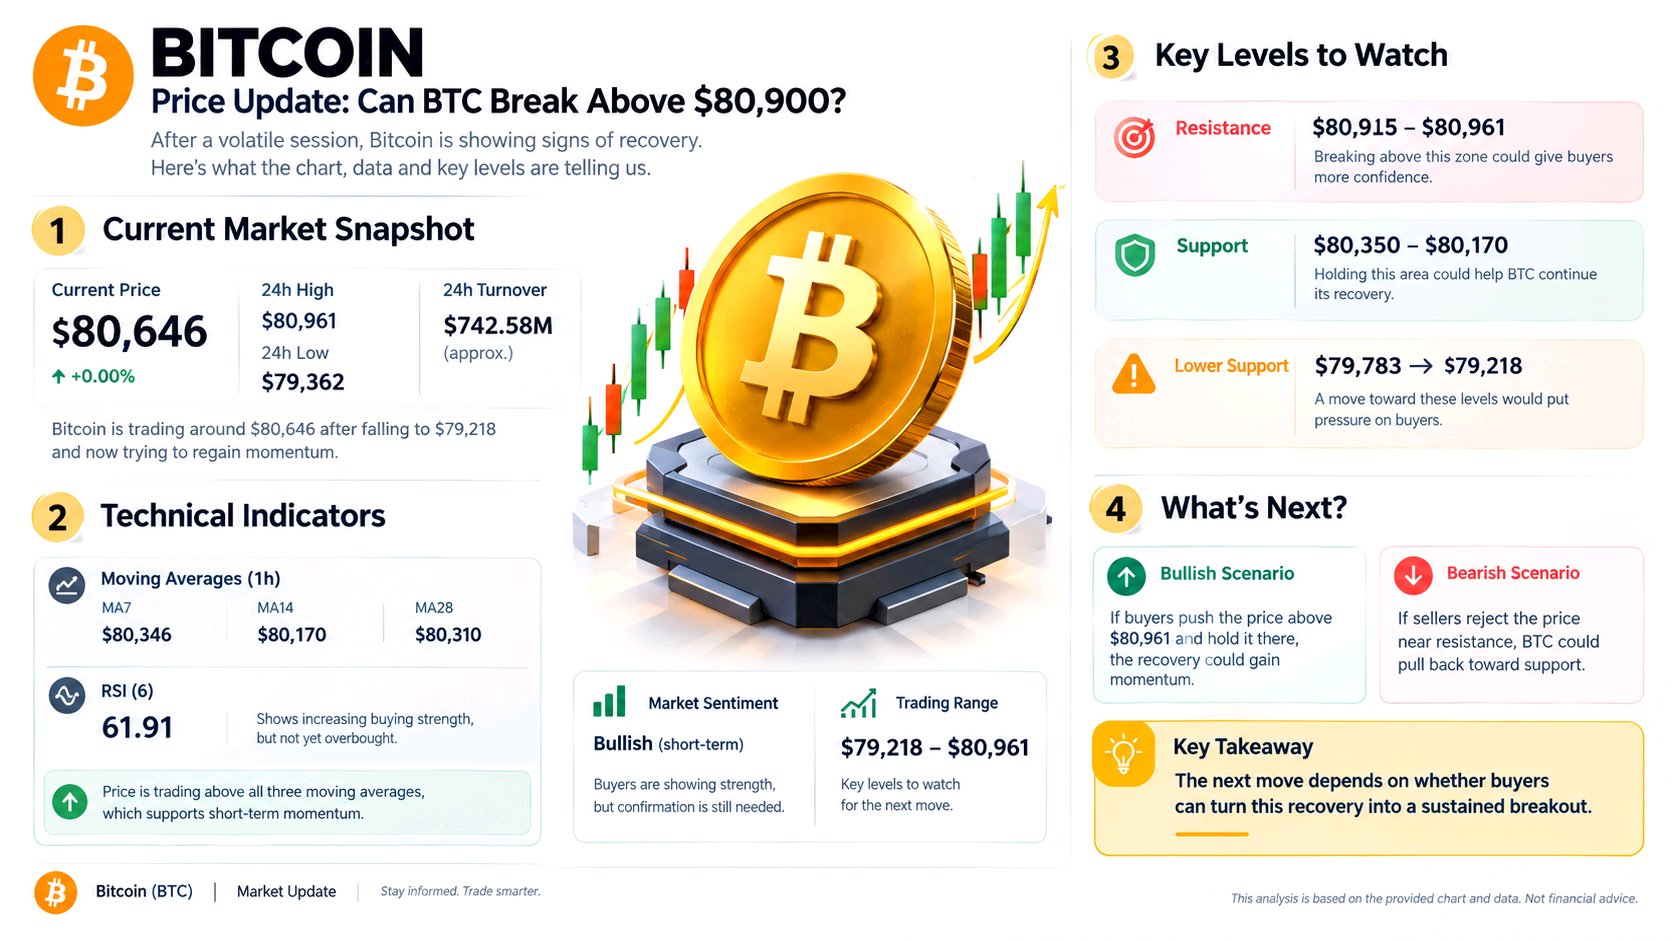
Bitcoin Price Update: Can BTC Break Above $80,900? 🚀 Bitcoin is trying to regain its strength after a rough trading session. At the time of the screenshot, BTC was trading around $80,646, showing signs of recovery after falling toward the $79,218 area. Buyers Are Stepping Back In On the 1-hour chart, BTC is trading above its three moving averages: $80,346, $80,170, and $80,310. This is a positive sign for short-term momentum. The RSI is also around 62, suggesting buyers are gaining strength. However, one green candle does not guarantee that the market is ready for a bigger move. The Levels That Matter - Resistance: $80,915–$80,961. Breaking above this zone could give buyers more confidence. - Support: $80,350–$80,170. Holding this area could help BTC continue its recovery. - Lower support: $79,783, followed by $79,218. A move toward these levels would put pressure on buyers. What Happens Next? Bitcoin is approaching an important decision point. If buyers push the price above $80,961 and hold it there, the recovery could gain momentum. But if sellers reject the price near resistance, BTC could pull back toward support. For now, the chart looks encouraging for buyers, but confirmation is still needed. The next move depends on whether buyers can turn this recovery into a sustained breakout. 👀📈 $BTCUSDT
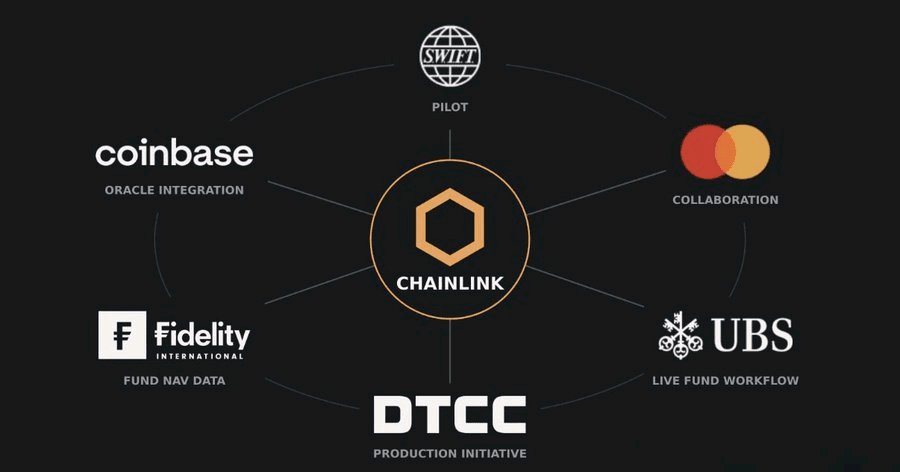
Swift, Mastercard, UBS, DTCC, Fidelity International and Coinbase. Look at the names working with Chainlink. Calling $LINK another random altcoin is getting embarrassing. #ByXIMPACT
@Polymarketmakes real world events feel completely different. Politics, crypto, sports, macro, AI everything becomes a live market where probabilities keep changing as new information comes in. → One headline can shift the odds → One update can flip sentiment → One surprise can change the whole market That’s what keeps Polymarket interesting for me. You’re not just reading what people think. You’re watching expectations move in real time. And sometimes, the market reacts before the story is even finished. #ByXIMPACT

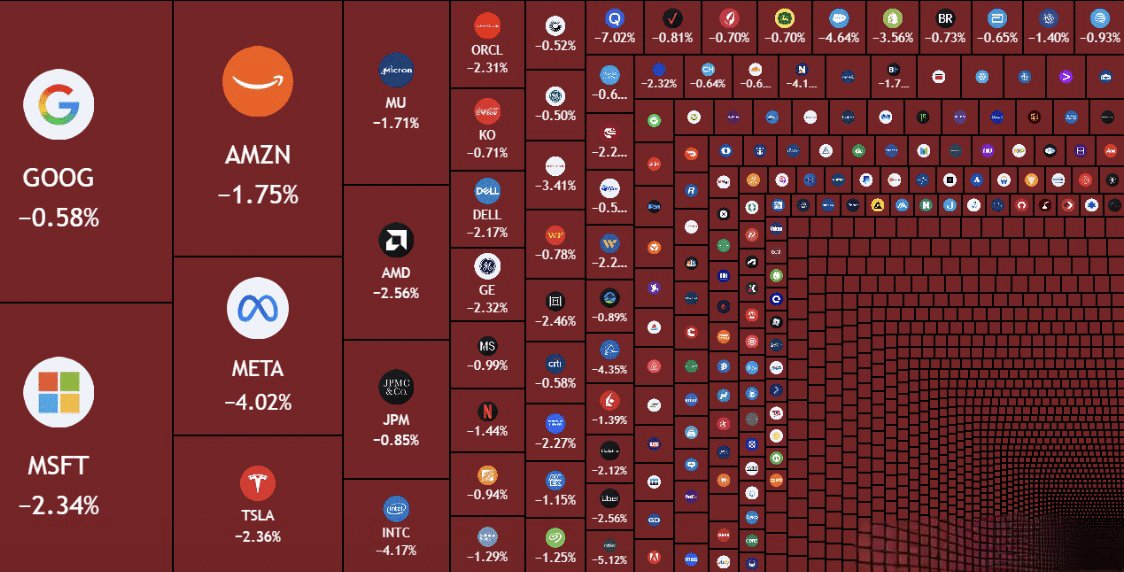
🚨 $390 BILLION wiped from the US stock market at the open. The market is feeling the pressure as US–Iran tensions keep investors on edge. Oil, yields, and geopolitical risk are moving together, creating a highly sensitive environment. But here’s where things get REALLY interesting… 👀 If fresh news of a US–Iran deal lands, sentiment could flip in seconds. Negotiations are still being discussed through mediators, but major hurdles remain. One headline can change the entire mood. Stay alert. The next move could be violent. ⚡🔥 #ByXIMPACT
🚨 MICHAEL SAYLOR IS BUYING BIG AGAIN Strategy just bought another $138 MILLION worth of Bitcoin. 🔥 Biggest #BTC purchase in the last 5 months. Saylor isn’t slowing down. He’s still stacking Bitcoin. 🟠₿ #ByXIMPACT

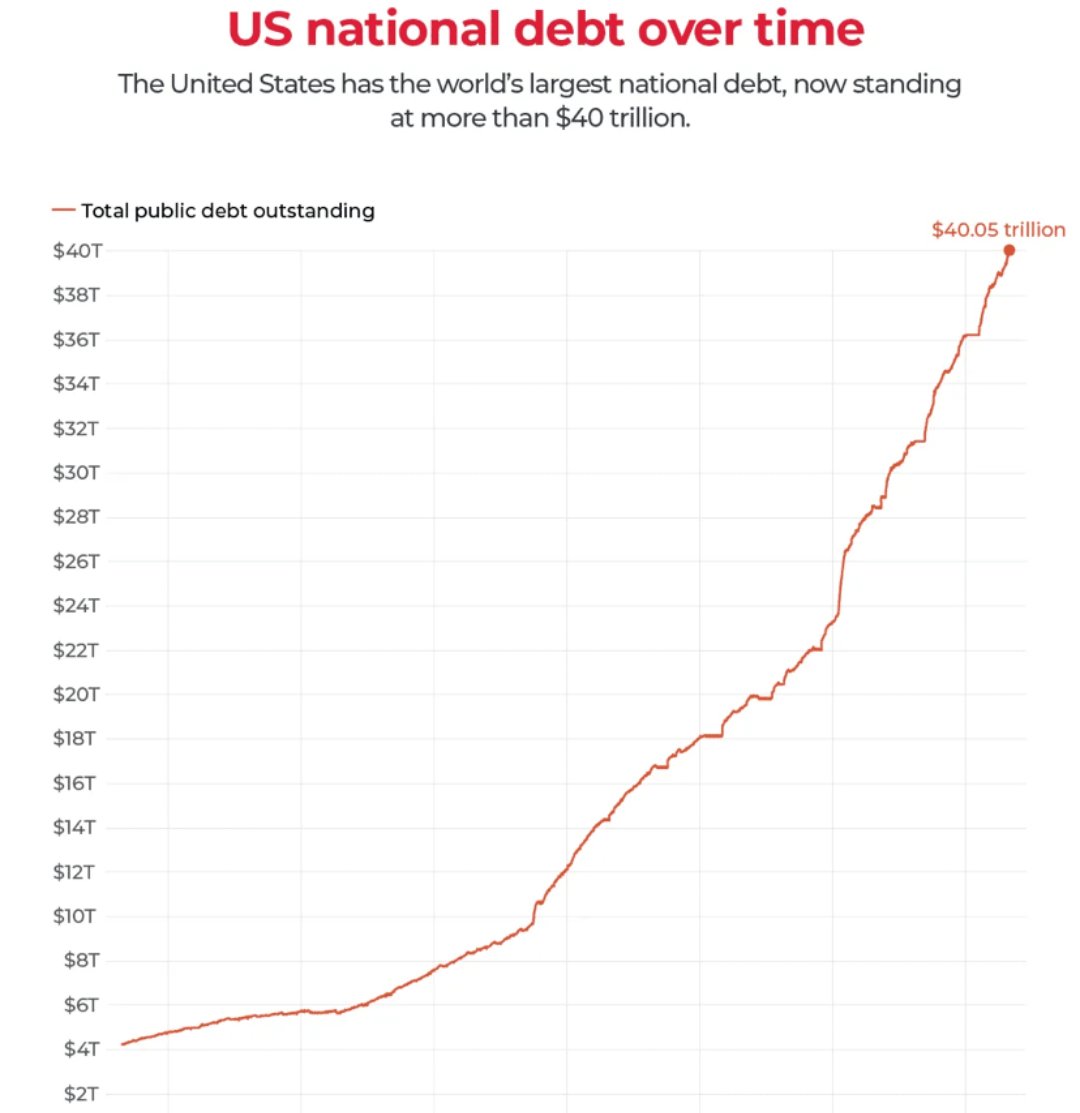
US debt hits $40,000,000,000,000. The U.S. national debt just crossed $40 trillion. It hit the mark on August 18. It’s already at $40.1T. The context: $2.7T added in the last 12 months. $11.7T added in the last five years. $117K owed per American. Own hard assets. #ByXIMPACT
Your alt just pumped 40%, and it may still need to 6x just to get back to its old high. That is the math nobody posts during a green week. A coin that falls 85% does not need an 85% rally to recover. It needs about 567%. Here is what every name from this week's bounce needs to reclaim its all time high. $TAO 2.2x $SOL 2.4x $LINK 3.7x $ONDO 3.9x $NEAR 4.2x $SUI 4.5x $INJ 6.7x $RENDER 6.8x $QUBIC 8x or more $AVAX 13x $FET 14x $ICP 34x, or 210x from its $700 launch week print Every name except TAO and SOL is still 70% or more below its peak. Two things stand out. The leaders are the closest. TAO and SOL need less than 2.5x, which is part of why the market keeps treating them as leaders.The deepest holes belong to names that peaked on old narratives. AVAX and ICP topped in 2021 and have spent nearly five years far below those highs. A new cycle does not automatically bring old leaders back. So before you celebrate a bounce, ask one question. Is this coin recovering, or just bouncing inside a much bigger drawdown? The coins closest to their highs already have the market's trust. The ones furthest away need a new story, not a green week. #ByXIMPACT

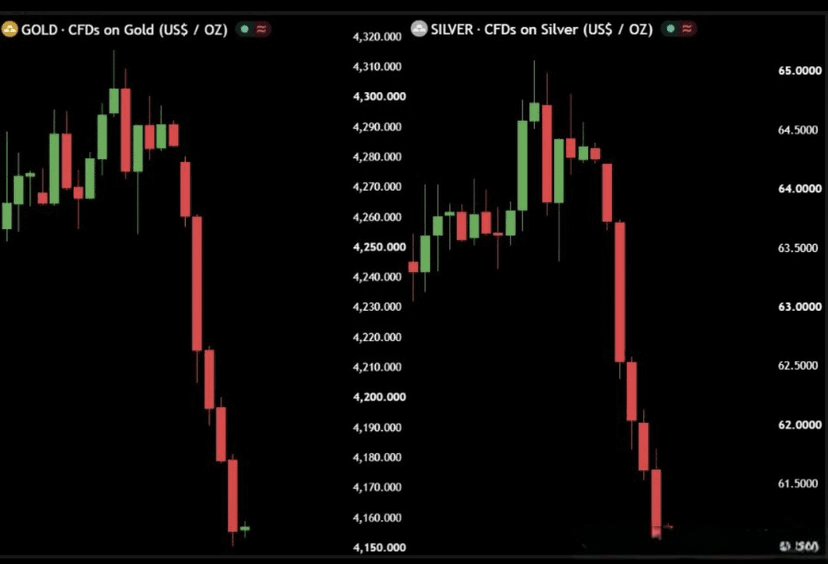
⚡️MASSIVE DUMP IN GOLD AND SILVER $1.1 Trillion erased in just 9 hours. #ByXIMPACT $XAUTUSDT
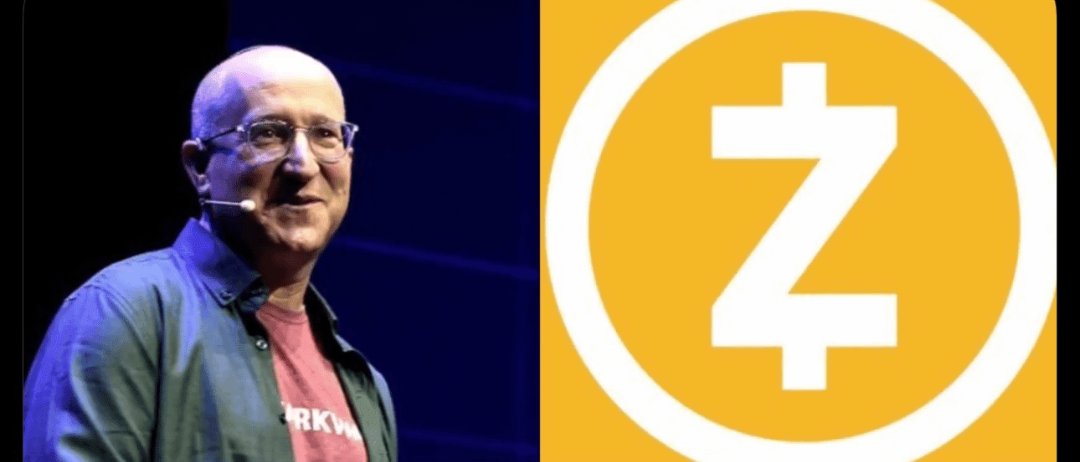
Zcash Co-Founder expects $ZEC to hit $5,000 this year According to @Zcash co-founder @EliBenSasson, he expects $ZEC to reach $5,000 by the end of 2026. While whale accumulation and public demand for ZEC have increased significantly, management says the recent volatility is organic, as there is a gap between accumulation activity and overall market sentiment. Big investors have raised questions about why liquidity is flowing into the privacy coin. Is ZEC at $5K feasible this year? #ByXIMPACT
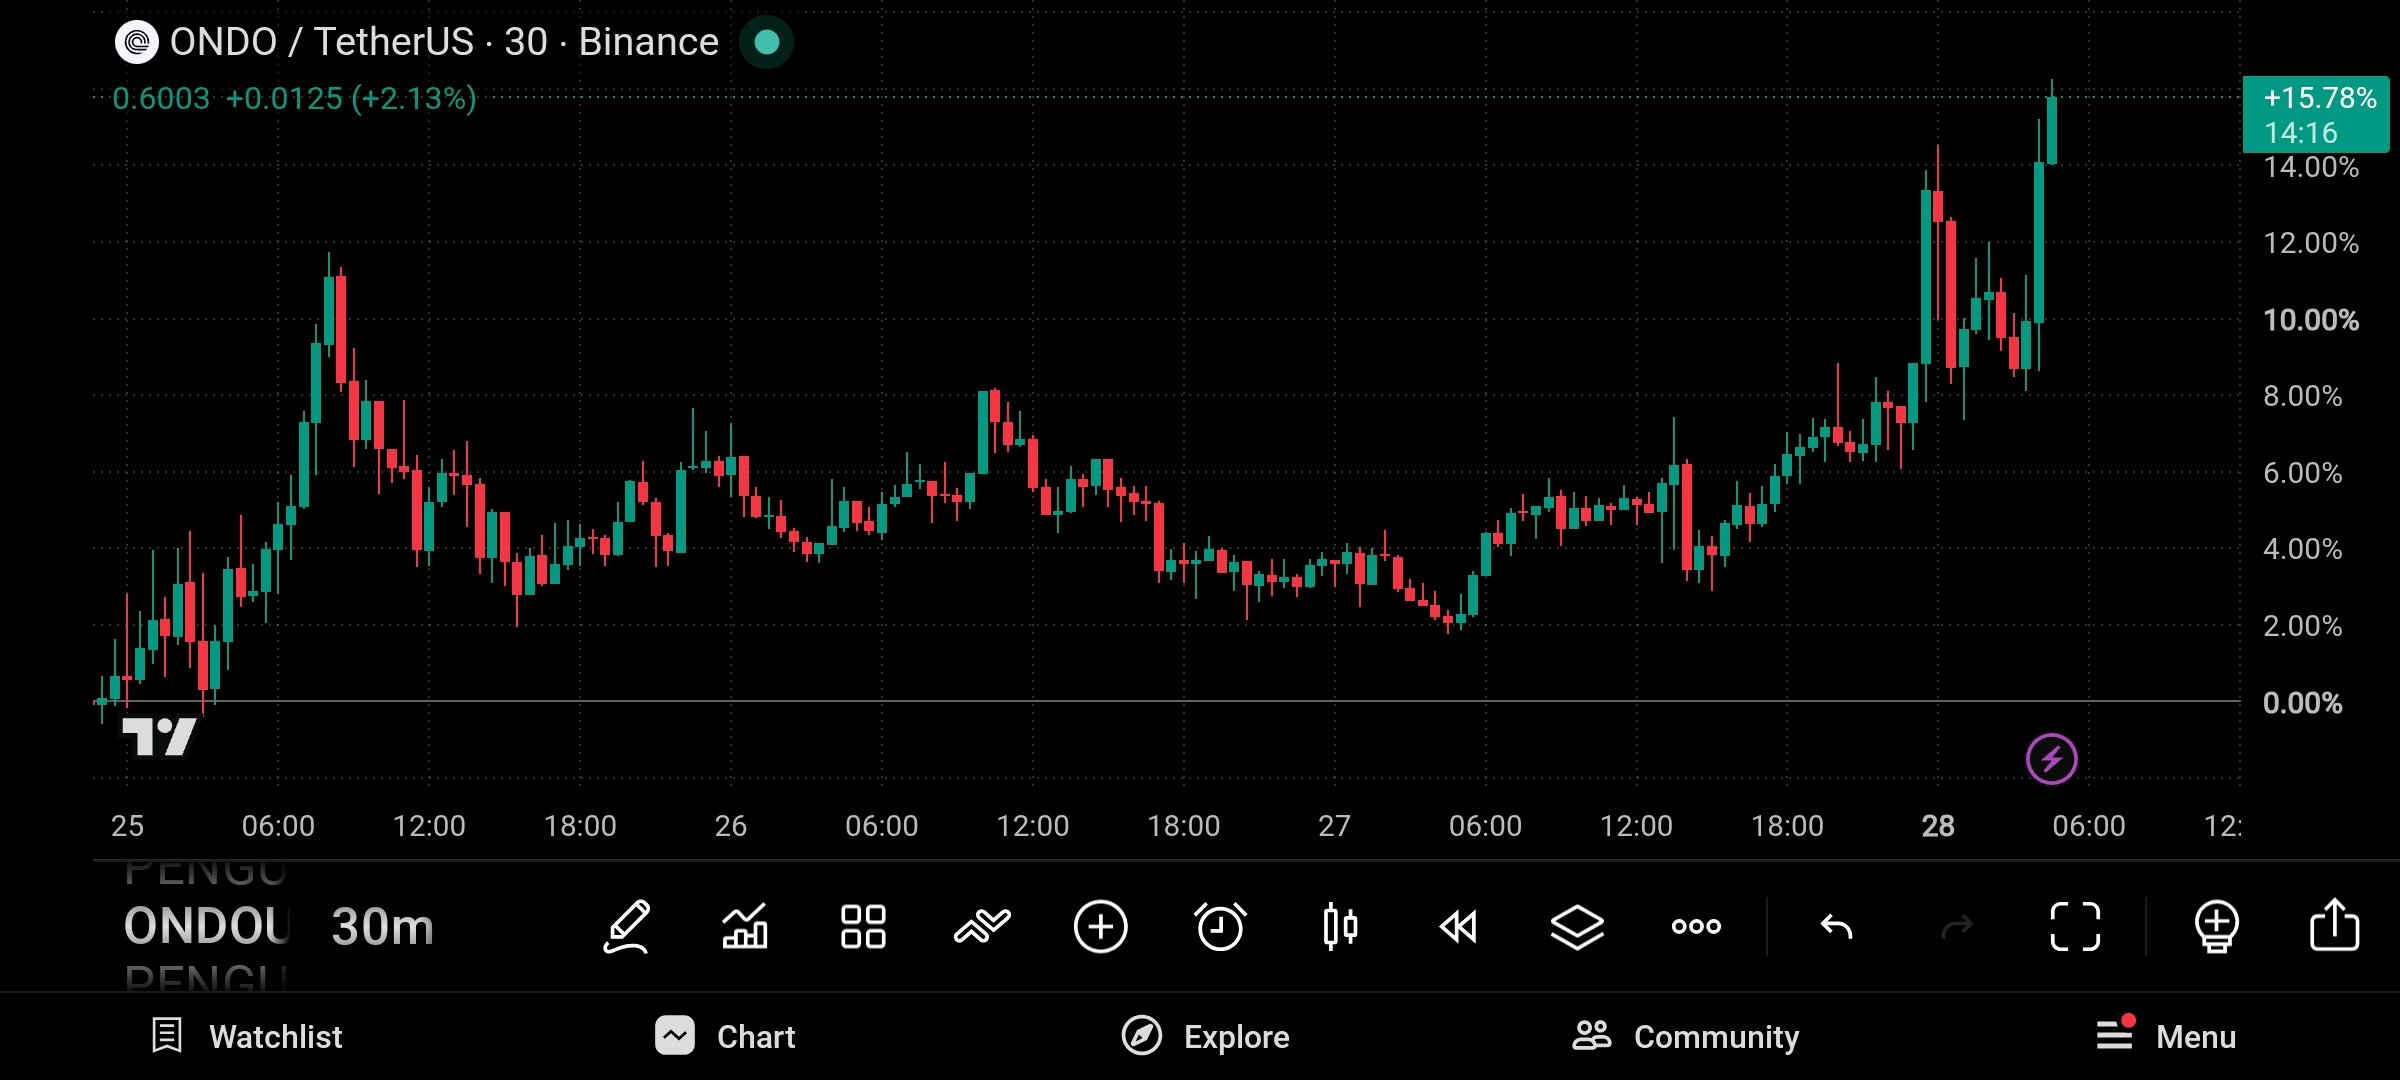
Ondo is breaking higher with strong buying pressure. Price is holding near the highs, and buyers are clearly in control right now. I’m watching for a continuation move as long as this breakout holds. 🔥🚀 ENTRY Point 👉0.6001 Stop loss 👉0.5800 Tip1 👉0.6200 👉0.6400 👉0.6600 let's go to trade quick Guy's $ONDOUSDT #ByXIMPACT
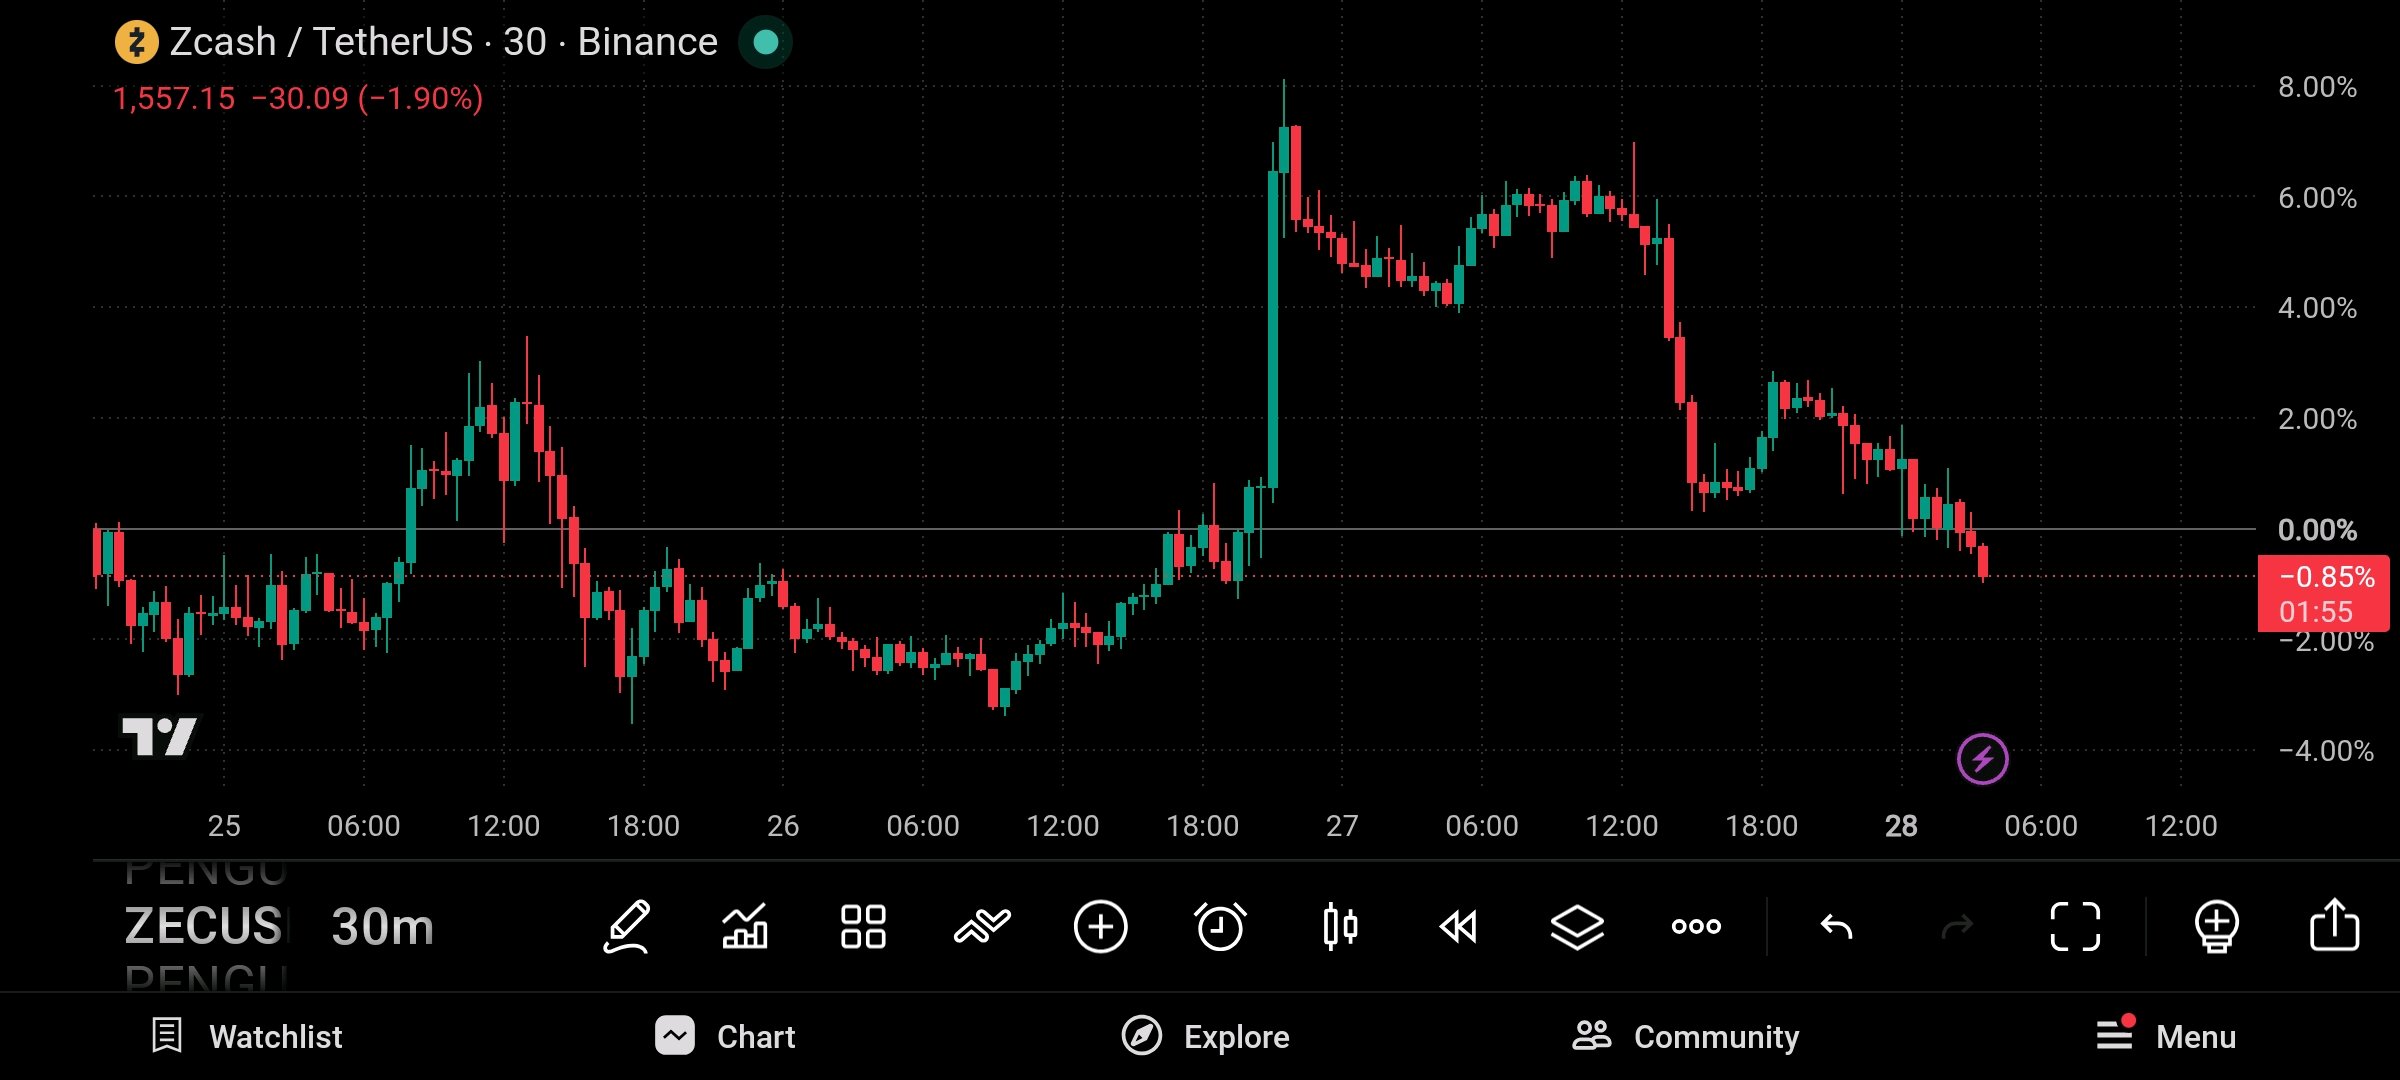
$ZEC is still under selling pressure after the recent bounce. In my view, the chart looks weak here, and another drop is possible if buyers don’t step in soon ENTRY Point 👉1,556 Stop loss 👉1,585 Tip1 👉1,530 👉1,500 👉1,480 let's go to trade quick Guy's #ByXIMPACT
LSK is holding near $0.34 after a sharp drop, and I’m watching for a bounce from this zone. Current price is around $0.338, with 24H change near -0.7%. 🟢 Buy Zone: $0.335–$0.345 🎯 TP1: $0.358 🎯 TP2: $0.375 🎯 TP3: $0.400 🛑 SL: $0.325 Support: $0.325–$0.340 Resistance: $0.358–$0.375 Market feeling: Bullish on a support hold. The long liquidation at $0.32122 shows sellers pushed hard, but a strong reclaim could bring buyers back. I’m watching $0.358 closely. Follow for more and Share with your friend my account. Share with your trading fam. #ByXIMPACT
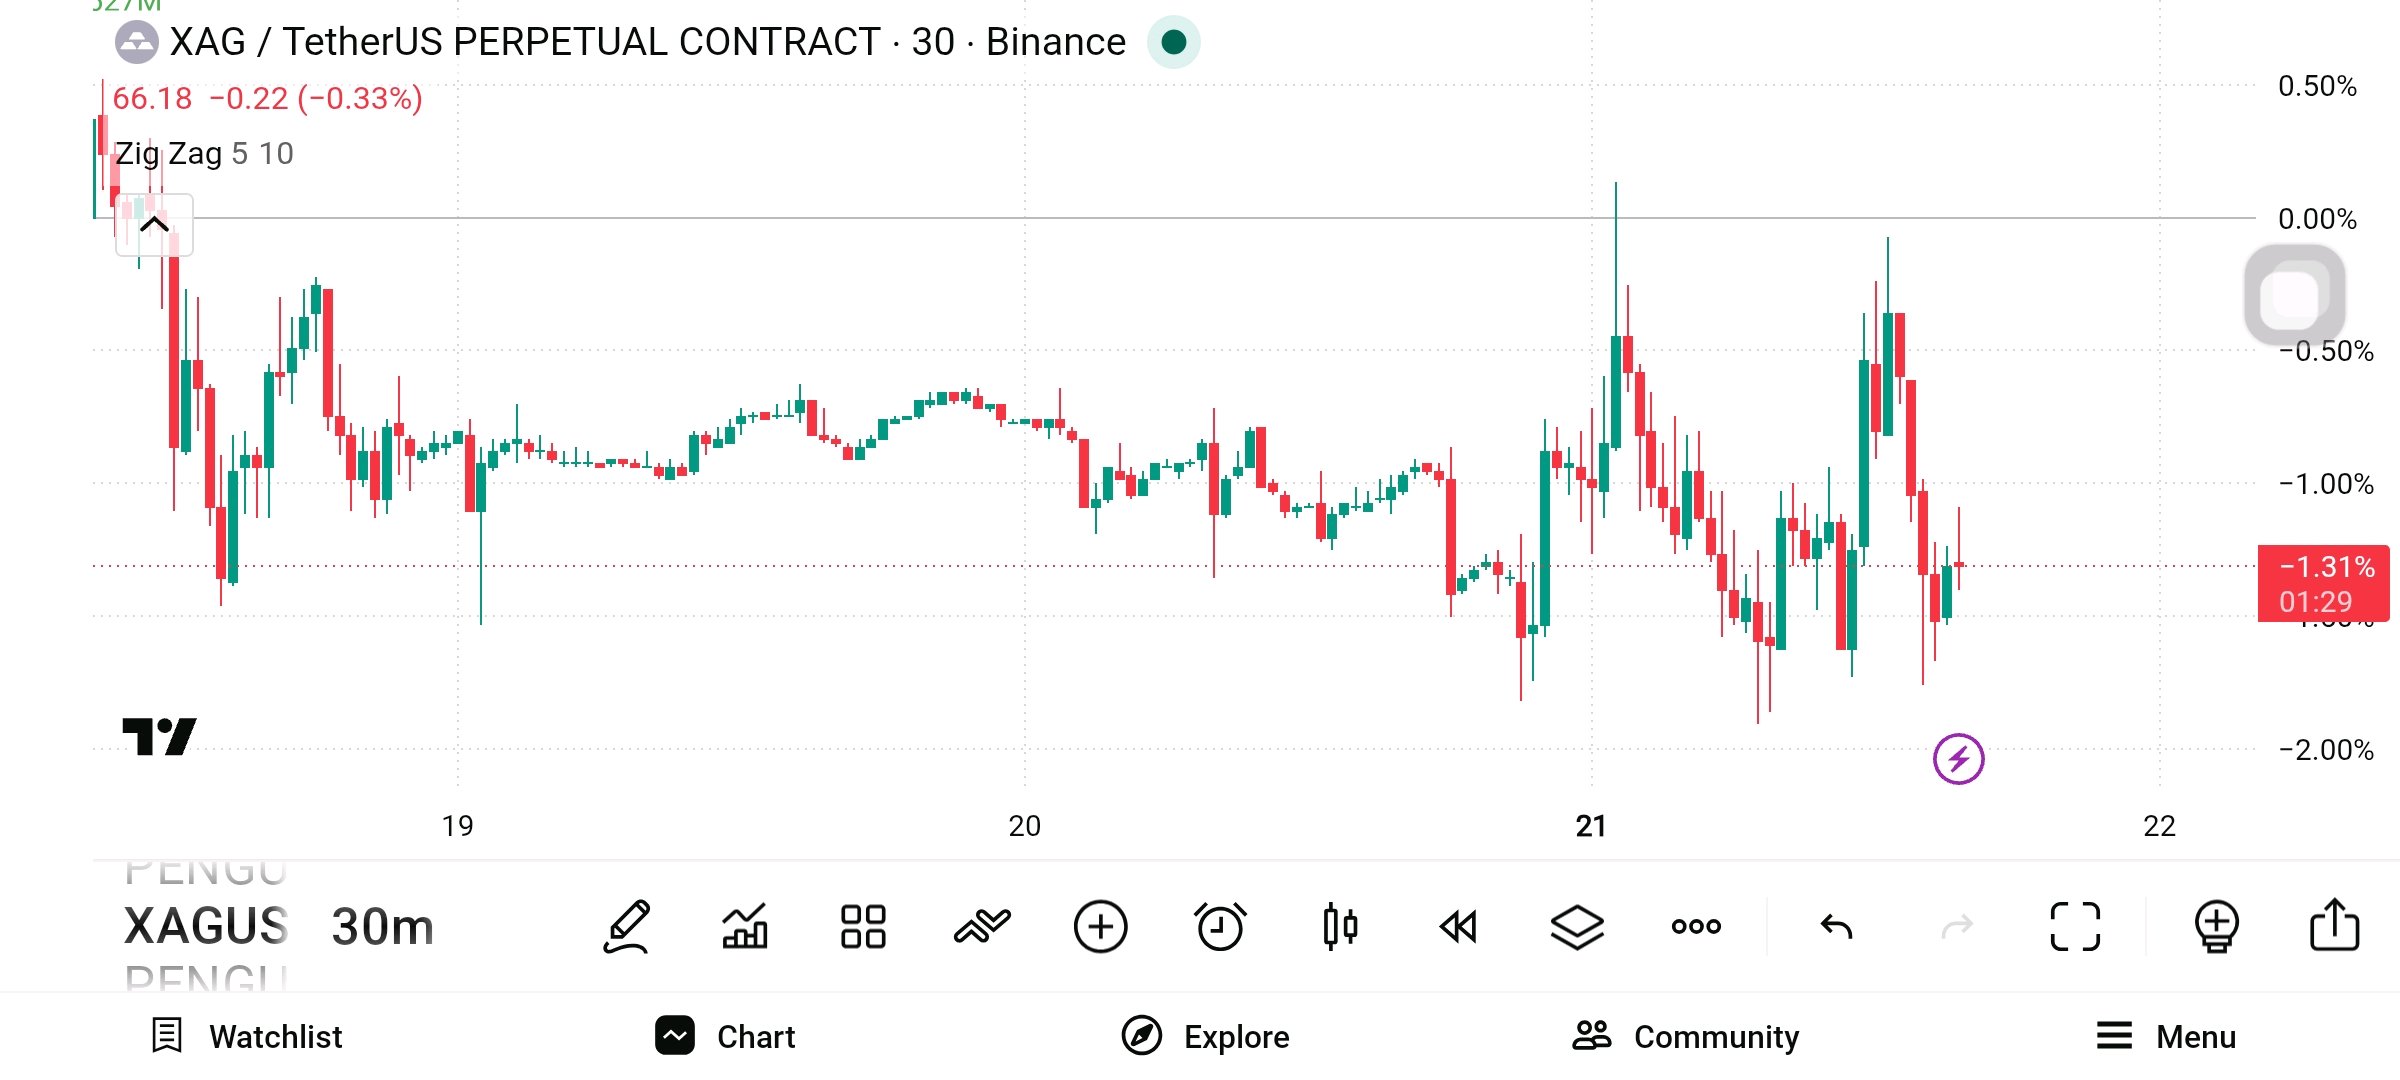
$XAG is getting interesting here 👀 Price is around 66.18, and sellers are still putting some pressure on the market. But this area could be important if buyers step in and defend support. 🟢 Buy Zone: 65.80–66.20 🎯 Targets: 66.80 → 67.50 → 68.20 🛑 SL: 65.30 Support: 65.80 Resistance: 66.80 If XAG reclaims 66.80 with strength, the next move could get exciting. For now, I’m watching how price reacts around support. 🔥 Follow for more & Share with your trading fam. #BybitAIBestReplies #TradFiOptions24/7