Technical Trader
I Share Market Analysis, Crypto News & Personal Opinions 📊 X:@HassanBullman
🔴Vitalik Just Dropped a Wake Up Call Most People Will Ignore Vitalik Buterin just told biologists to stop treating airborne diseases like an afterthought. He says more plagues are coming because of crowded cities, lab accidents, biotech gone wrong, and AI making it all easier. And he is not whispering about it. I think he is completely right and the silence around this topic is dangerous. We spent years obsessing over longevity pills and fancy gene edits while the air we breathe every day can still kill millions. Early detection, better ventilation, and open vaccines protected by private cryptography are not sci-fi ideas. They are tools we already understand and just refuse to fund properly. What makes his take different is the privacy part. Most governments want total control of health data. Vitalik wants systems that work without turning every person into a tracked data point. That combination is rare and smart. China-level protection without China-level spying is possible if we actually build it. Too many smart people chase shiny research that wins awards. Cleaning the air and spotting new viruses early does not win awards. It just saves lives quietly. I would rather see young biologists pile into this field than another longevity startup promising to make rich people live forever while regular people still catch whatever is floating around next winter. This is not about fear. It is about refusing to stay unprepared when the next wave hits. Vitalik put real money into this for years. Now he is calling for talent. That is the kind of practical leadership we need more of. What do you think about this? Don't forget to comment 💭 Follow for more content 🙂 #ByXIMPACT

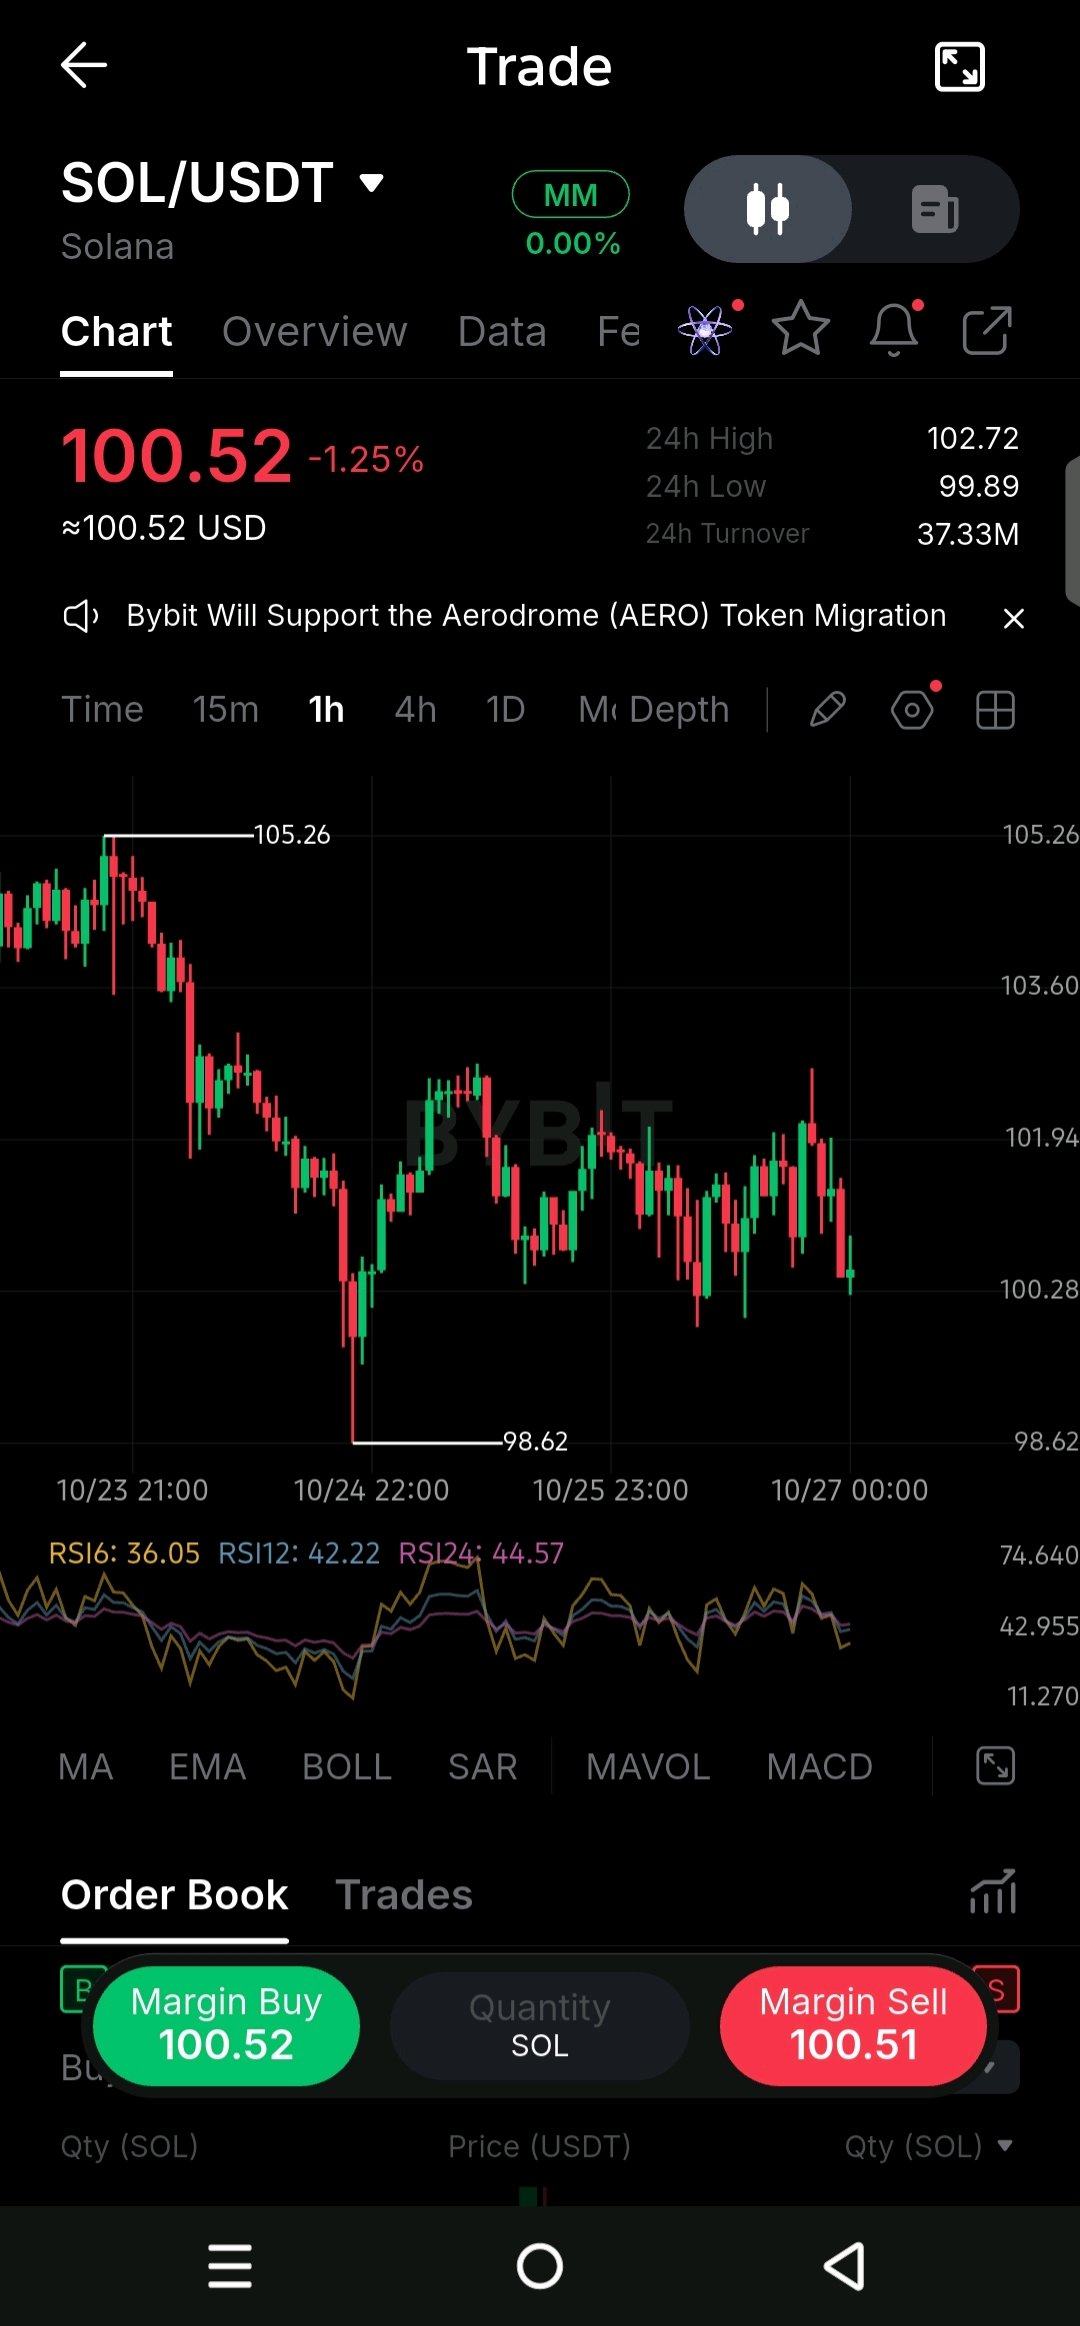
$SOLUSDT is struggling to hold $100.50 as sellers keep pressure on the price... 👀 On the 1H chart, SOL is moving sideways after a sharp drop from $105.26. Immediate SUPPORT sits around $100.28 → watch this level closely. Below that, $99.89 is the next visible area to watch. 📉 The major visible low is $98.62, where buyers previously stepped in. RESISTANCE is building around $101.94 → bulls need to reclaim this area. A BREAKOUT above $101.94 could open the way toward $102.72. RSI is below 50 across all three readings, showing weak momentum for now. If $100.28 breaks ⇒ downside pressure could increase. A strong recovery above $101.94 would challenge the bearish picture. Follow for more chart analysis 😎 #ByXIMPACT
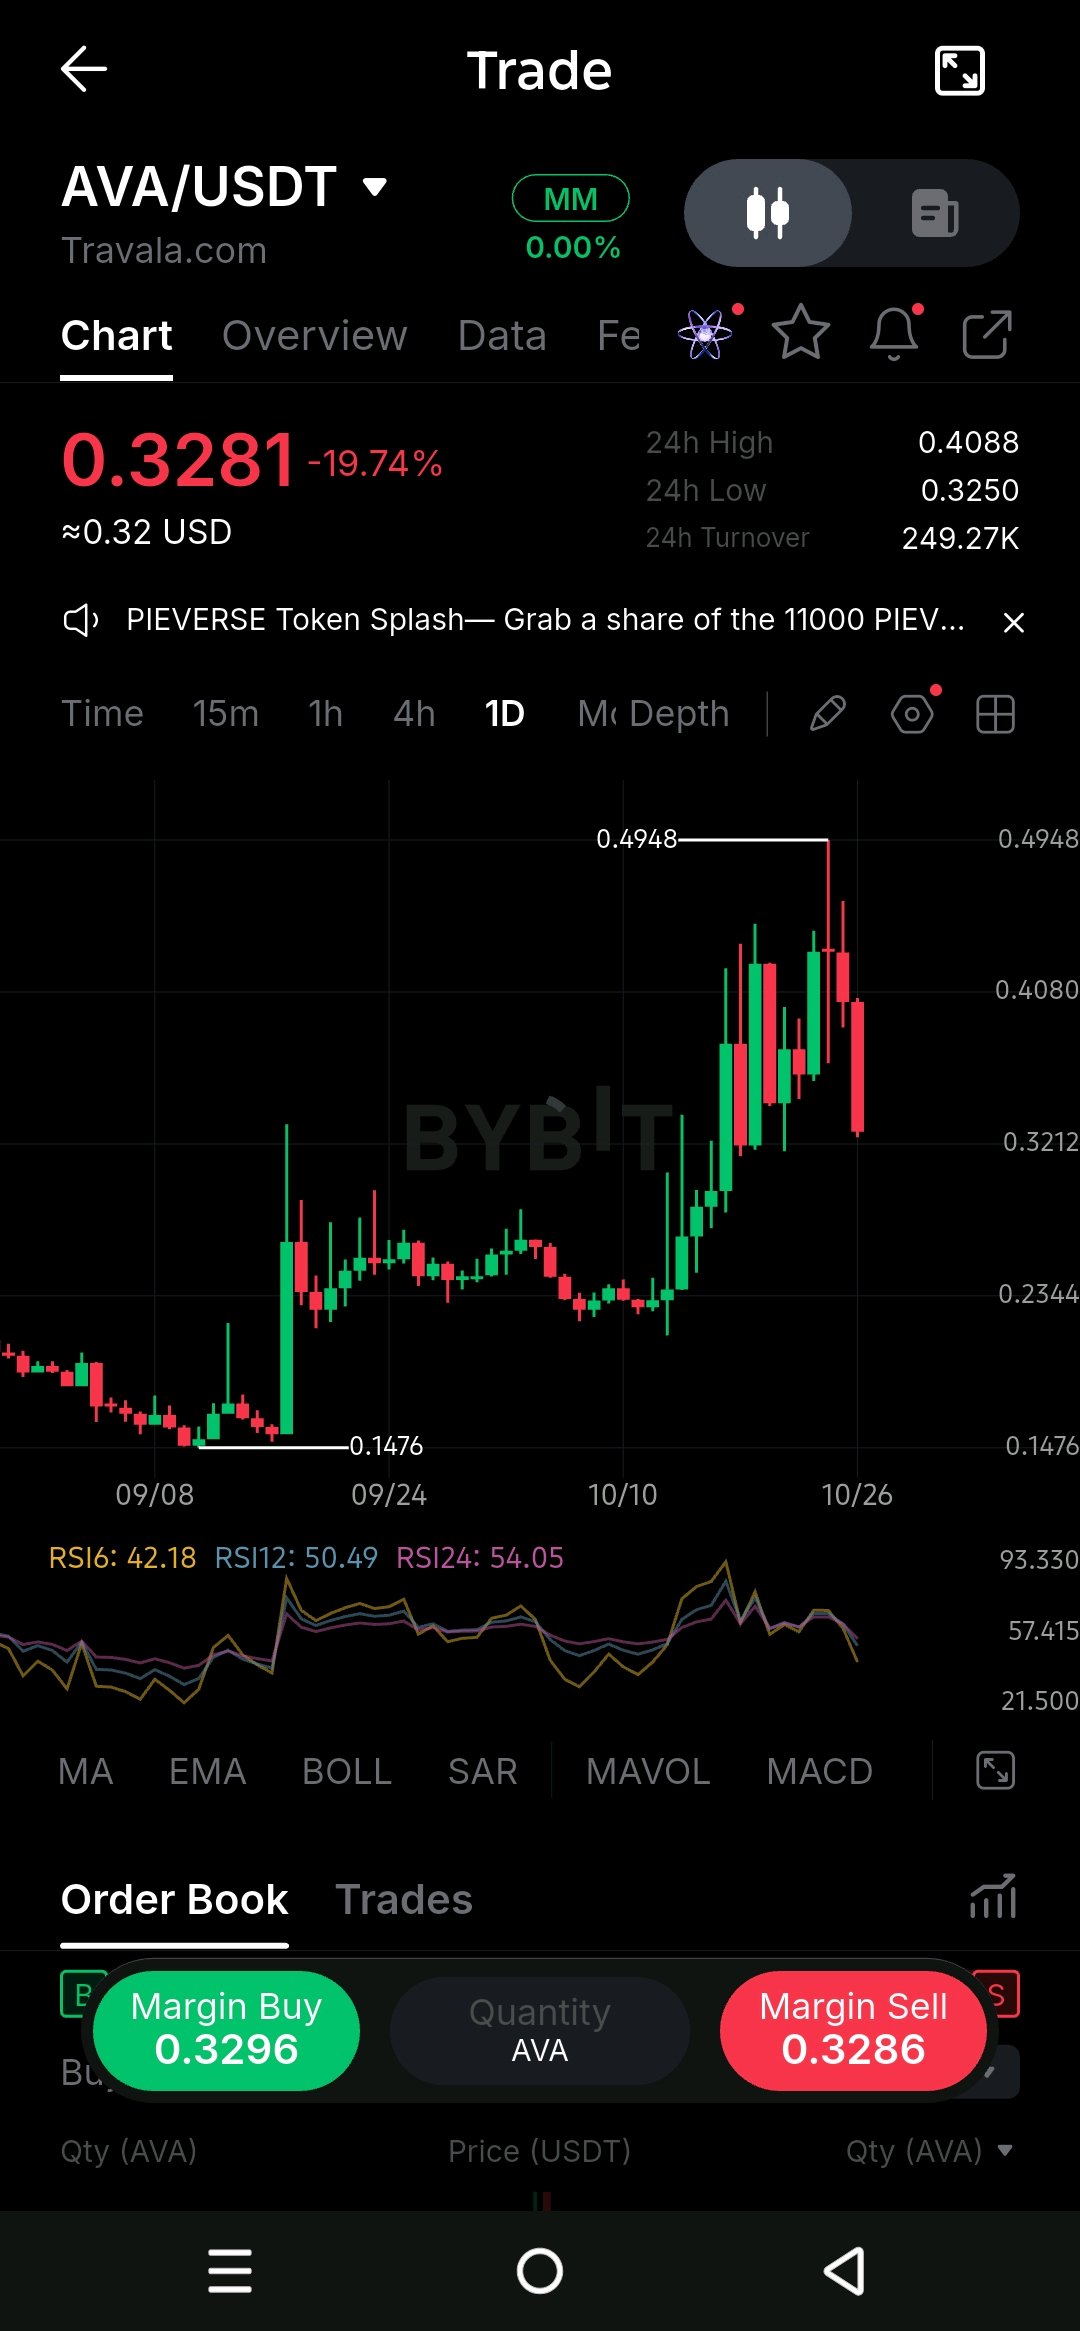
$AVAUSDT is facing strong SELLING PRESSURE after getting rejected near the $0.41 area... 📉 On the 1D chart, AVA is trading at $0.3281, down 19.74%. 👀 Price recently rallied from around $0.23 toward $0.49, but sellers have stepped in hard. The $0.40 to $0.41 zone is showing clear REJECTION after the recent rally. Now watch the $0.3250 SUPPORT... price is trading close to the 24H low. RSI6 is at 42.18, showing short-term momentum has cooled down. If $0.3250 breaks ⇒ more downside pressure could follow. But if support holds and buyers return → a recovery toward $0.40 becomes possible. ⚡️ The next key reaction is at $0.3250... a breakdown weakens the recovery idea, while a strong bounce could change the picture. Follow for more chart analysis 😎 #ByXIMPACT
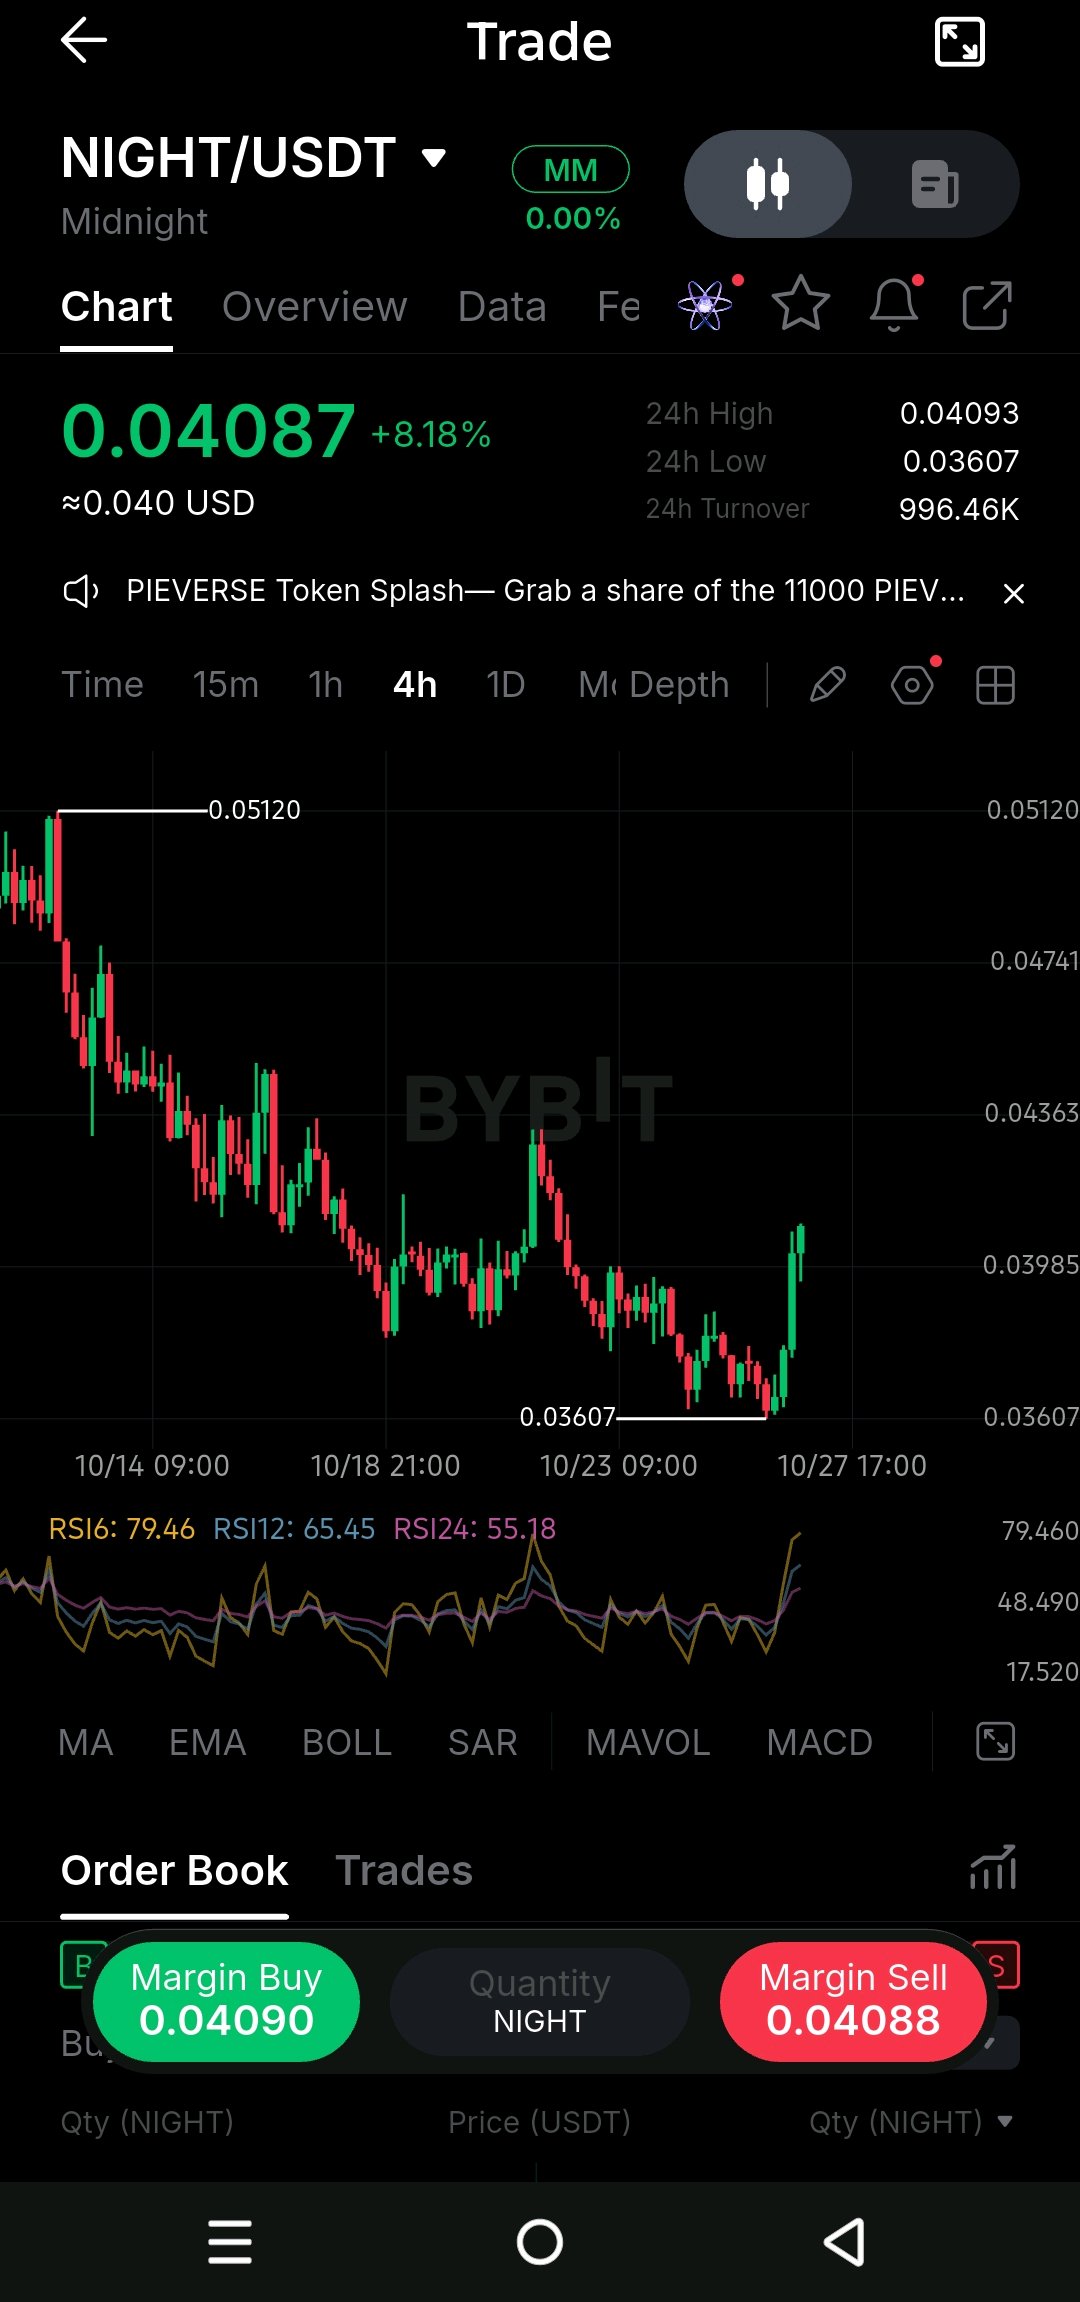
$NIGHTUSDT is bouncing strongly from the $0.03607 SUPPORT on the 4H chart... 👀 Price is now around $0.04087, up 8.18%, showing a strong bullish move. Look at this sudden green candle... buyers are stepping in after the recent decline. 📈 The bigger trend is still DOWN, so this bounce needs confirmation. RESISTANCE is near $0.04093, the visible 24H high. A BREAKOUT above this area → price could attempt to move higher. But RSI 6 is at 79.46... short-term momentum looks stretched. ⚡️ If price gets rejected ⇒ watch the $0.03985 area for support. If $0.03607 breaks, the bullish recovery idea weakens... keep an eye on the next reaction. Follow for more chart analysis 😎 #ByXIMPACT
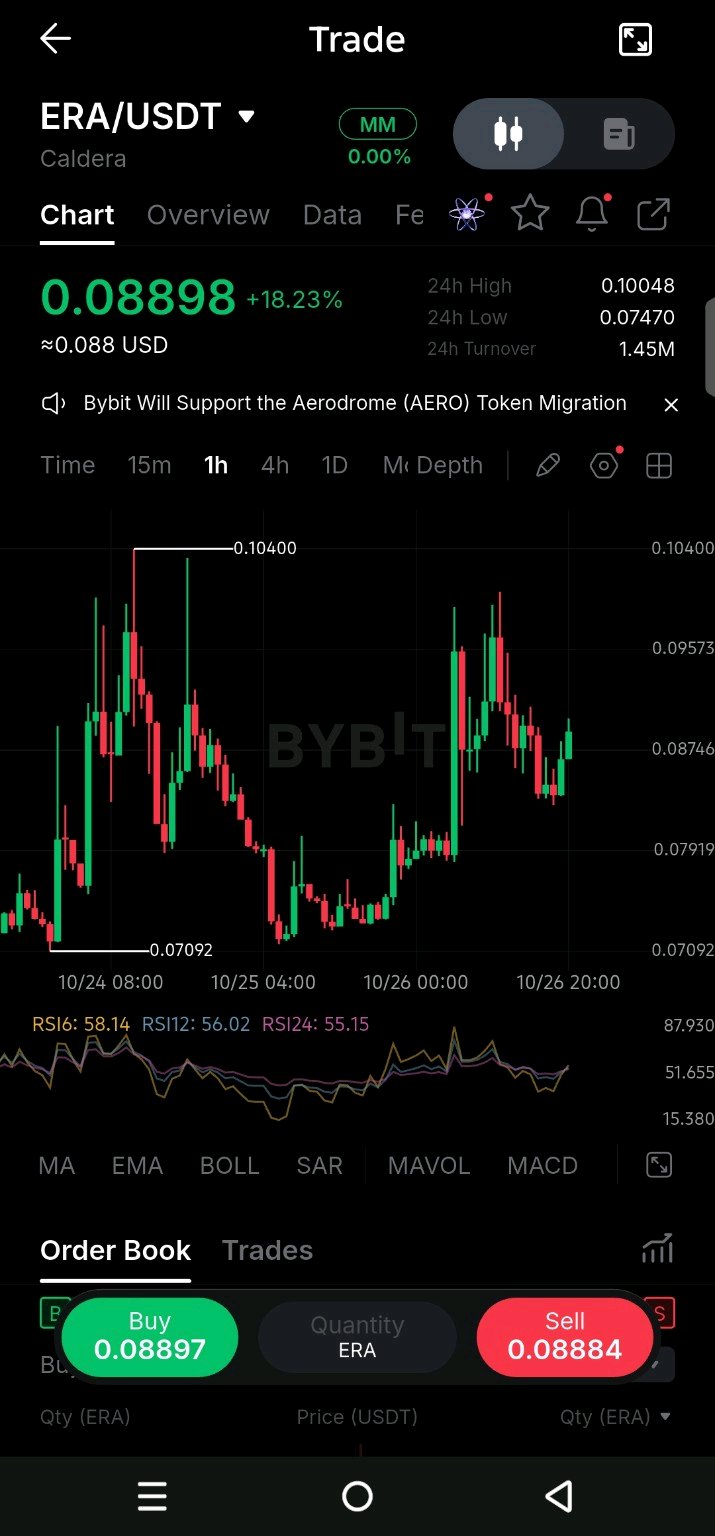
$ERAUSDT is pushing back up after bouncing from the 1H SUPPORT zone... 👀📈 Price is trading around 0.08898, up 18.23% in 24 hours. Look at this recovery... buyers pushed price from 0.07092 toward the 0.096 area. SUPPORT: 0.07919 → price previously consolidated around this zone. RESISTANCE: 0.09573, with the recent high near 0.10400. RSI is around 55 to 58 → momentum is slightly bullish right now. If ERA breaks 0.09573, another move toward 0.10400 could be possible. 🎯 But rejection near RESISTANCE could send price back toward 0.08746 or 0.07919. Watch the next reaction... losing 0.07919 would weaken this recovery setup. Follow for more chart analysis 😎 #ByXIMPACT
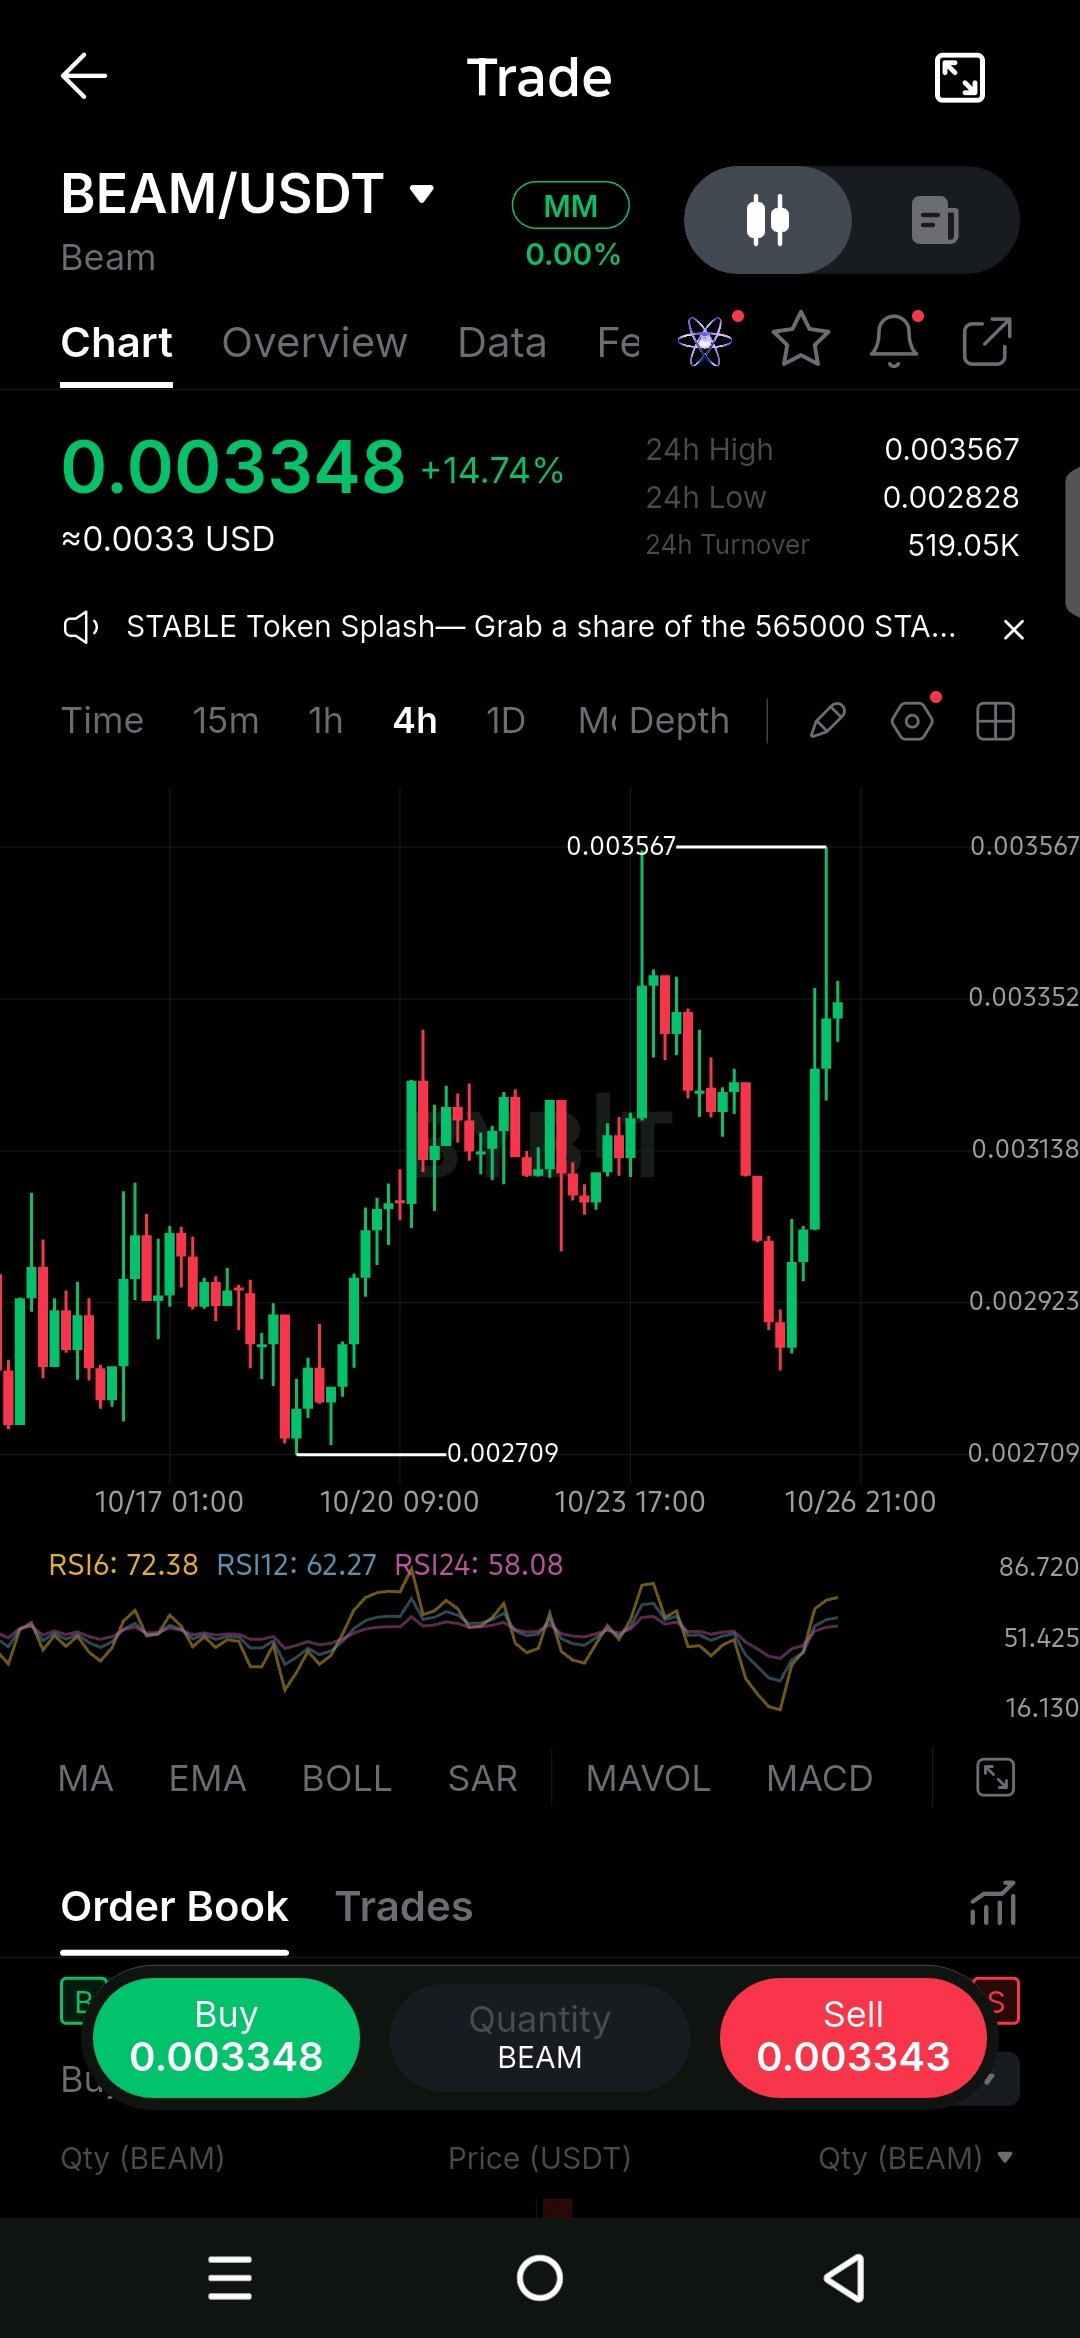
$BEAM is showing strong bullish momentum on the 4H chart after a sharp recovery... 📈 Guys, price is now around 0.003348, up 14.74%. 🔥 Look at that bounce from the 0.0028 area... buyers stepped in aggressively. Now BEAM is approaching the 0.003567 RESISTANCE 👀 A BREAKOUT above this level could open the door for further upside. But RSI 6 is at 72.38 ⇒ short-term momentum looks stretched. If price faces REJECTION here, a pullback could follow. Keep an eye on 0.003138 as the next visible SUPPORT. What happens at 0.003567 will be important... a rejection could weaken the recovery. Follow for more chart analysis 😎 #ByXIMPACT
Saylor Just Told Saudia How to Get Rich with BTC🔥
Michael Saylor looked straight at Saudi Arabia’s huge money fund and said the quiet part out loud. Buy Bitcoin if you want your cash to grow a thousand times bigger. I think he is completely right. These giant funds sit on piles of oil money and keep pouring it into the same old stuff. That approach worked for decades but the world is changing fast. Bitcoin is the one asset that keeps proving it can multiply wealth like nothing else when you give it time. If Saudi Arabia actually listens and starts buying in a serious way the whole market will feel it. Their money is so big that even a small piece of it would move prices hard. Saylor is not just talking for fun. He is calling out the biggest players because he knows they can no longer pretend Bitcoin is some side experiment. What do you think about this? Don't forget to comment 💭 Follow for more content 🙂

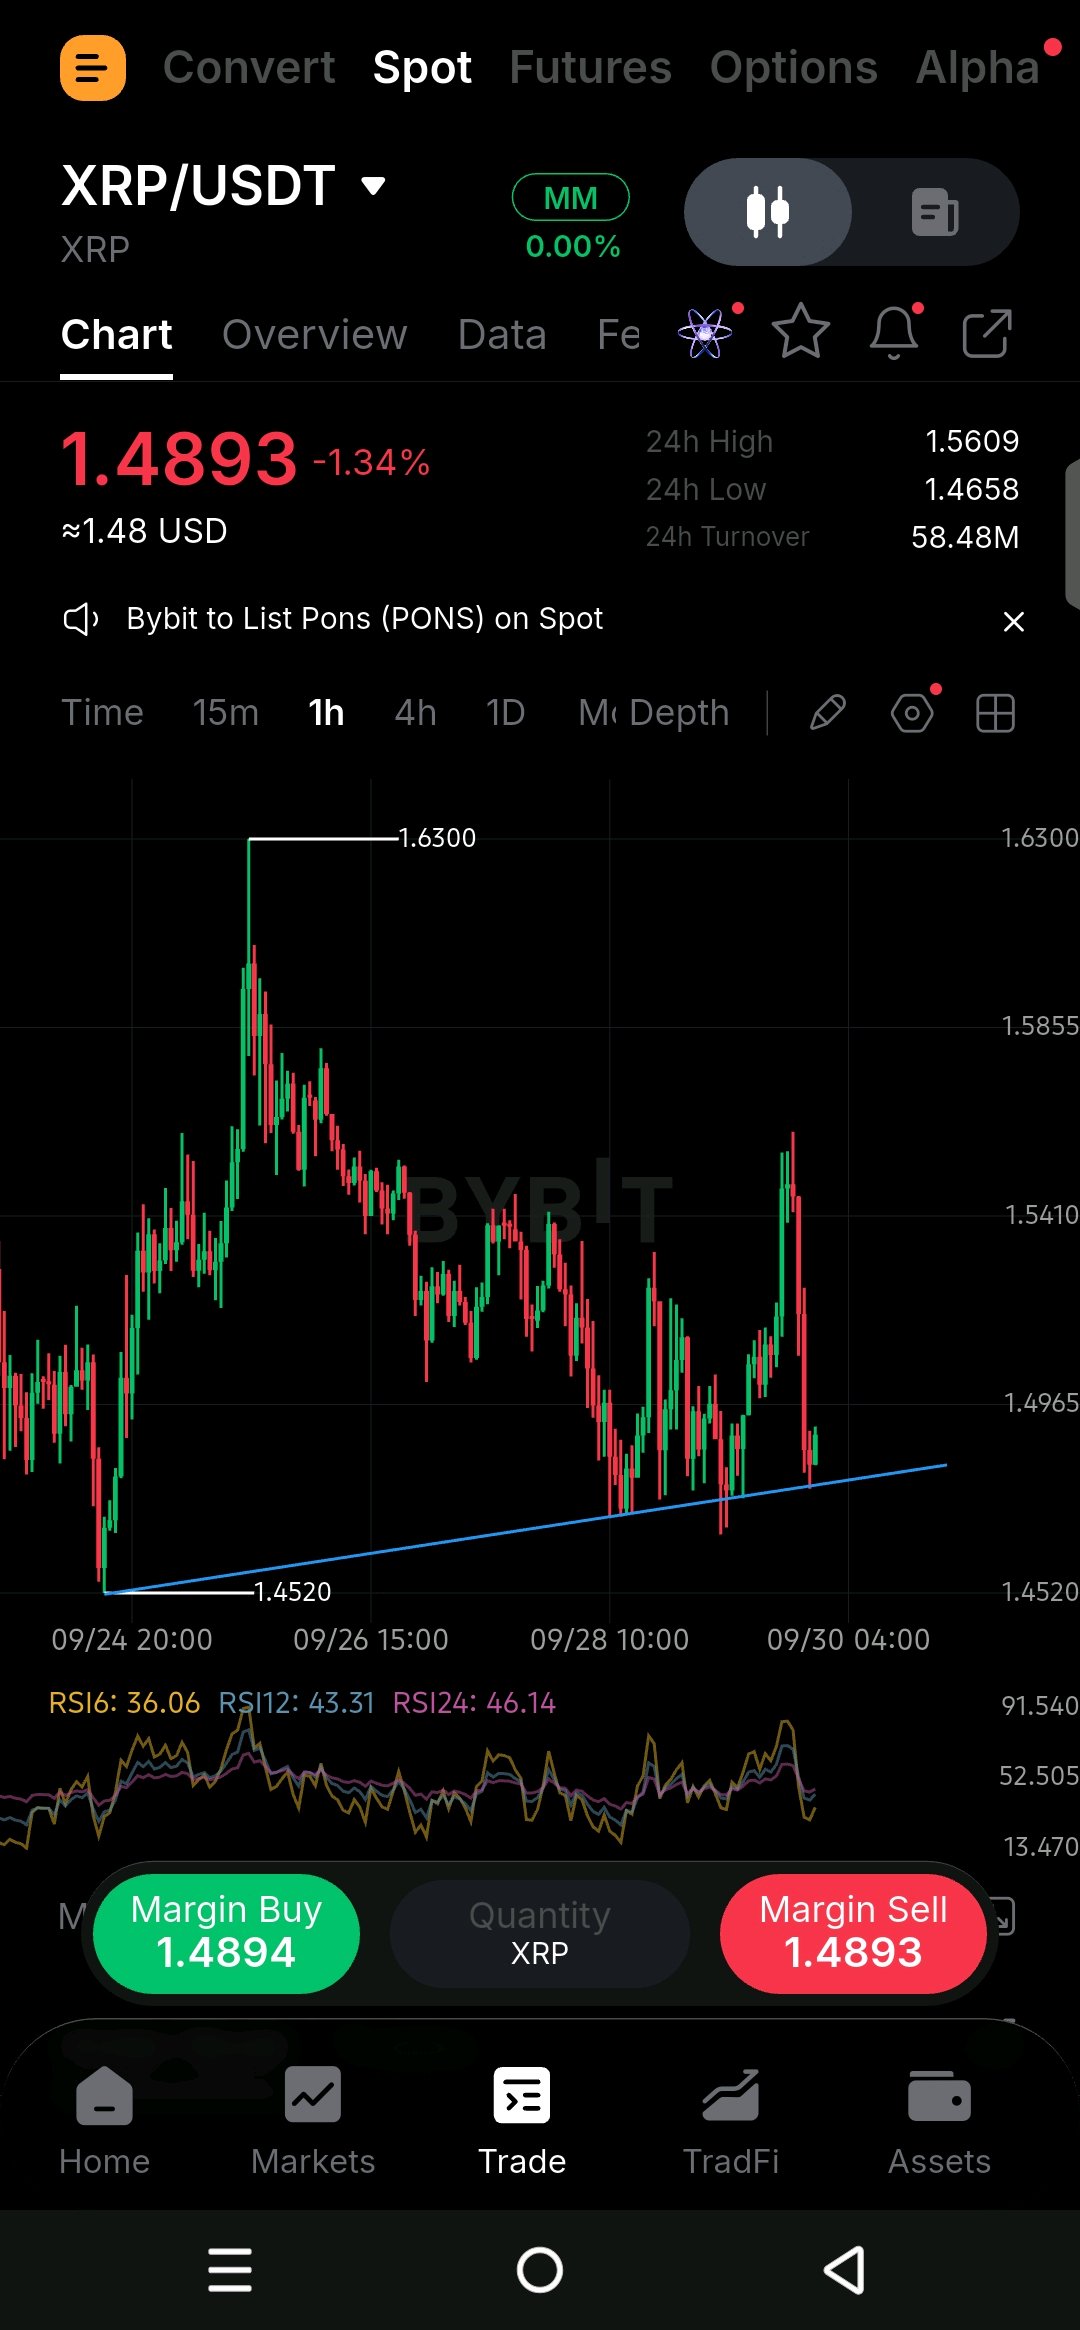
$XRPUSDT is testing the rising SUPPORT around 1.45... 👀 Price rejected the 1.546 RESISTANCE and pulled back sharply ⇒ now this support is key. Look at this area... buyers have defended it several times around 1.45-1.46. If SUPPORT holds → price could retest 1.546 again. 📈 But a BREAKDOWN below 1.45 would weaken the structure and bring lower levels into focus... 📉 Guys follow for more chart analysis 😎 I’ll keep showing you exactly what the chart is telling us. 👀🔥# #ByXIMPACT
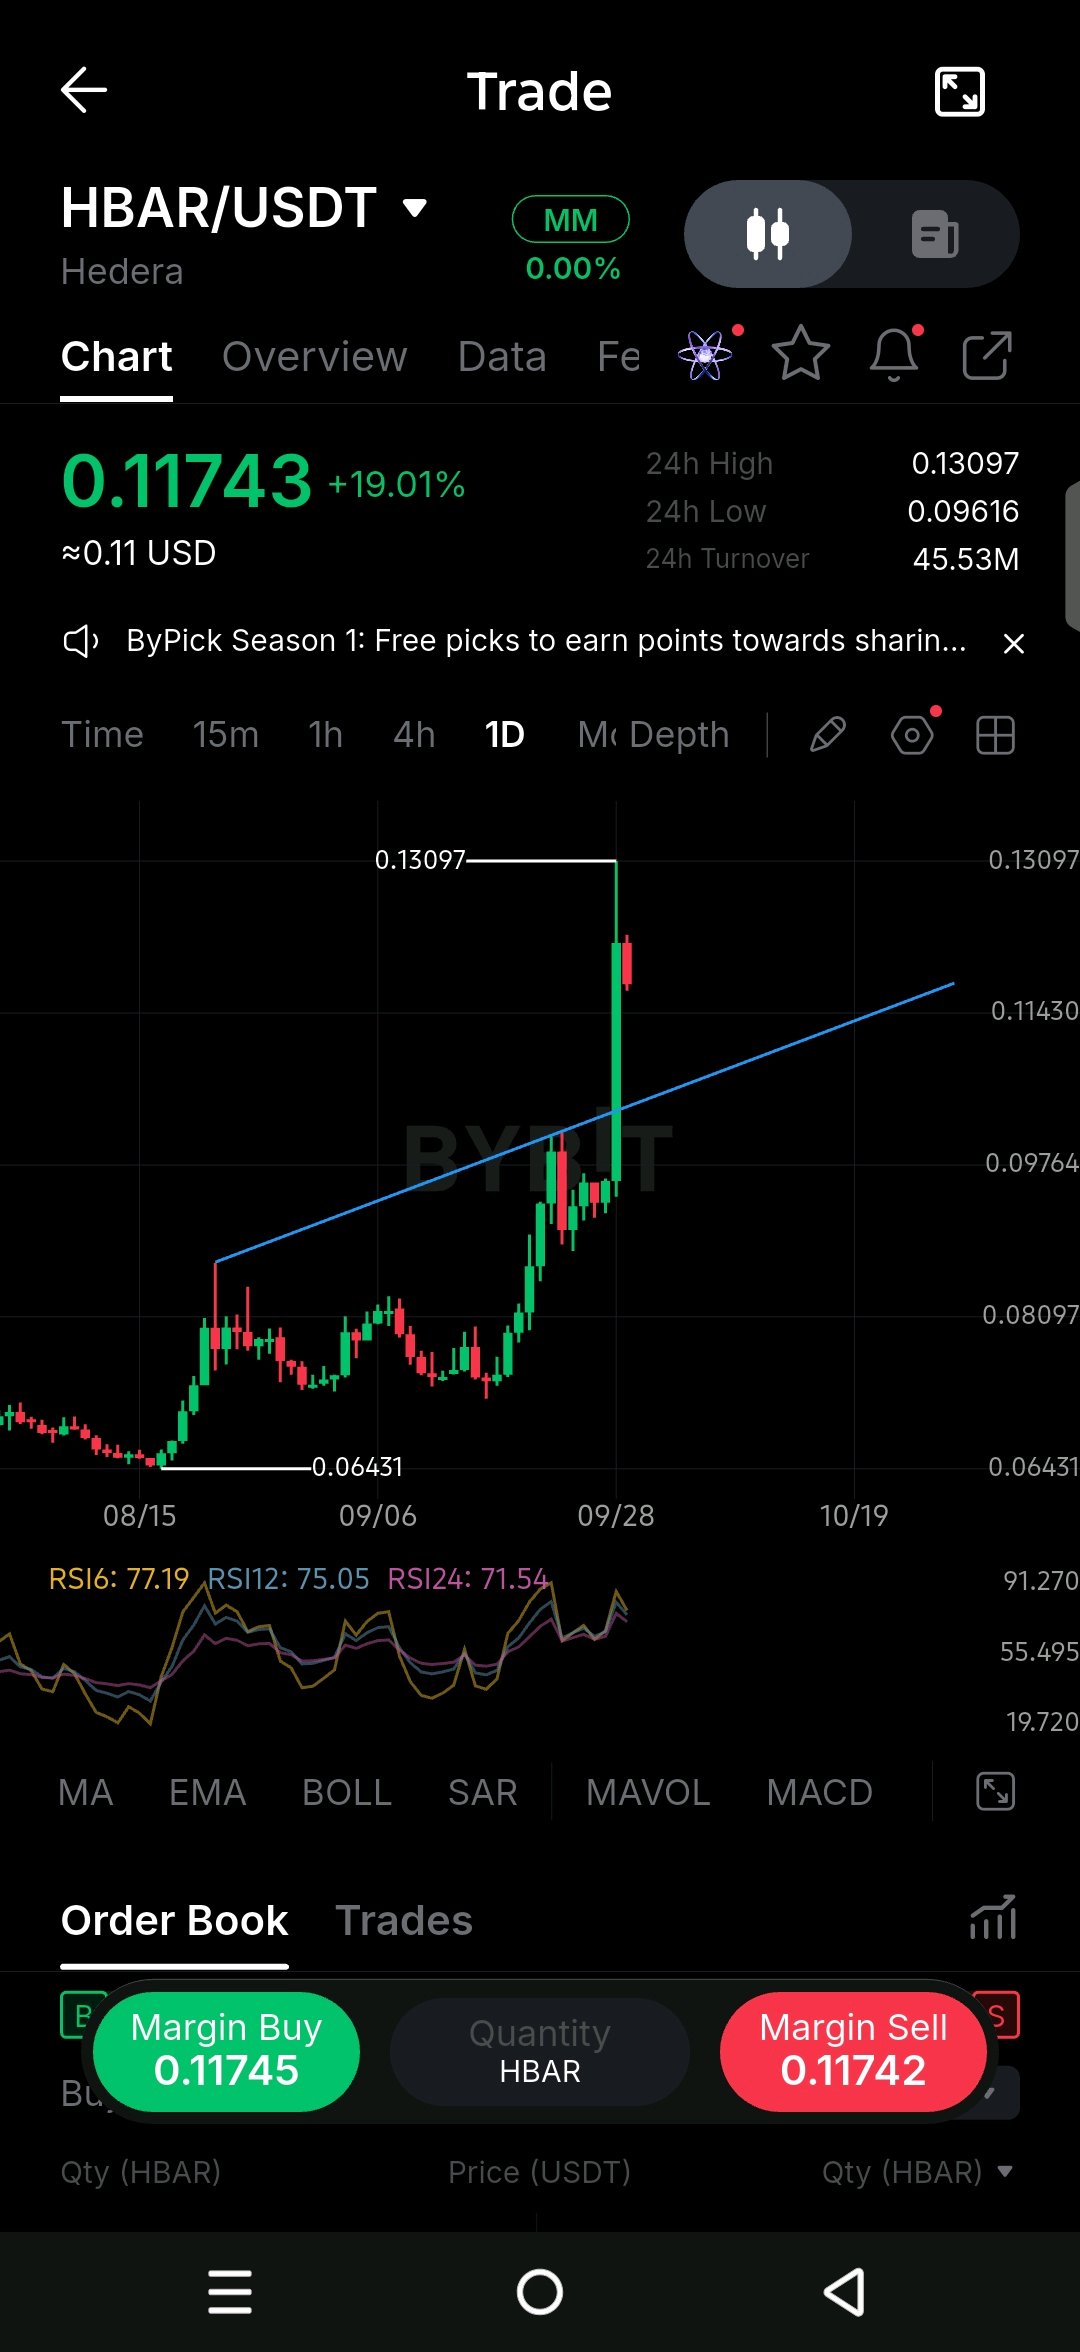
$HBARUSDT Look at that move from around 0.09764 to 0.13097... strong BUYING pushed price well above the rising trendline before the rejection appeared. 📈 Now price is around 0.11743, sitting close to the visible trendline area near 0.11430. KEEP AN EYE ON THIS SUPPORT... a hold here could keep the bullish structure intact. The RSI readings are high at 77, 75 and 71... so momentum is strong, but price is also showing some cooling after the big move. Notice that rejection from 0.13097... this is the key RESISTANCE right now. 👀 If HBAR holds the 0.11430 area and starts moving higher again, 0.13097 becomes the level to watch for another BREAKOUT. But if that trendline SUPPORT breaks clearly, the next visible area around 0.09764 becomes important. 🎯 So now watch the reaction around 0.11430... a strong hold keeps the current structure alive, while a clear BREAKDOWN below this support would invalidate the bullish idea shown by the rising trendline. Guys follow for more chart analysis 😎 I’ll keep showing you exactly what the chart is telling us. 👀🔥 #ByXIMPACT
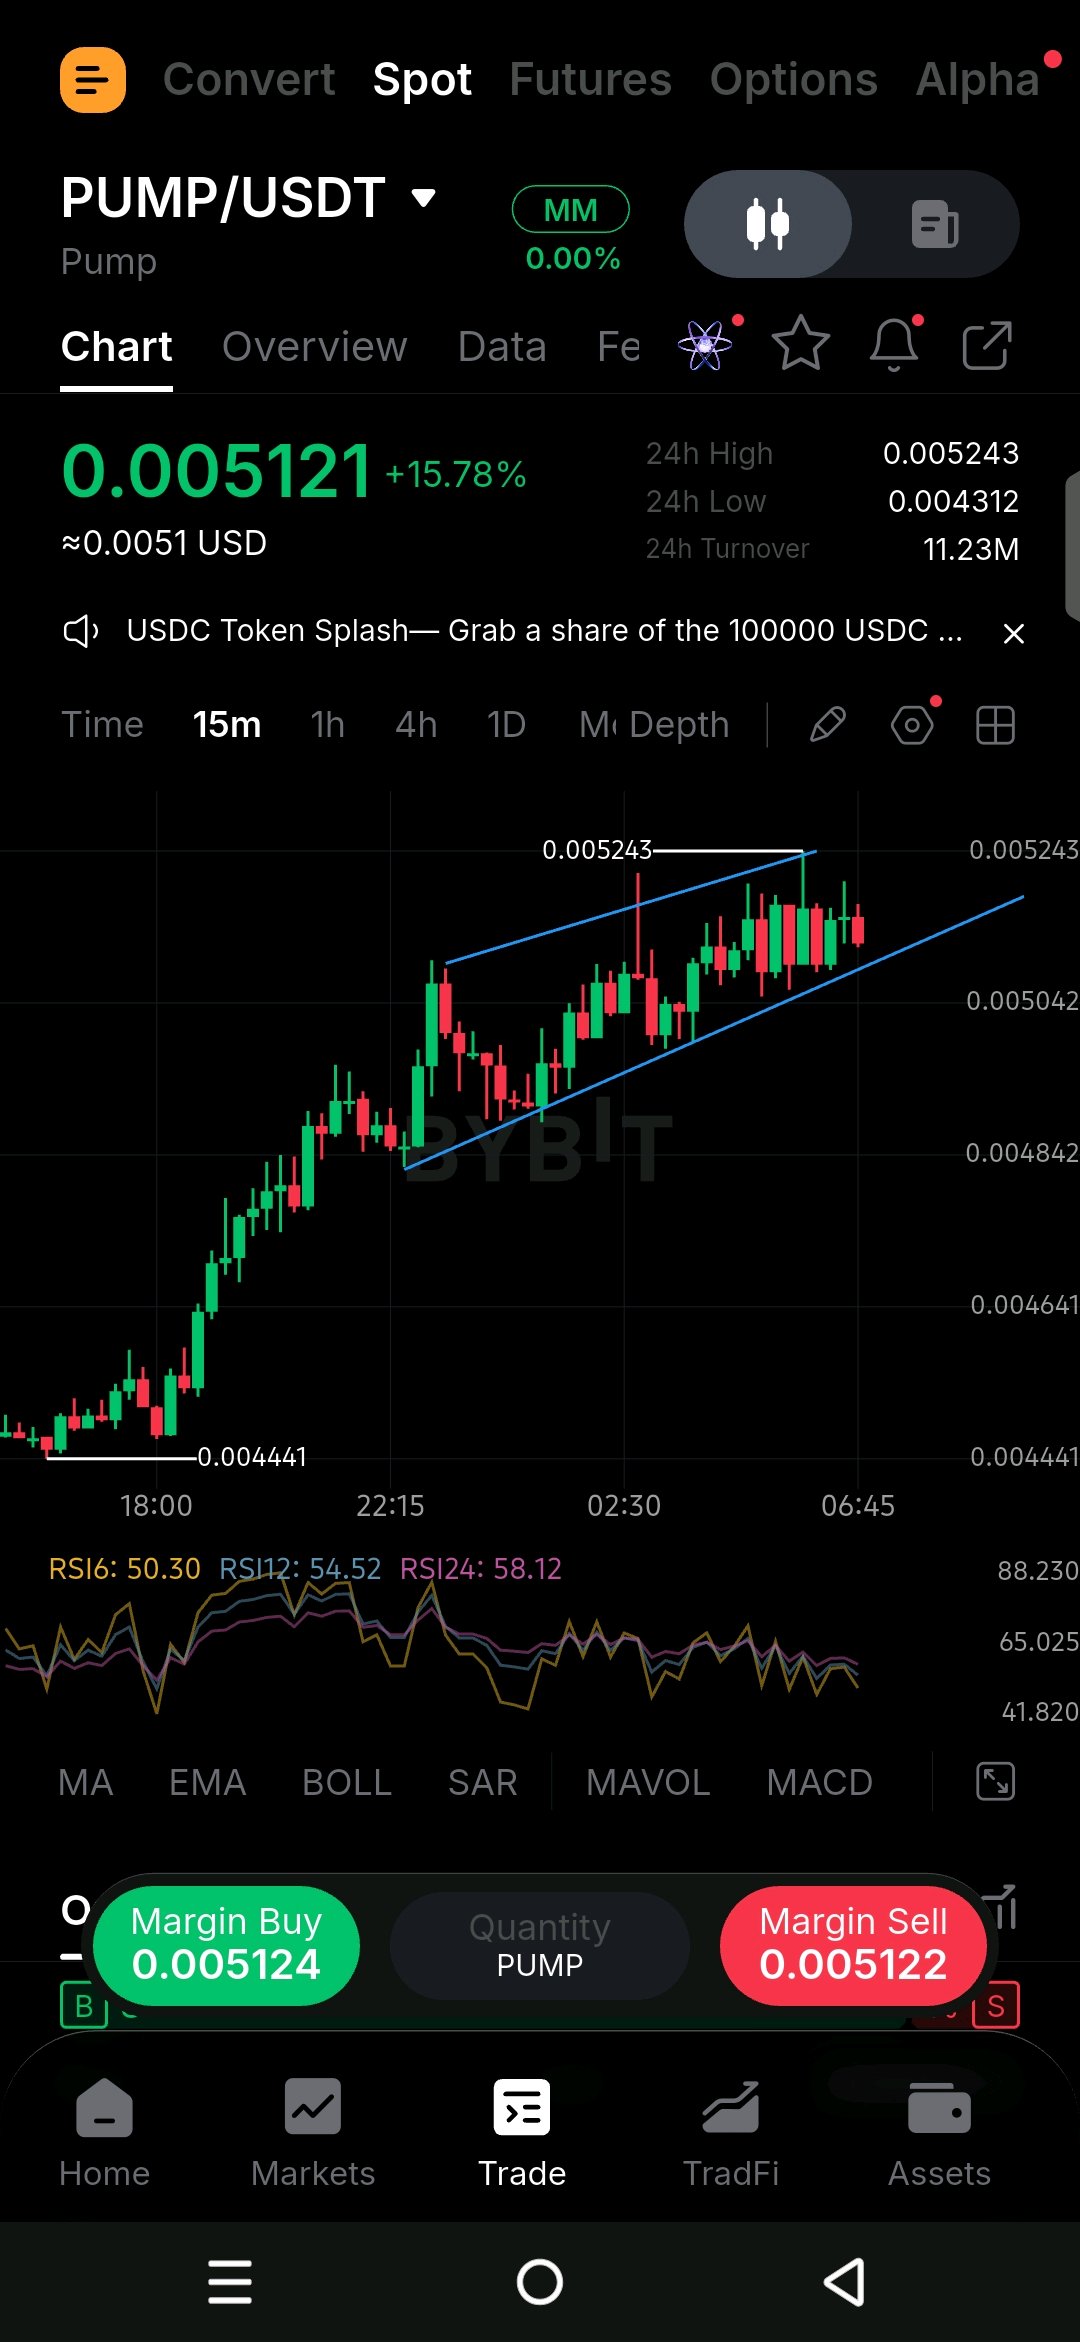
$PUMPUSDT is currently around 0.005121, up 17.21%, and the 15m chart is clearly moving inside an ascending channel. You can see a sequence of higher highs and higher lows, with price respecting the channel boundaries so far. 📈 Take a look at the 0.005247 area 👀 This is the recent visible high and immediate resistance. Price has tested this zone and pulled back slightly, so a clean break and hold above 0.005247 could open the way toward the upper channel area around 0.00537. On the other side, the middle and lower channel lines are important areas to watch for support. RSI is around 58, which shows momentum is still positive without being extremely overextended. Volume has also been active during the move, but notice the recent candles are becoming more mixed near resistance. If price loses the lower channel support and starts forming lower highs and lower lows, the current structure would weaken and a deeper pullback could develop. 📉 For the bullish scenario, watch how price reacts around 0.005247 and whether it can hold above that level. For the bearish scenario, a clear breakdown of the lower channel would invalidate the current rising structure. Keep an eye on these reactions rather than assuming either direction is guaranteed. 🎯 Guys follow for more chart analysis 😎 I’ll keep showing you exactly what the chart is telling us. 👀🔥 #ByXIMPACT
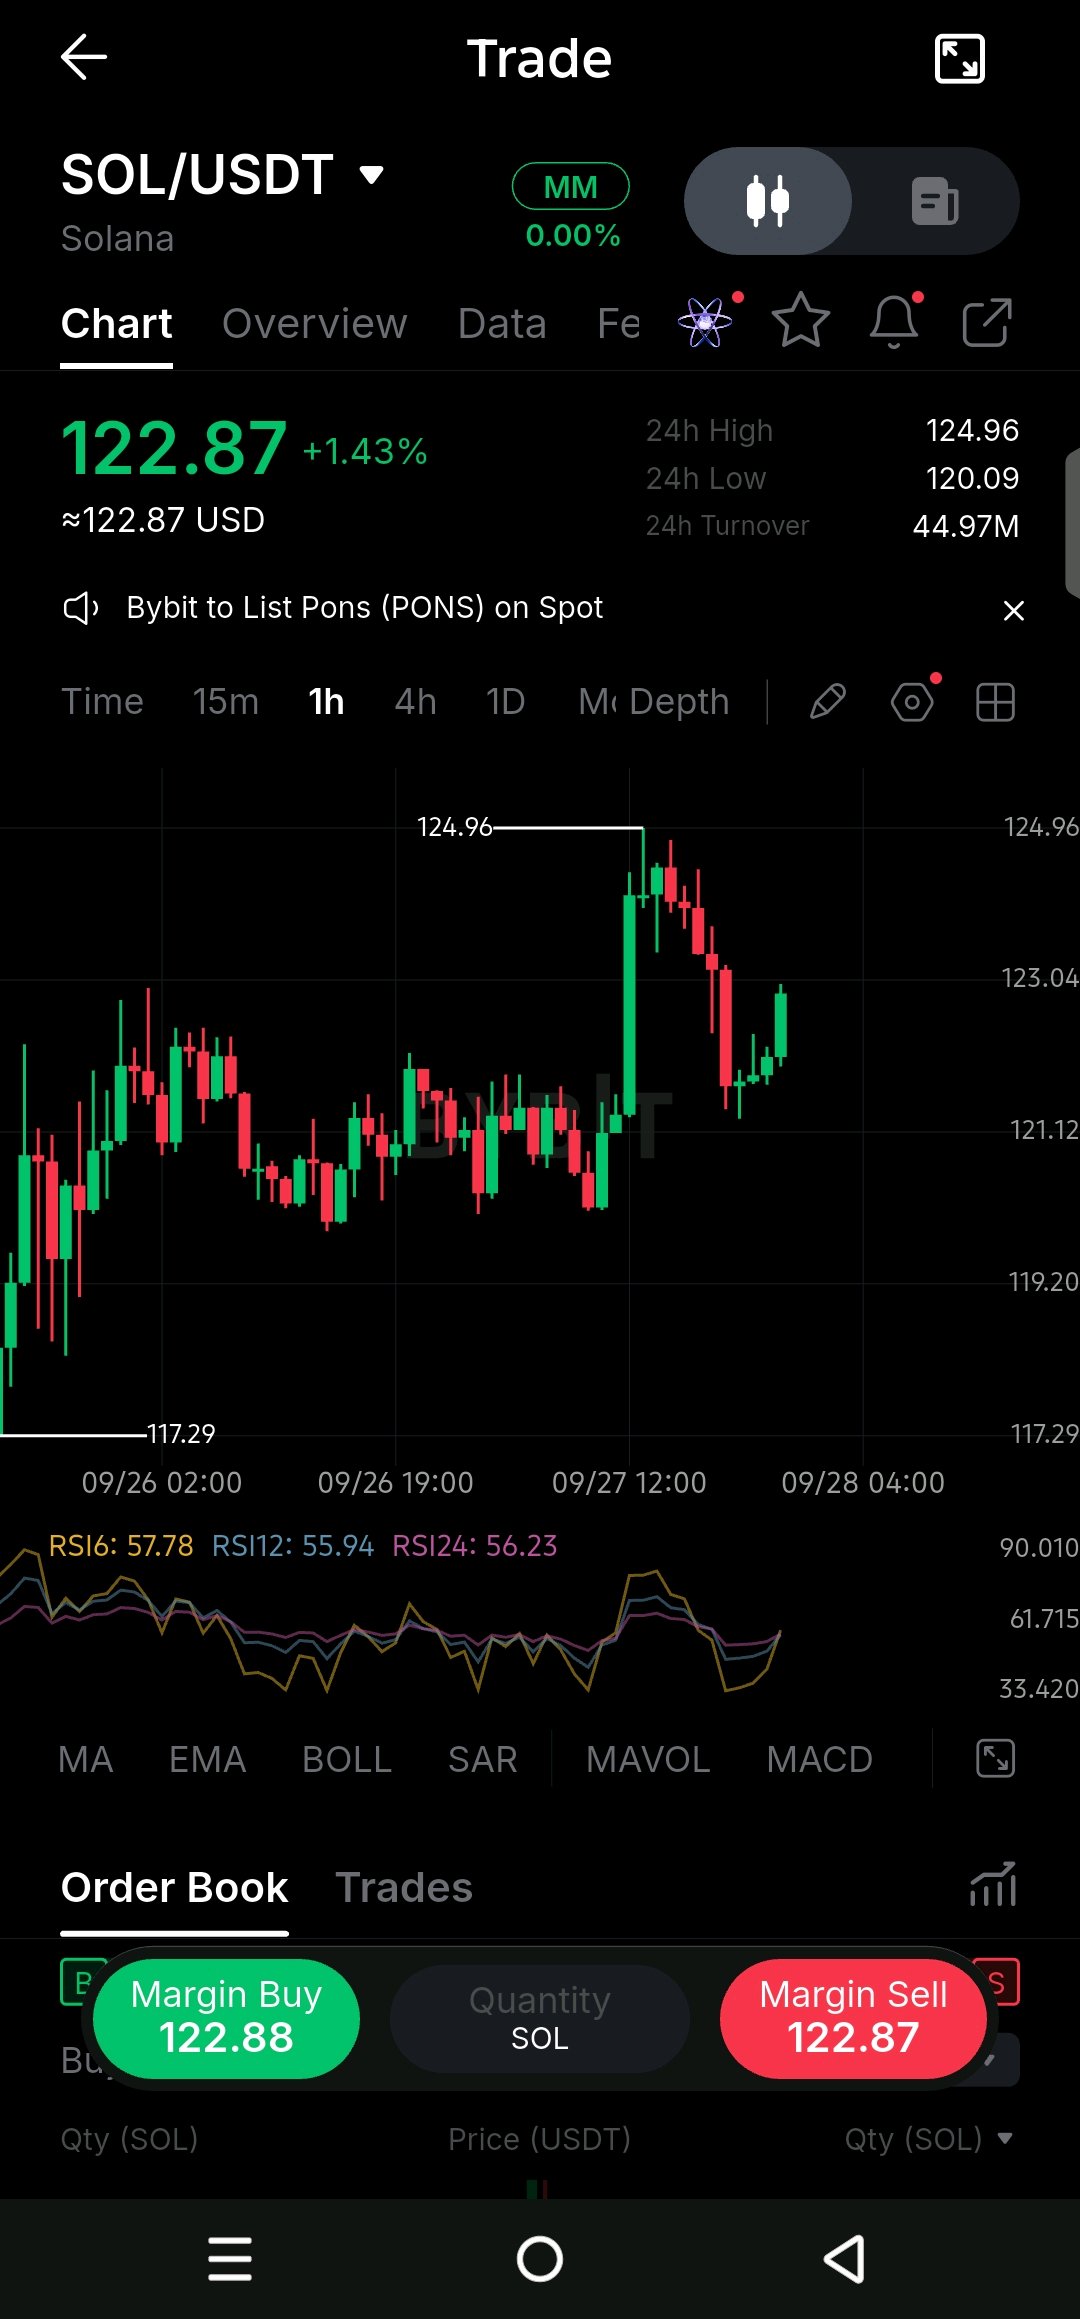
$SOLUSDT is currently around 122.88 on the 1H chart. Notice how price broke above the descending trendline and then pushed strongly toward 124.95 before facing rejection. After that move, sellers pulled price back toward the 120.88 area, but buyers stepped in and price is now recovering. This makes 120.88 an important short term support to watch. 📈 Take a look at the upside levels 👀 Price first needs to reclaim 123.81, which is the visible resistance area. A strong move above that could bring 124.95 back into focus, followed by the 125.29 area. The breakout was also accompanied by increased volume, while RSI is around 57.98, showing momentum has recovered without being deeply overbought. On the bearish side, watch how price reacts around 120.88. If this support fails, the next visible area is around 120.07, and a deeper breakdown could bring the recent 118.27 low into focus. For the bullish scenario, holding above 120.88 and breaking 123.81 would keep the recovery structure stronger. ⚡️ For now, keep an eye on 123.81 and 120.88. A clean break and hold above 123.81 would strengthen the upside case, while losing 120.88 would invalidate the current recovery idea and shift attention toward the lower supports. 🎯 Guys follow for more chart analysis 😎 I’ll keep showing you exactly what the chart is telling us. 👀🔥 #ByXIMPACT
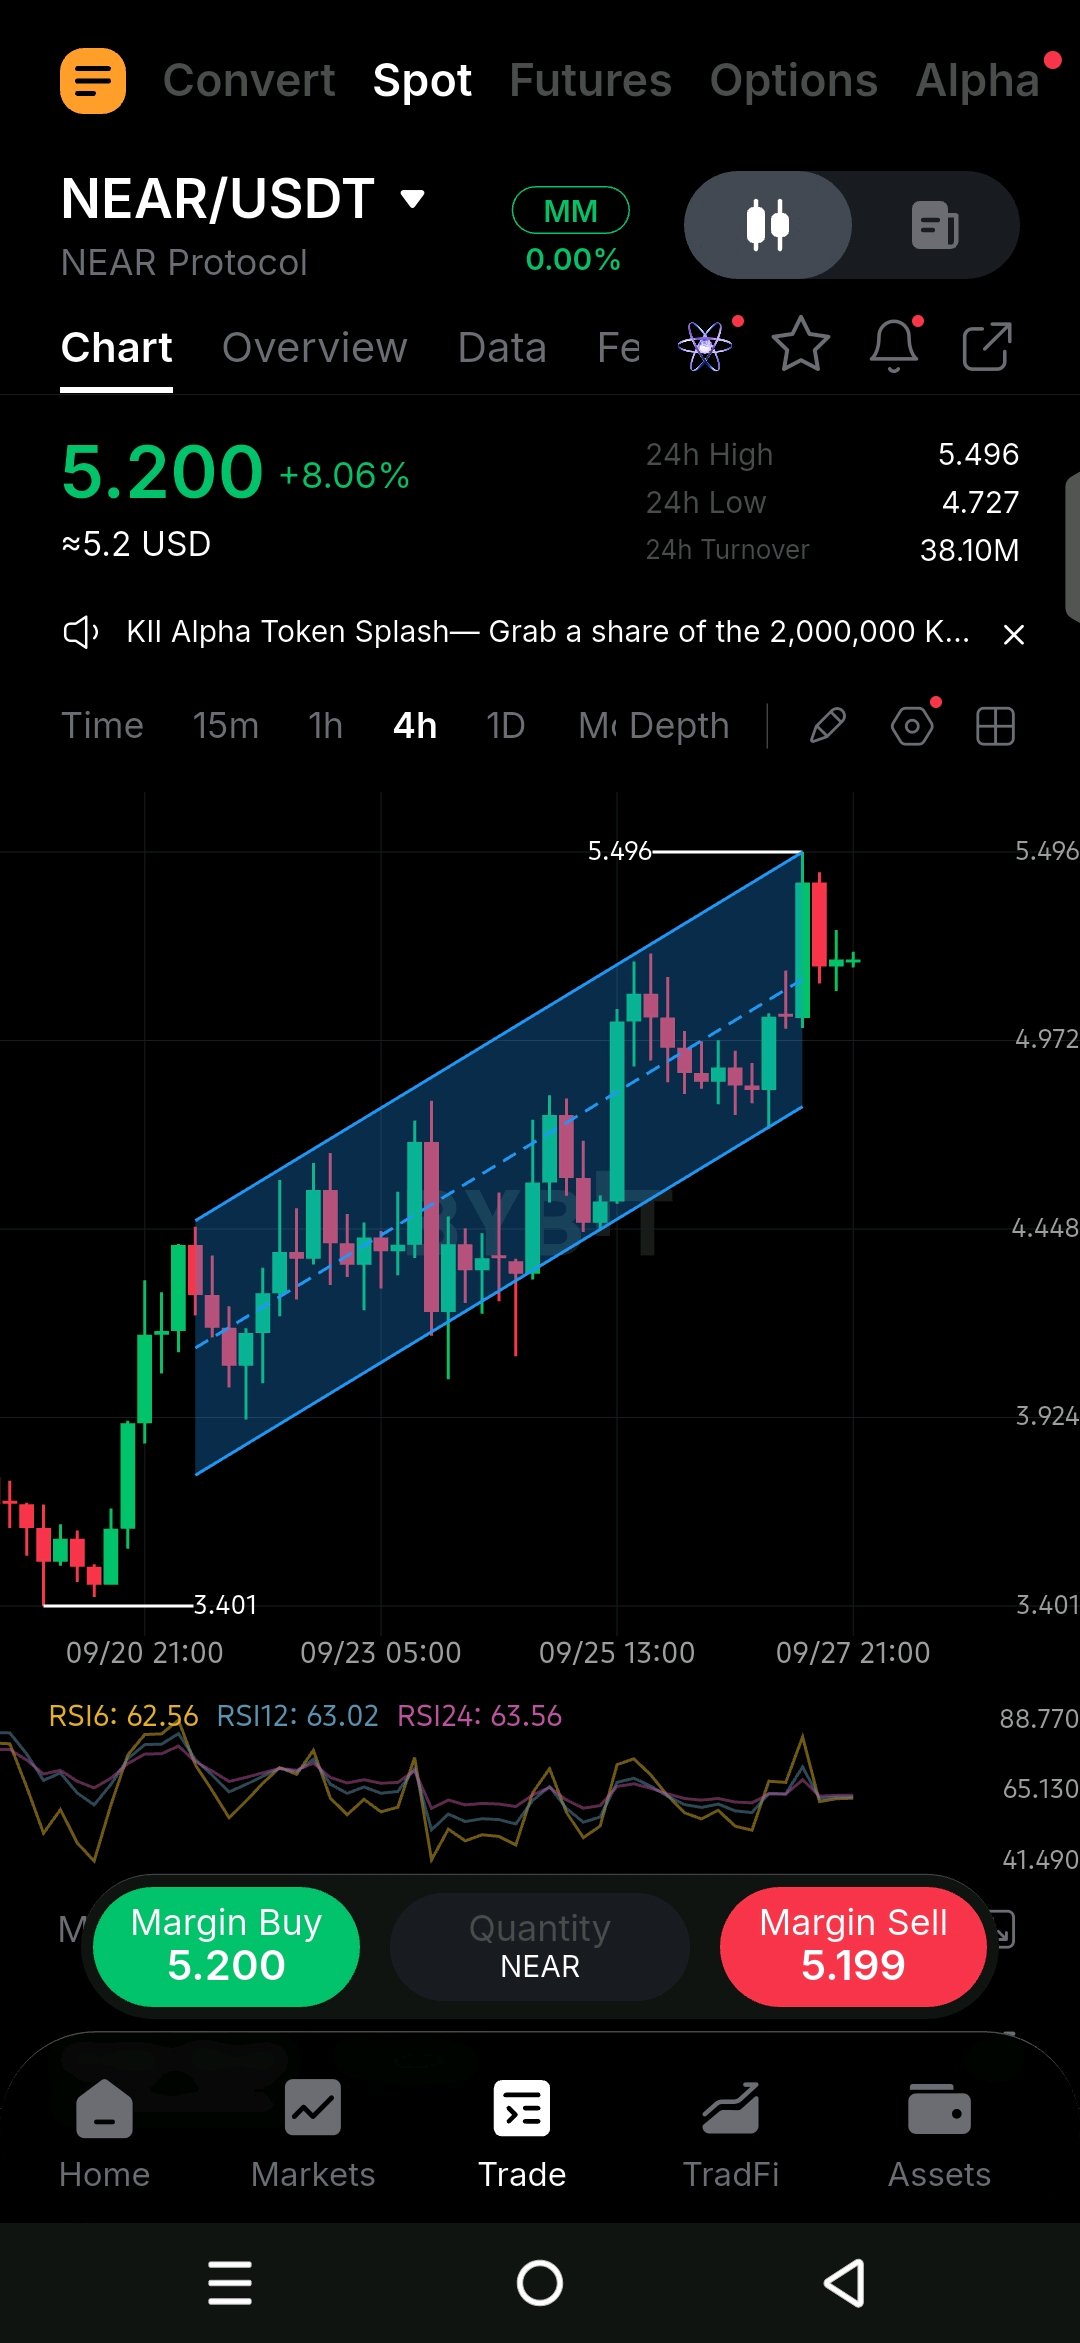
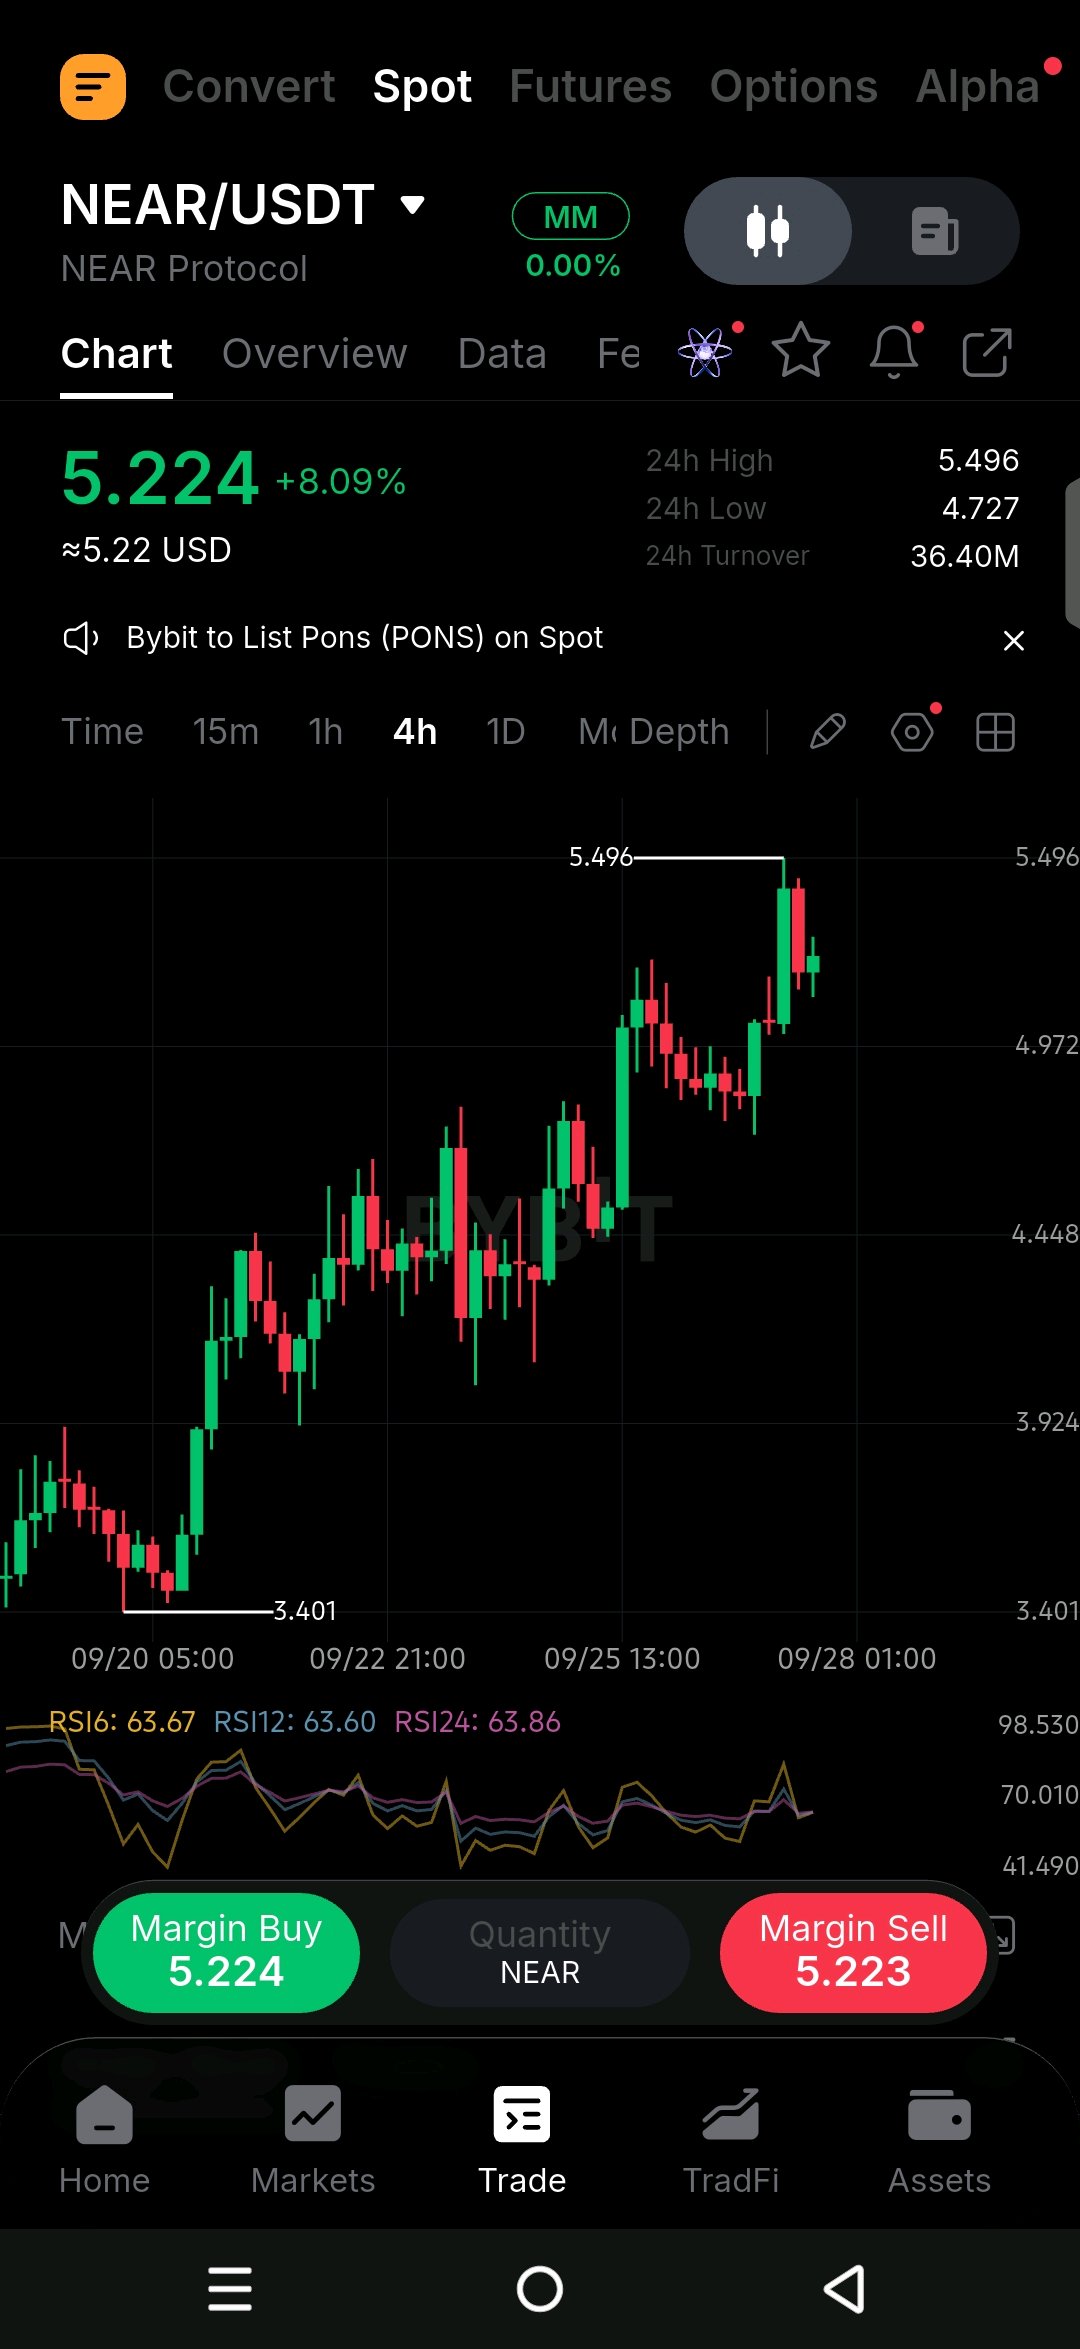
$NEARUSDT On the 4H chart, NEAR is clearly moving inside an ascending channel, with price continuing to form higher highs and higher lows. Right now price is around 5.200 after reaching the visible 5.496 high. Notice how price is still holding above the middle area of the channel, keeping the short term structure constructive. 📈 Take a look at 5.496 👀 This is the main resistance visible on the chart, and price has already reacted around this area. A clean break and hold above 5.496 would show stronger continuation, while rejection here could bring price back toward the 4.97 area and potentially the lower part of the channel. Keep an eye on how the next candles react around these levels. The RSI readings are around 62 to 64, which shows positive momentum without being extremely overbought on the visible chart. If NEAR holds the channel and takes out 5.496, the next move could continue higher, but a breakdown below the channel structure would weaken the current setup. Watch 5.496 on the upside and the 4.97 area below. A clear loss of the channel support would invalidate the current bullish structure. ⚡️ Guys follow for more chart analysis 😎 I’ll keep showing you exactly what the chart is telling us. 👀🔥 #ByXIMPACT
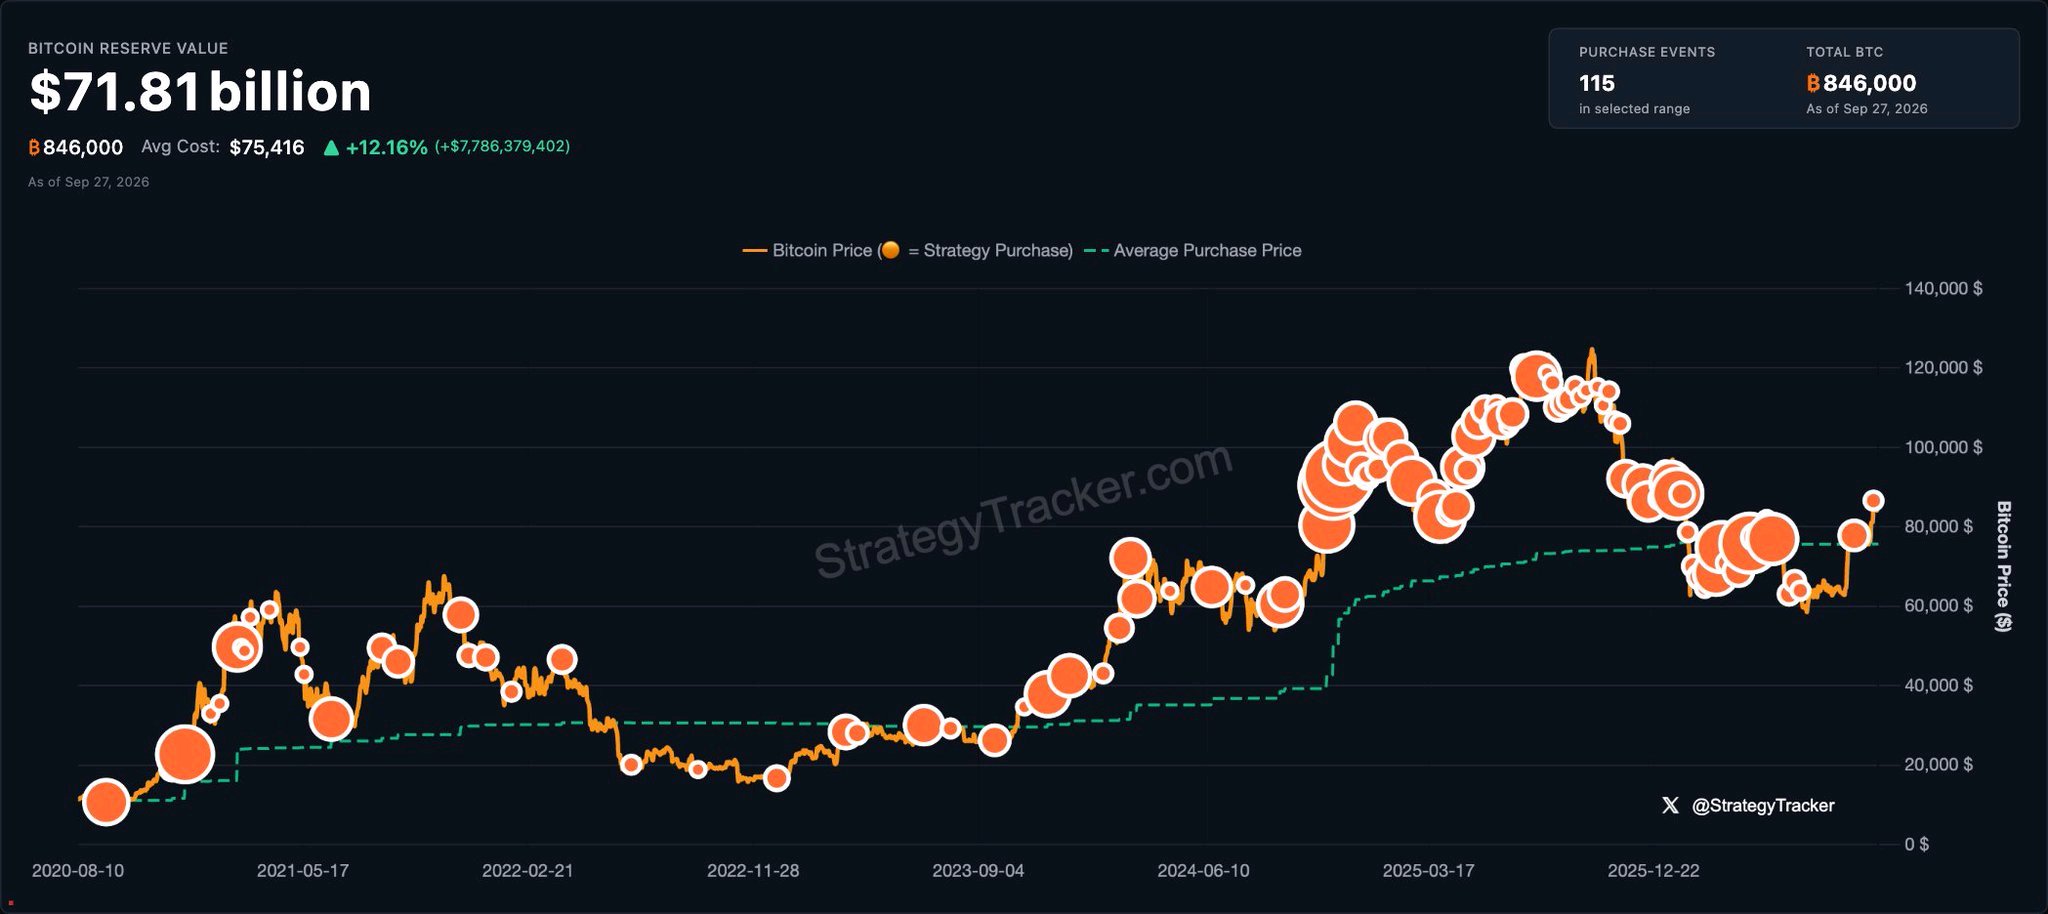
Strategy Just Hit $71.81 Billion in Bitcoin 🔥
Michael Saylor dropped a simple post saying “Even more orange” and the chart behind it is wild. Strategy now holds 846,000 BTC worth $71.81 billion. Their average buy price sits at $75,416 and they’re already up over $7.7 billion or 12 percent. They’ve made 115 purchases and the orange dots on the chart keep getting thicker. This isn’t slowing down. $BTCUSDT $ETHUSDT what you think about this? don't forget to comment 💭 Follow for more content 🙂
$NEARUSDT Guys, I’ll analyze and break down what the chart is showing us right now. 👀 Take a look at this 4h chart. Price has been climbing steadily since that low near 3.401, printing clear higher highs and higher lows all the way up. The recent push tagged the 5.496 high before pulling back a bit, and we’re sitting around 5.224 right now after an 8% move on the day. Notice how price is holding above the recent swing lows while the overall structure stays bullish. The 24h high at 5.496 is the clear resistance overhead, and the area around 4.727 acts as the nearest visible support from the last dip. RSI is sitting near 63 across the different periods, which shows the move still has room without being stretched. If buyers continue defending the higher lows and push through 5.496 cleanly, we could see another leg higher. On the flip side, a break back under the recent pullback lows would open the door for a deeper retest of the 4.7 zone. Watch how price reacts around that 5.496 level next, because a strong close above or a sharp rejection there will set the tone for the next move. Guys follow for more chart analysis 😎 I’ll keep showing you exactly what the chart is telling us. 👀🔥 #ByXIMPACT
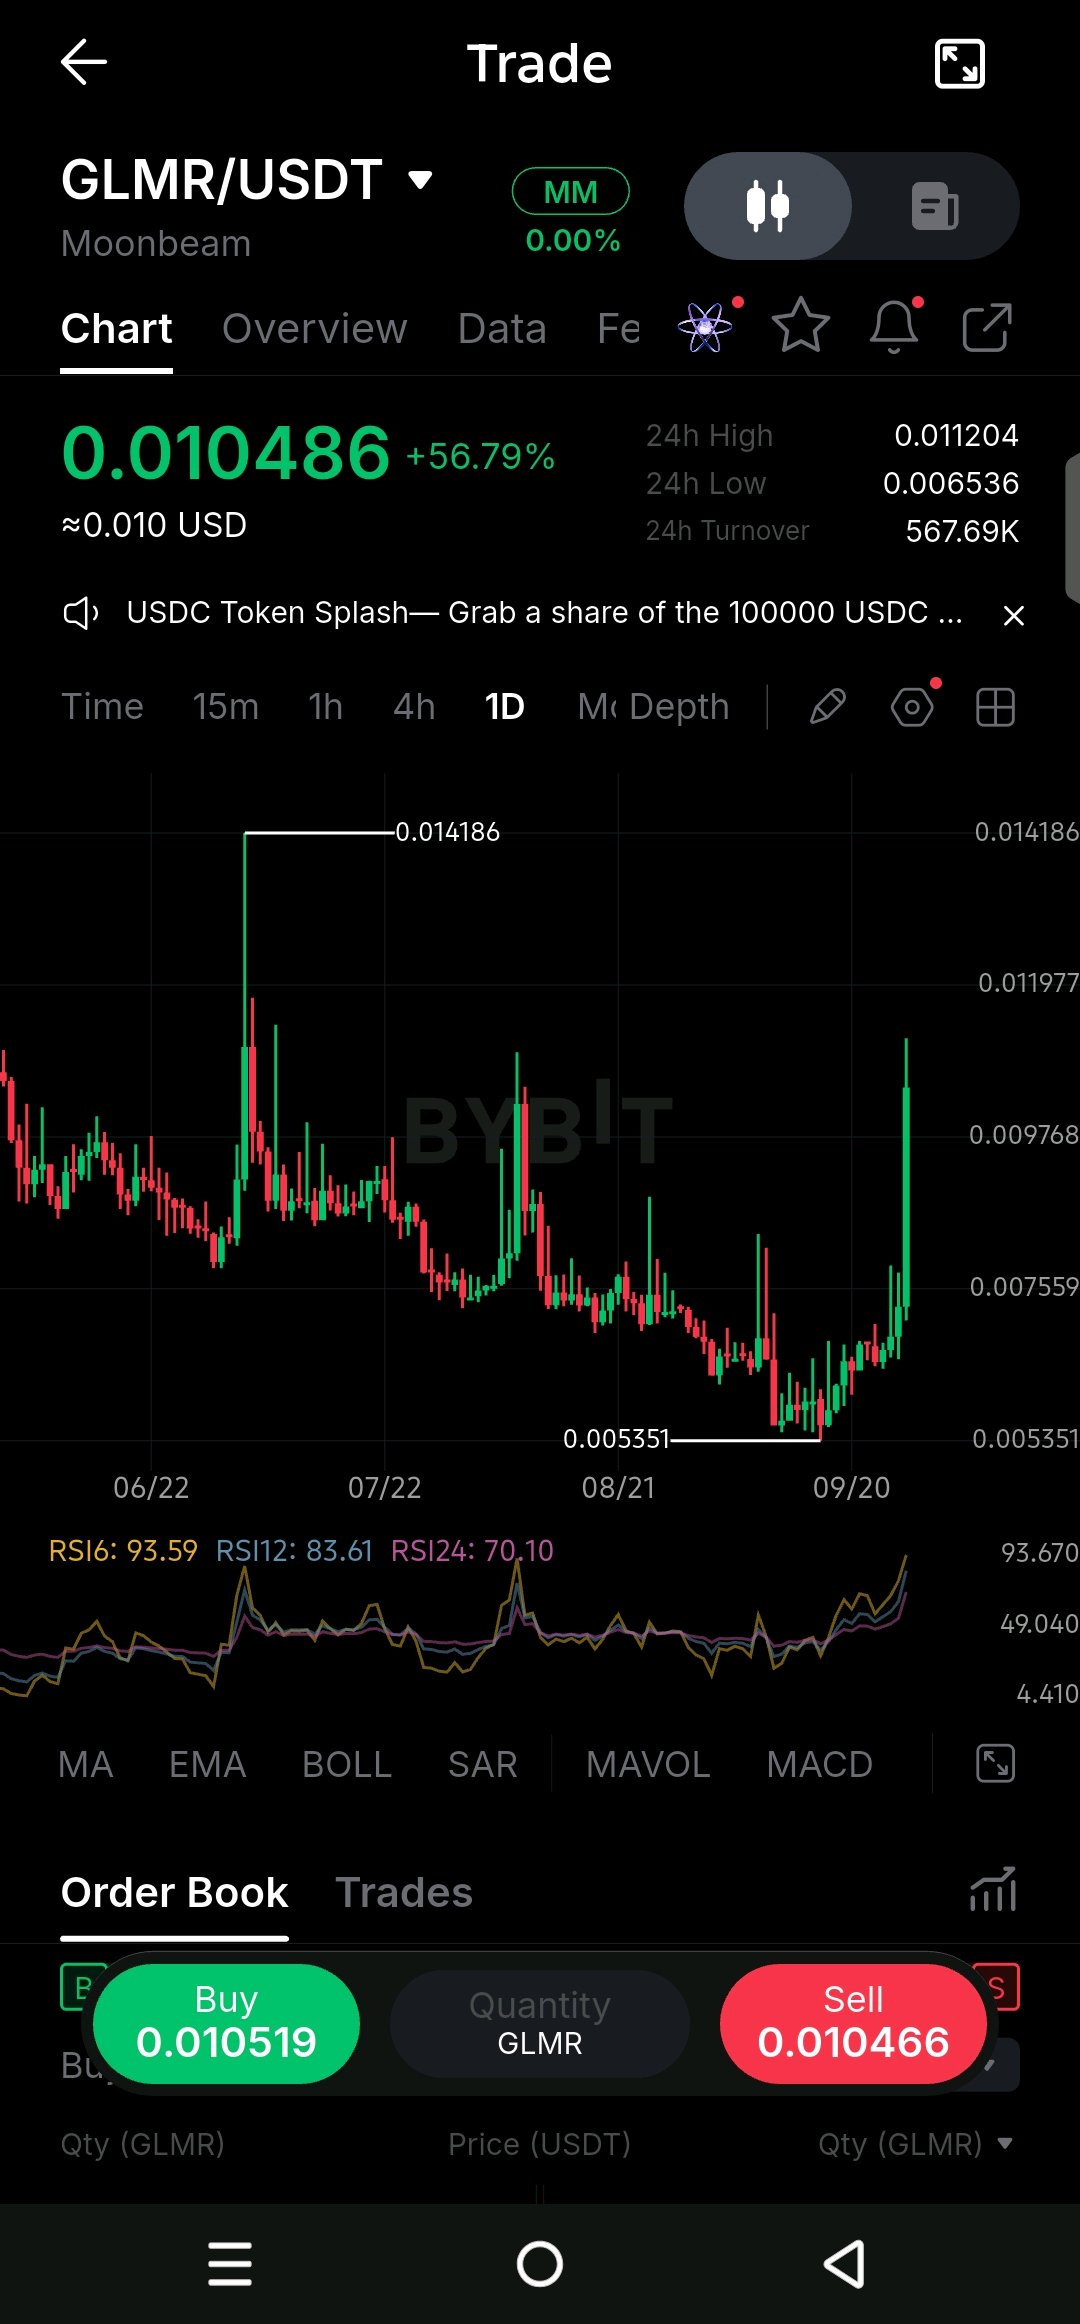
$GLMRUSDT is making a sharp daily move higher and is currently trading around $0.01049 after reaching $0.01120. You can see the change in structure clearly here 👀 After spending a long period moving lower and forming a low around $0.005351, price has now pushed strongly upward. The latest daily candle is much larger than the recent candles, showing strong buying activity. Take a look at the $0.009768 area as well, because price has moved clearly above that previous trading zone. Now notice the reaction around $0.01120. This is the current visible 24h high and price is pulling back slightly from that area. Above it, the next major visible resistance is around $0.011977, followed by the previous high near $0.014186. If price breaks and holds above $0.01120, those levels become important areas to watch 📈 On the other side, $0.009768 is the first important support visible on the chart. A hold above this area would keep the recent upward move intact, while a breakdown back below it would weaken the current structure and bring the lower price zones back into focus. Also notice RSI is around 93.6, which shows very strong momentum but also an extremely stretched reading, so the reaction after this large move is important. Keep an eye on $0.01120 next, with a move back below $0.009768 invalidating the current bullish structure. 👀 Guys follow for more chart analysis 😎 I’ll keep showing you exactly what the chart is telling us. 👀🔥 #ByXIMPACT
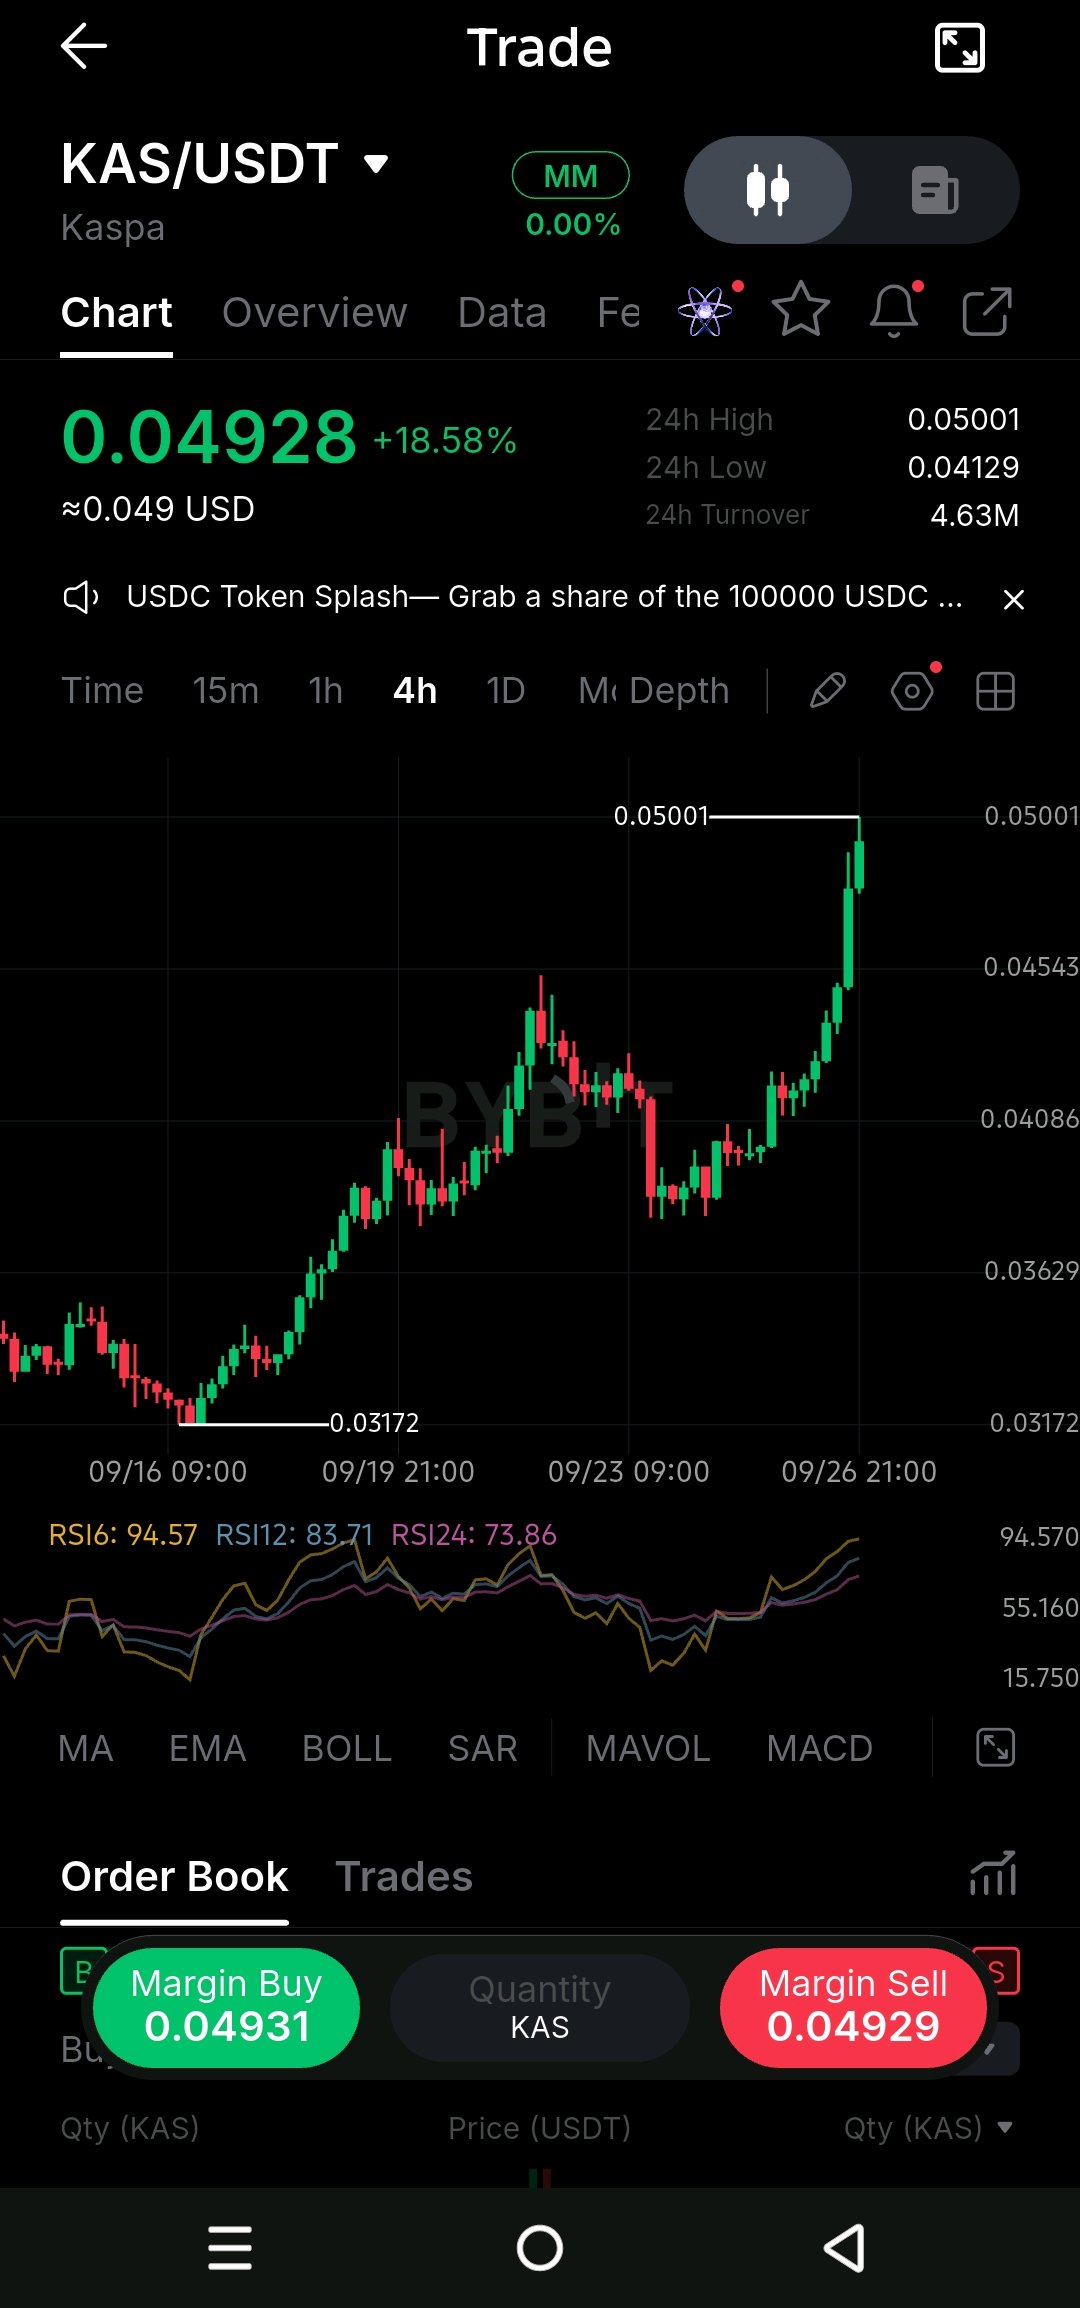
KAS slamming into 0.05 after this vertical run
Look at $KASUSDT right now… we’ve just ripped from that 0.03172 low all the way up to 0.05001 on the 4h. Clean higher highs and higher lows the whole way, and the last few candles just went parabolic. Price is sitting right under that fresh high at 0.05001. That’s the level everyone’s watching. A clean break and hold above it opens the door for continuation. Fail here and we could see a healthy pullback into the 0.045–0.046 zone where previous structure sits. RSI is the loudest signal on the chart right now. RSI6 is at 94.57, RSI12 at 83.71 — that’s stretched. Short-term momentum is overheated, so even if the trend stays up, some cooling off wouldn’t surprise me. Bullish case: we hold above 0.048–0.049 and push through 0.05001 with volume. That keeps the higher-high structure intact. Bearish case: rejection at this high and a drop back under 0.047 would open the path toward the 0.045 area and possibly lower. This is the part I’m watching closely, how price reacts right here at 0.05. A strong close above keeps the momentum alive. A sharp rejection tells us the move needs a breather. Guys follow for more chart analysis 😎 I’ll keep showing you exactly what the chart is telling us. 👀🔥 #ByXIMPACT
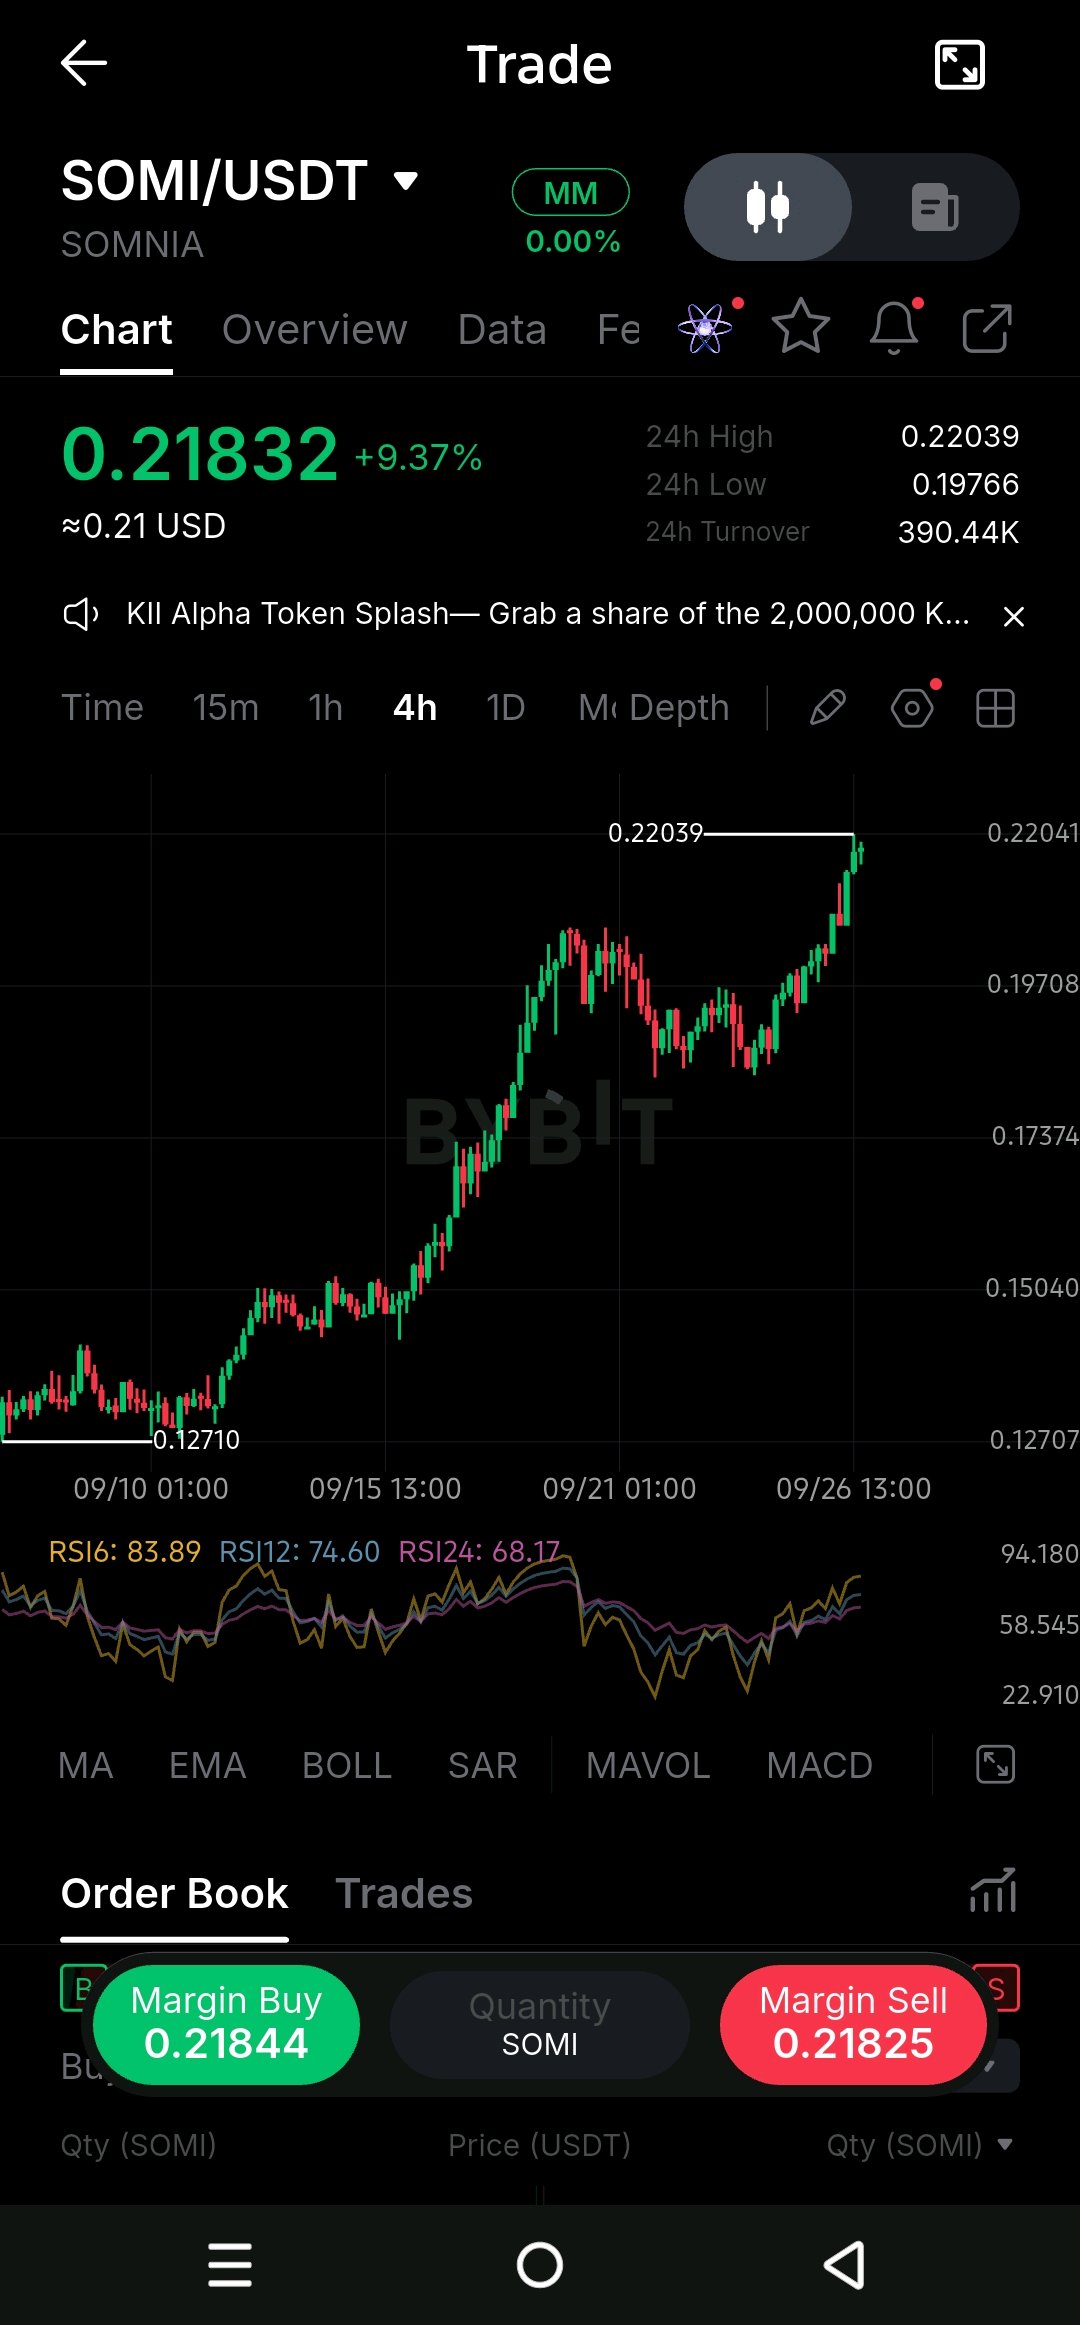
SOMI Is Testing the High Again 👀
$SOMIUSDT is right at the important 0.22039 resistance, and this is the part I’m watching closely. Price has been making a strong series of higher highs and higher lows on the 4H chart, with buyers pushing it from around 0.12710 all the way toward the current high. 📈 Now price is testing 0.22039 again. A clean break and hold above this level would show that buyers are still in control and could signal further continuation. But if price gets rejected here, the first area I’m watching is around 0.19708, where price has reacted several times recently. There’s also a clear short-term cooling risk. RSI6 is around 83.89 and RSI12 is around 74.60, showing that the recent move has become quite stretched. That does not confirm a reversal, but it means the reaction around 0.22039 becomes even more important. 👀 If 0.19708 holds during a pullback, the higher-high and higher-low structure remains visible. A deeper move below 0.17374 would weaken that structure and change the current picture. So for me, 0.22039 is the key level now. Break and hold above it would strengthen the bullish continuation scenario, while rejection followed by a loss of 0.19708 would put more pressure on the structure. Watch how price reacts here because that reaction could tell us the next direction. 🔥 Guys, follow for more chart analysis 😎 I’ll keep showing you exactly what the chart is telling us. 👀🔥 #ByXIMPACT
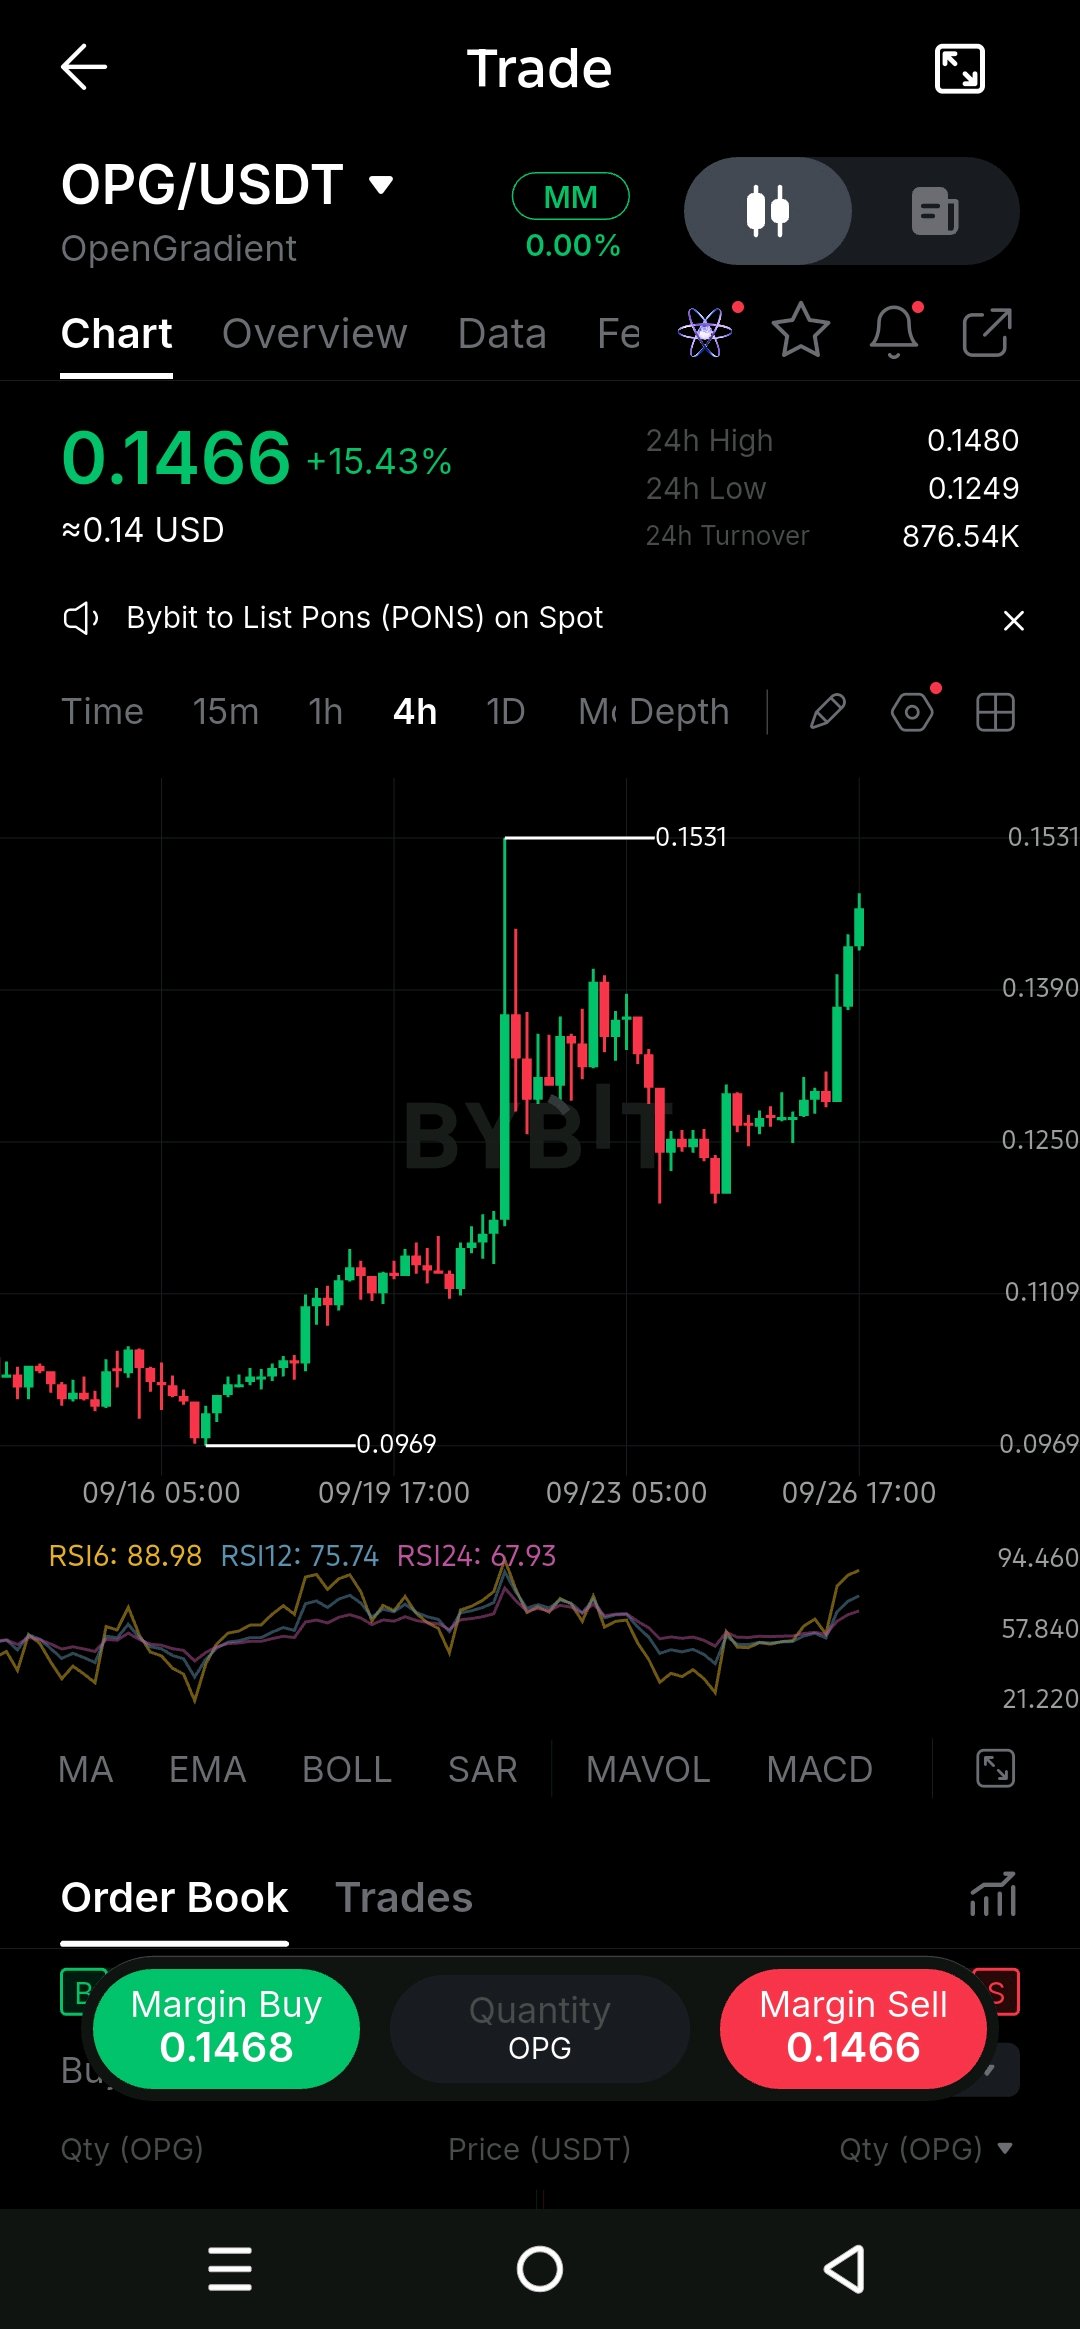
OPG Is Pushing Back Toward 0.1531 👀
$OPGUSDT has made a strong move on the 4H chart and is now trading around 0.1466, getting closer to the major 0.1531 resistance. This is the level I’m watching closely because price previously reacted sharply from there. 👀 The structure is still clearly moving upward, with higher highs and higher lows visible across the chart. After holding around 0.1250, buyers stepped back in and pushed price strongly toward the current area. Now 0.1531 is the main test. A clean break and hold above this level could show that buyers are continuing the move. If price gets rejected again, 0.1390 becomes the first important support to watch, followed by the 0.1250 area. One thing that stands out is RSI6 around 89, while RSI12 is around 76 and RSI24 around 68. Short term momentum is therefore quite strong, but the very high RSI6 also shows that the recent move has been aggressive. 📈 So here’s what I’m watching: holding above 0.1390 keeps the recent bullish structure intact, while a move through 0.1531 would be the key breakout area. A loss of 0.1250 would significantly weaken the structure visible on this chart. For now, the reaction around 0.1531 is the main thing to watch. A clear rejection there could bring the lower supports back into focus, while a confirmed break above it would change the structure at that level. 🎯 Guys, follow for more chart analysis 😎 I’ll keep showing you exactly what the chart is telling us. 👀🔥 #ByXIMPACT
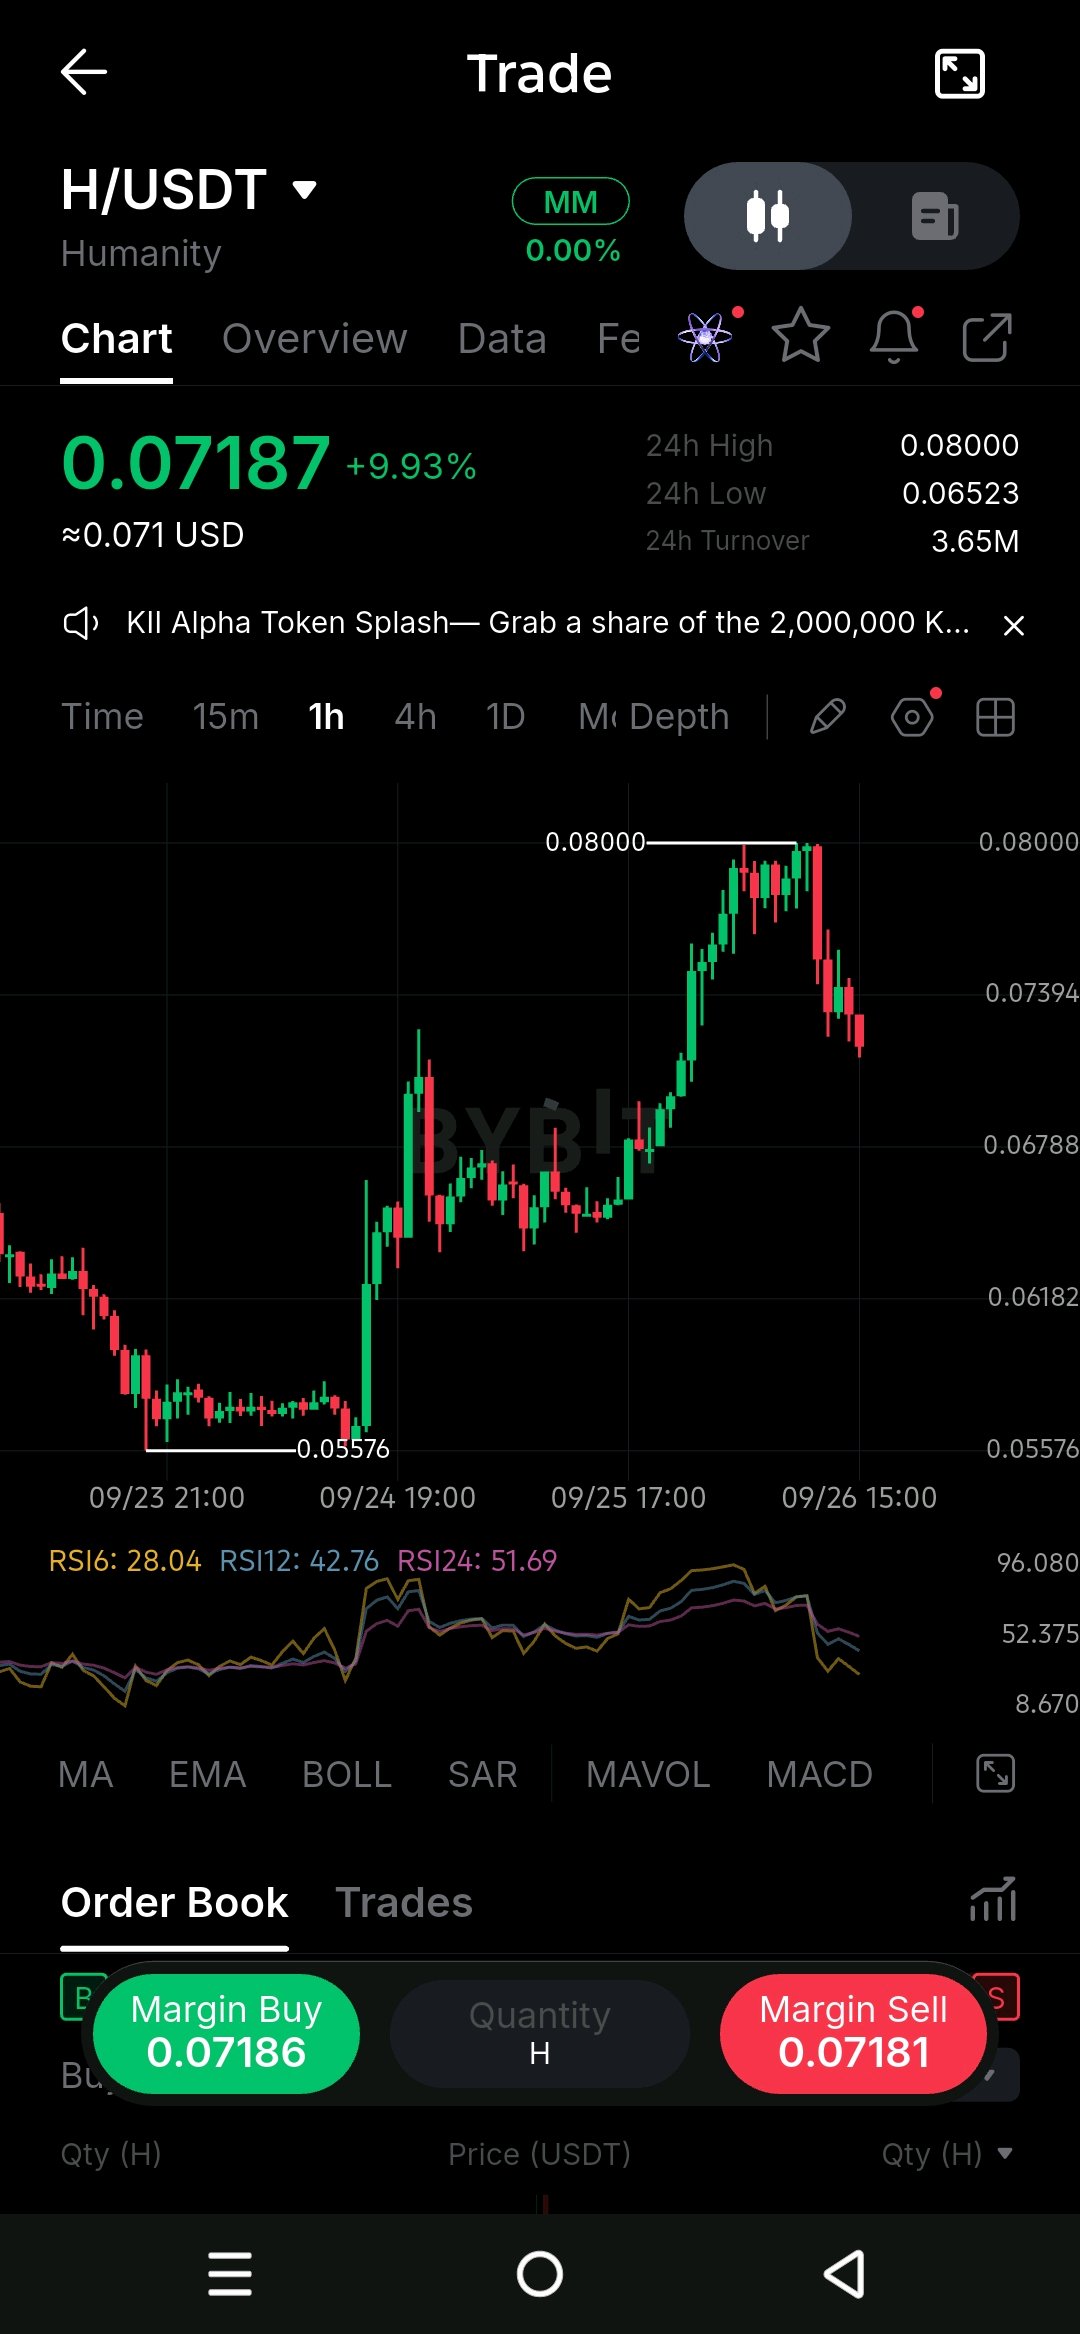
$H/USDT Just Got Rejected From 0.08000 👀
look at this move on the 1H chart. $HUSDT pushed strongly from the 0.06788 area and climbed all the way toward 0.08000, but sellers stepped in hard around that level and price is now pulling back 📉 The important thing here is that 0.08000 has already produced a clear rejection. If buyers can reclaim 0.07394 and hold above it, the next major area to watch is 0.08000 again. A clean break and hold above 0.08000 could open the door for another continuation higher, but that needs to be confirmed by price action. On the bearish side, 0.06788 is the key level I’m watching. Price previously reacted around this area, so losing it could weaken the current structure and bring 0.06182 into focus. RSI6 is around 28, showing short-term selling pressure has become quite strong after the rejection. That can support a bounce, but RSI alone does not confirm a reversal. For me, the main levels are simple: 0.07394 for the immediate reaction, 0.08000 as the major resistance, and 0.06788 as the important support. 👀 Now I’m watching how $H reacts around 0.07394. Reclaiming it would strengthen the bullish scenario, while losing 0.06788 would invalidate that short-term bullish structure and shift attention toward 0.06182. 🔥 Guys, follow for more chart analysis 😎 I’ll keep showing you exactly what the chart is telling us. 👀🔥 #ByXIMPACT
WLD/USDT: The $0.5127 Rejection Is the Key 👀
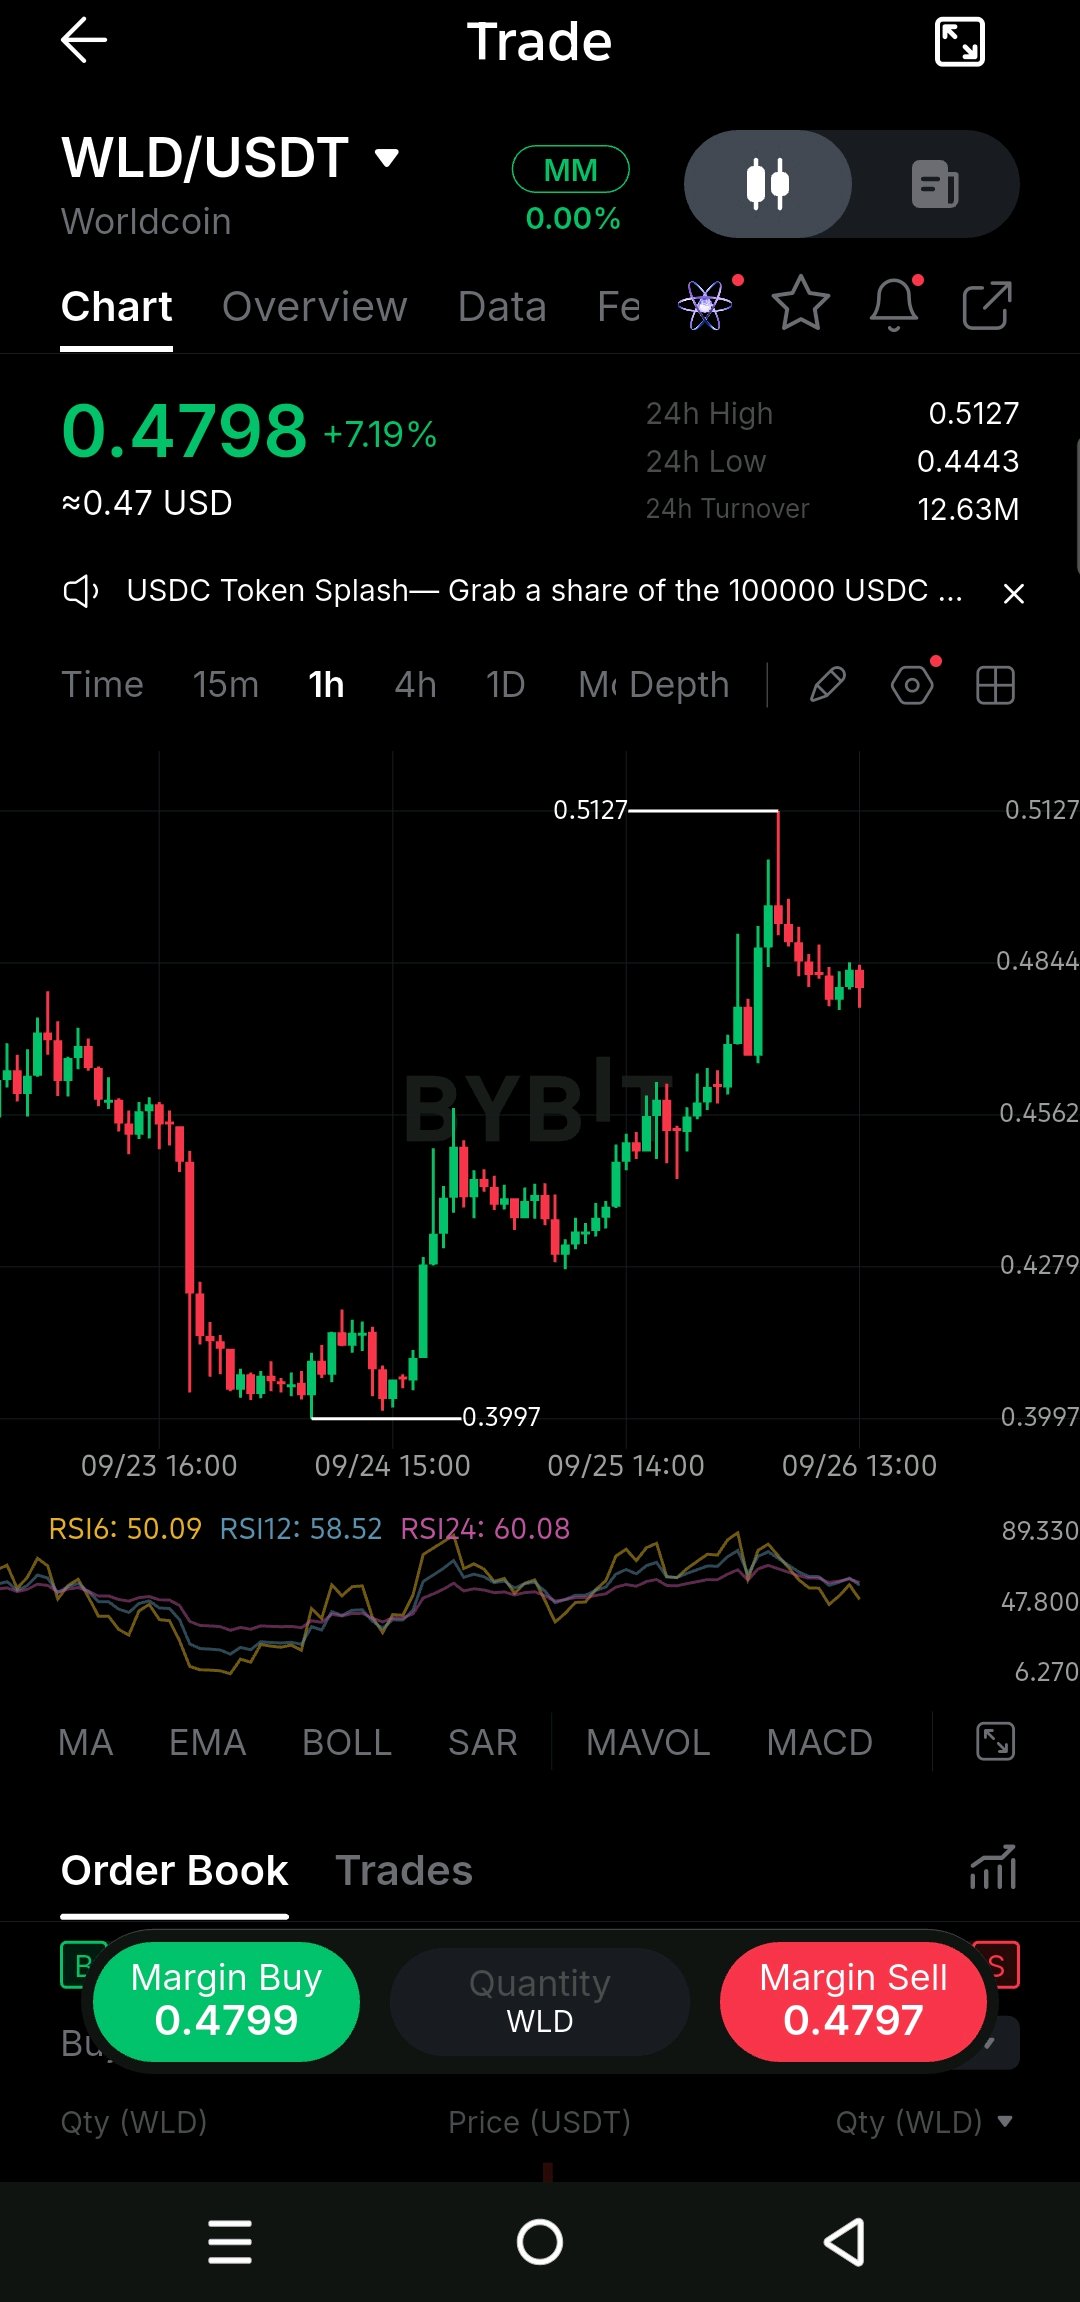
$WLDUSDT is showing a strong recovery on the 1H chart, but now price is sitting right below the area where the last major rejection happened. Guys, look at that $0.5127 level 👀 From the $0.3997 low, price has built a clear sequence of higher highs and higher lows. The move above $0.4562 pushed momentum higher and eventually took price up to $0.5127, where sellers stepped in strongly. Right now, price is consolidating around $0.48 after that rejection. The important support below is around $0.4562. Holding this area would keep the recent bullish structure intact, while a move below it could open the way toward the $0.4279 area. On the upside, $0.5127 is the major resistance visible on the chart. A clean break and hold above that level would show that buyers are regaining control after the rejection. ⚡️ The RSI readings are around 50 to 60, so momentum is still relatively positive, but it is not showing an extreme condition right now. That matches the current consolidation rather than a strong momentum expansion. For the bullish scenario, I’m watching how price reacts around $0.4562 and whether it can eventually challenge $0.5127 again. For the bearish scenario, a clear breakdown below $0.4562 would weaken the current structure and bring $0.4279 into focus. If trading this visible structure, the chart gives these key levels to watch: Entry: Around $0.4562 after a confirmed reaction SL: Below the recent reaction area around $0.4279 TP1: $0.4844 TP2: $0.5127 The next thing I’m watching is whether can build strength above the current consolidation and retest $0.5127. A sustained move below $0.4562 would invalidate this bullish structure and change the setup. Guys, follow for more chart analysis 😎 I’ll keep showing you exactly what the chart is telling us. 👀🔥 #ByXIMPACT