
wildcryptox
Bullish
MANTRA
we ride desert dragons 🐉 🌴 🏝️ $mantraUSD $MANTRAUSDT



WeseR009
Bullish
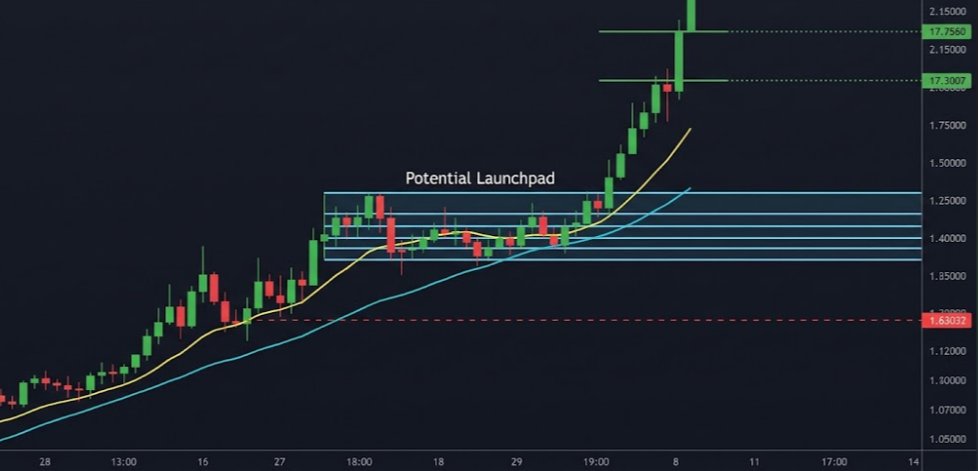
$ERAUSDT у границы важной зоны: цена держится на потенциальной стартовой площадке, но быкам нужно закрепить свои намерения действиями. 🟢 ЛОНГ по $ERA Торговый сетап: * Точка входа: 0.08281 – 0.0845 * Стоп-лосс: 0.0820 * Цели (Тейк-профиты): * TP1: 0.08788 * TP2: 0.09126 * TP3: 0.09464 Потенциал подъем хороший, если покупатели отстоят текущую область и продавят локальное сопротивление. Сам предпочитаю дождаться спокойного ретеста и подтверждения на откате, а не залетать на эмоциях в зеленую свечу. Если давление сохранится — плавно потянем к верхним целям. Уход ниже 0.0820 ломает структуру и полностью отменяет сценарий. #WSOT2026 #IMPACTbyTrade #MyByXTake #ByXIMPACT

#WSOT2026#IMPACTbyTrade#MyByXTake#ByXIMPACT

Adityaa56
Bearish
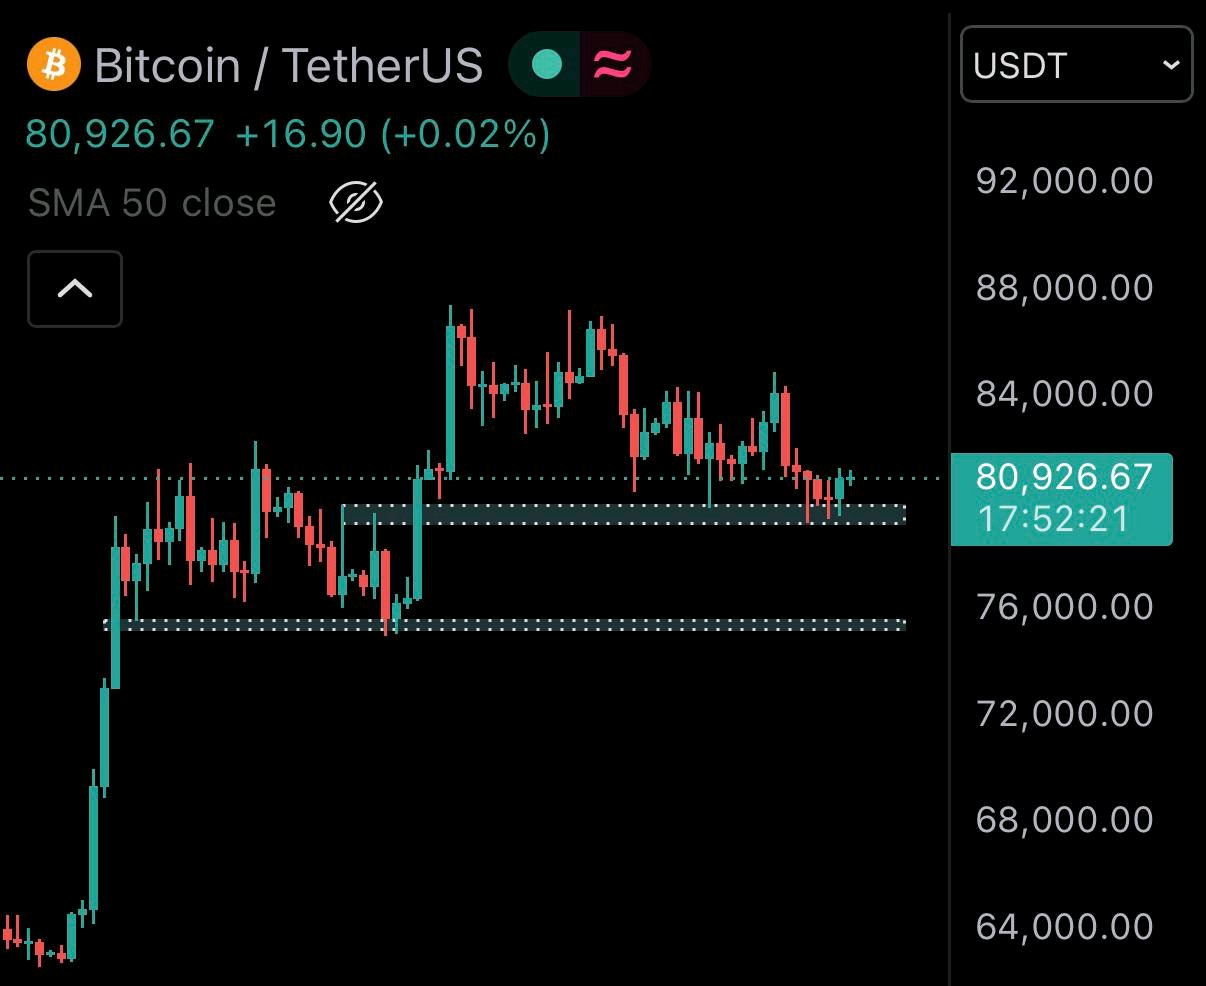
$BTC is holding around $80K after a recent drop. Price is trying to stay above this support, but the market still looks weak. A break below $80K could send BTC towards $76K next. $BTCUSDT #WSOT2026 #AnthropicS1Filing #IMPACTbyTrade #MyByXTake #MidtermsMarketWatch $SOLUSDT
#WSOT2026#AnthropicS1Filing#IMPACTbyTrade#MyByXTake#MidtermsMarketWatch

Nizzan GTR
Bullish
OUTLOOK ON BTCUSDT
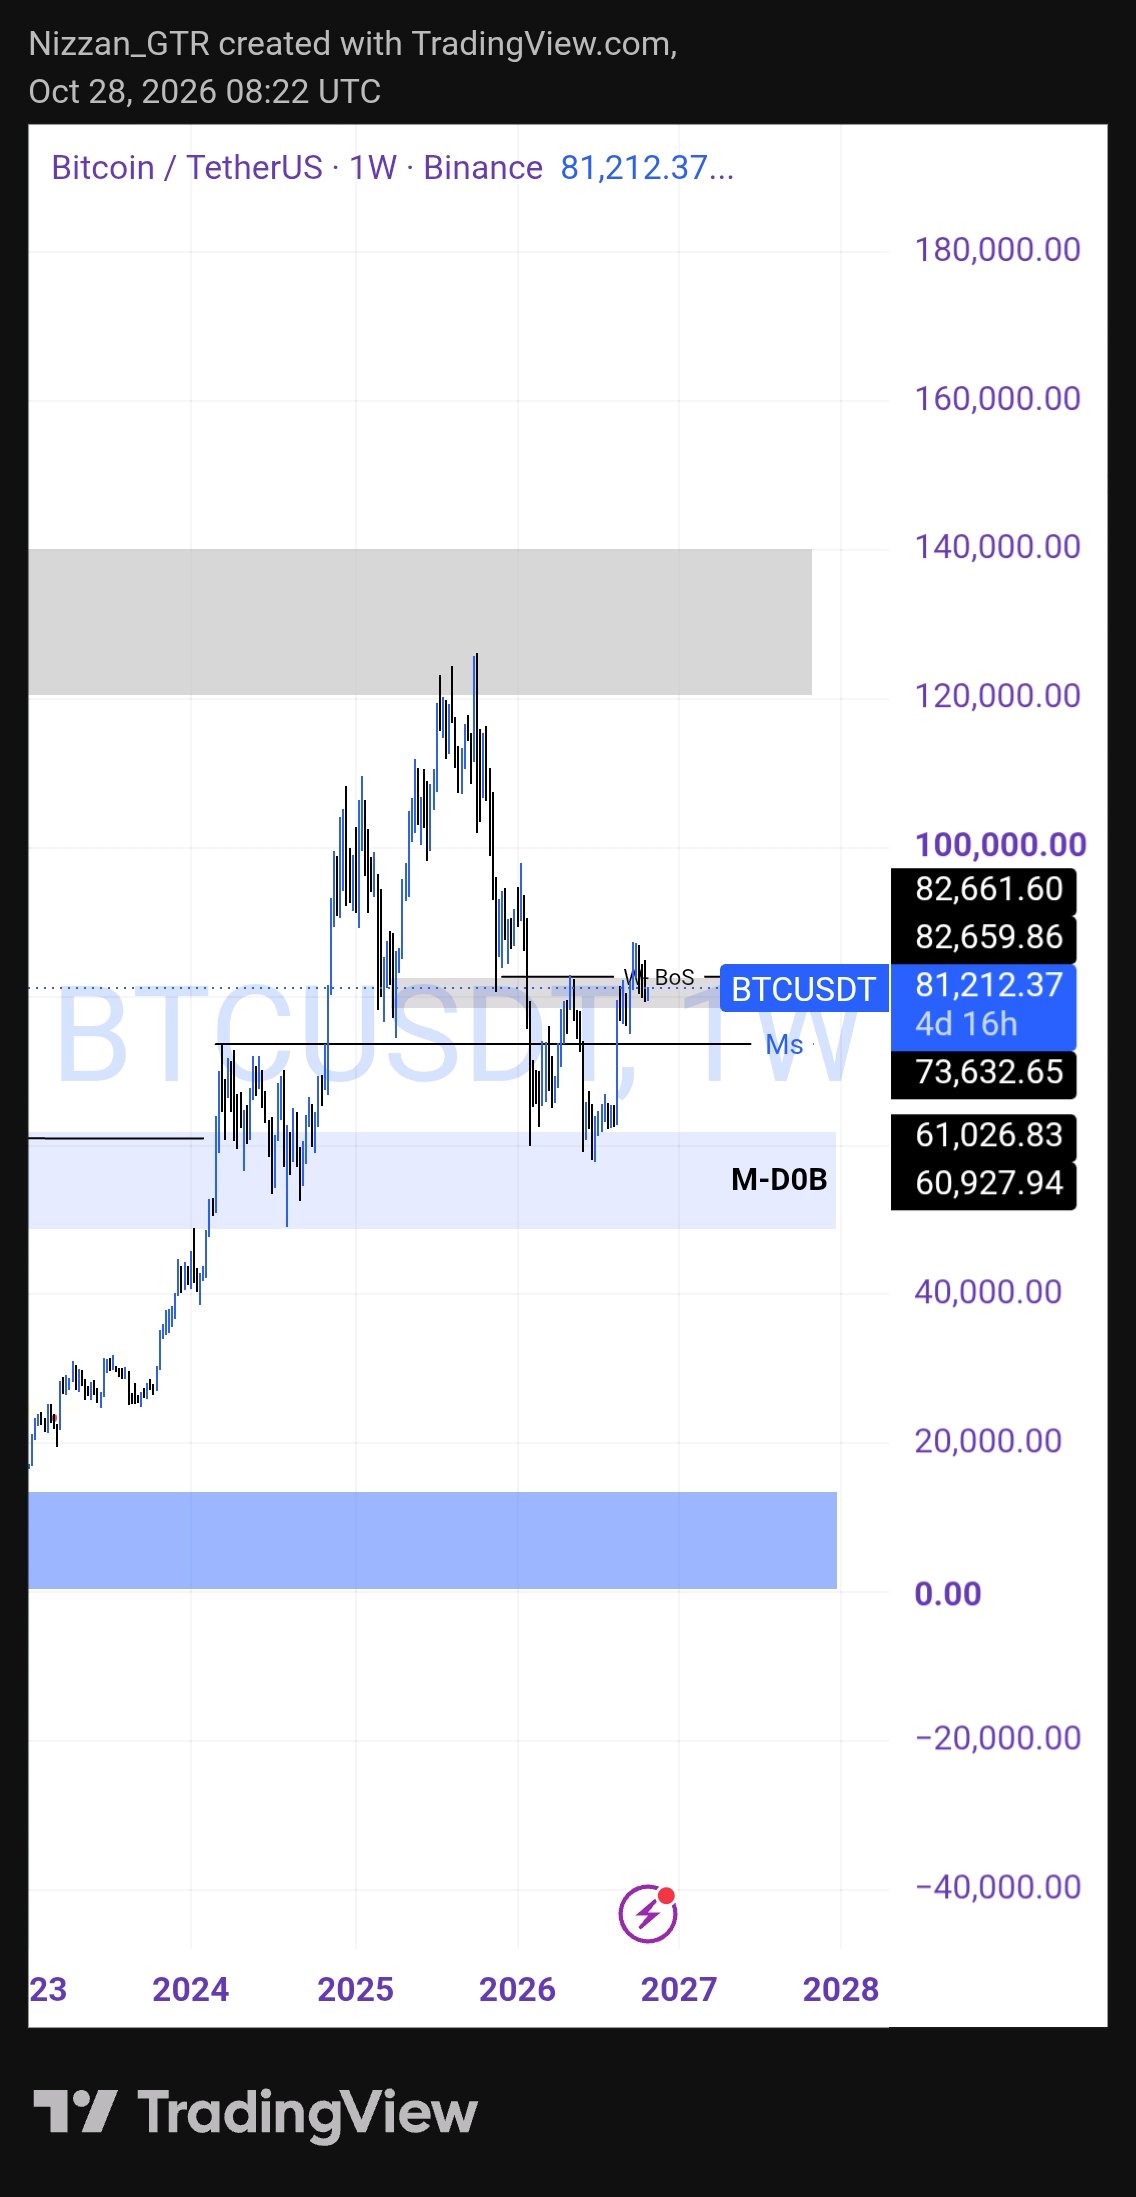
Today, I wasn’t planning to dig into the weekly $BTCUSDT chart this morning, but the structure jumped out once I zoomed out. Price is sitting at $81,164 after the big run into the 120k+ area. We’ve got a clear Weekly Break of Structure (W-BoS) marked right around current levels, and the big Monthly Demand Order Block (M-DOB) is still sitting lower between roughly 61k–73k. Right now BTC is in a corrective phase on the weekly. The M-DOB is the key demand zone that held previously and is still the most important area below. As long as price stays above that block, the HTF structure hasn’t fully broken. A clean weekly close back below the M-DOB (especially under 61k) would shift the bias harder to the downside. Trade Plan: Bias: Bullish Thesis: Still waiting for the weekly to show its hand. No need to chase in the middle of this range. #WSOT2026 #AnthropicS1Filing #IMPACTbyTrade #MyByXTake #FOMCRateDecision $BTCUSDT
#WSOT2026#AnthropicS1Filing#IMPACTbyTrade#MyByXTake#FOMCRateDecision

KRYPTONITE
🚨 NEAR BRINGS ANTHROPIC PRE-IPO EXPOSURE ONCHAIN
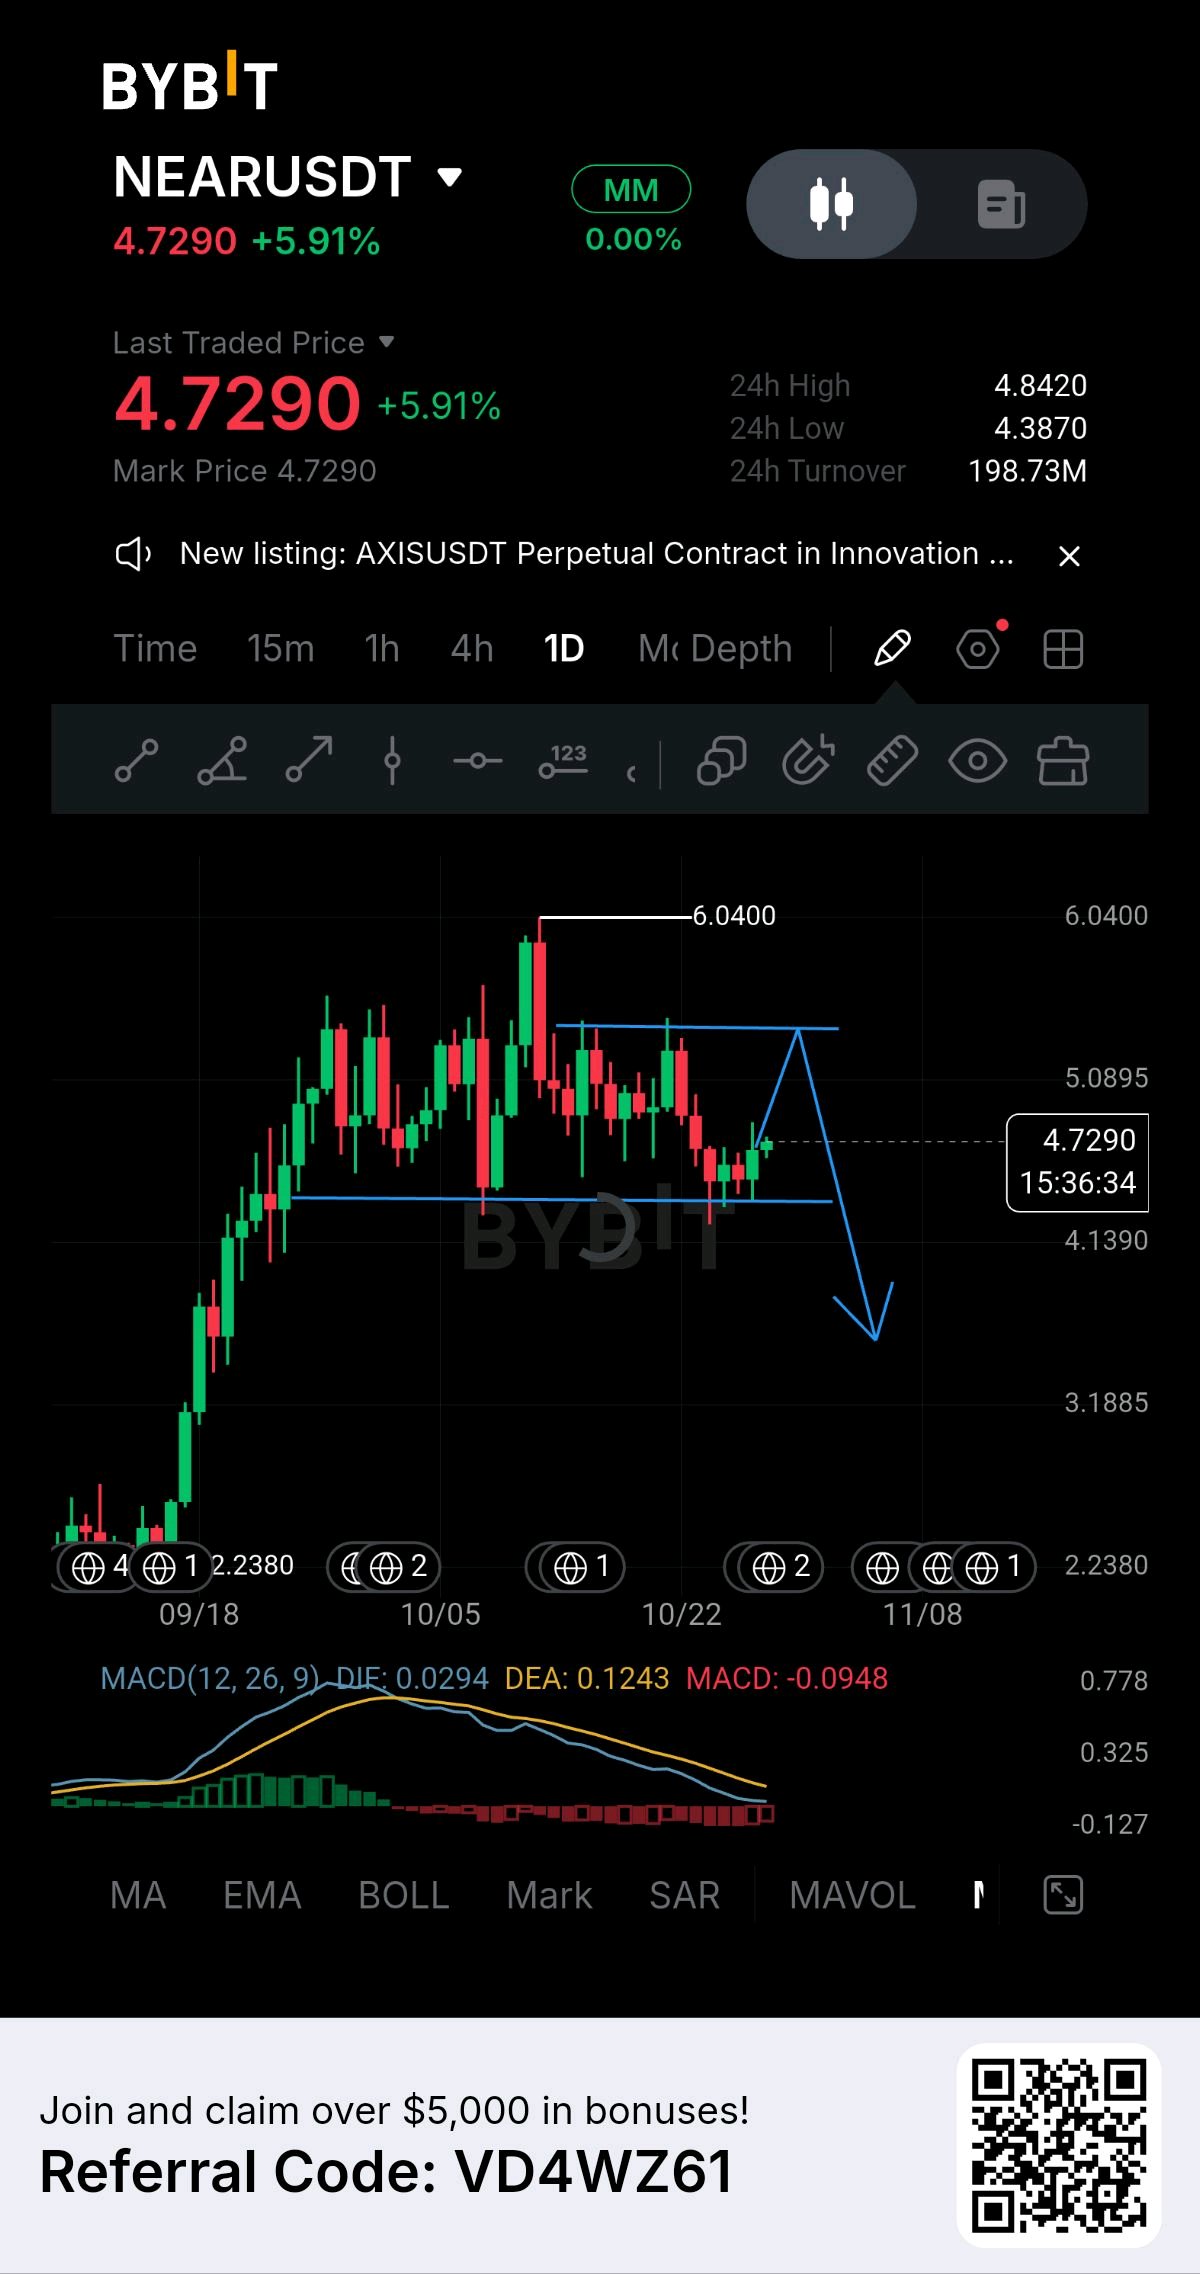
$NEARUSDT is pushing into a new corner of onchain trading. The network has introduced $ANT perpetuals on perps.near.com, powered by Hyperliquid and TradeXYZ, tracking the market’s expectations for Anthropic’s pre-IPO valuation. The contract reportedly offers up to 10x leverage, alongside confidential deposits and withdrawals through NEAR’s trading infrastructure. But there’s one crucial distinction: Trading $ANT does not mean owning Anthropic shares. No shareholder rights. No claim on company assets. No guaranteed IPO allocation. It’s derivative exposure to price movements in a market linked to the company’s expected pre-IPO value. That opens an interesting question about where crypto markets are heading. Onchain derivatives are expanding beyond crypto-native assets toward private-company valuations and traditional financial exposure. The opportunity is broader market access. The risk is that these markets can be volatile, leveraged, and disconnected from the price investors eventually receive in a real IPO. Wall Street exposure is moving onchain. But exposure is not ownership. #ByXIMPACT

#ByXIMPACT

JABALI
Bullish
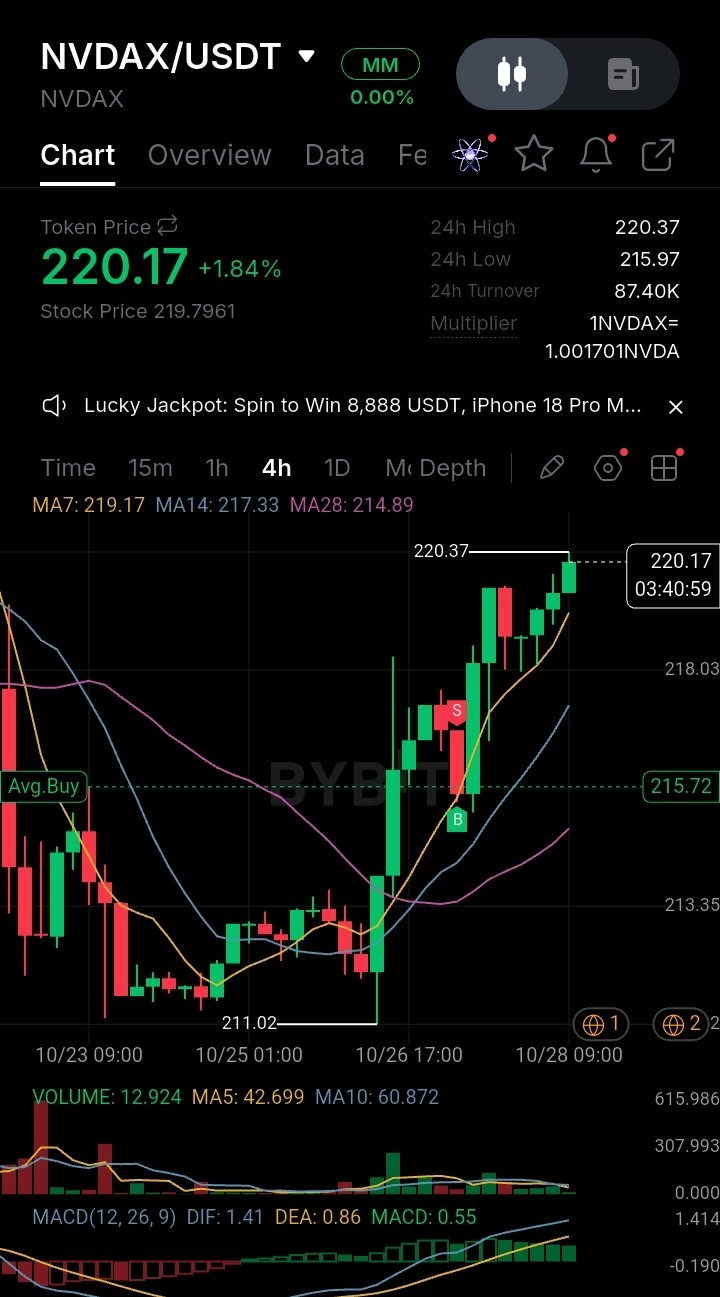
🔍 Market Analysis: $NVDAXUSDT Strong Bullish Reversal & Breakout Acceleration (4h Chart) 📈 NVDAX/USDT has experienced a sharp bullish turnaround on the 4-hour timeframe, surging +1.84% to trade at 220.17[span_0](start_span)[span_0](end_span). Following a multi-day slide that bottomed out at 211.02, buyers stepped in aggressively on October 26 to spark a massive vertical rally, pushing price action to a local peak of 220.37 before consolidating near multi-day highs[span_1](start_span)[span_1](end_span). ▪️ Technical Setup: The price structure has completed a full trend reversal, pushing well above all key moving averages[span_2](start_span)[span_2](end_span). Dynamic support is now anchored by the MA7 (219.17), MA14 (217.33), and MA28 (214.89)[span_3](start_span)[span_3](end_span). The rapid upward fan of the short-term averages over the longer-term baseline reflects strong buyer dominance following the successful defense of the 211.02 floor[span_4](start_span)[span_4](end_span). ▪️ Indicators: The MACD oscillator is firmly in positive territory, printing at 0.55[span_5](start_span)[span_5](end_span). The DIF (1.41) maintains a healthy bullish separation above the DEA (0.86), confirming strong upward momentum[span_6](start_span)[span_6](end_span). While volume on the latest candle is moderate at 12.924 NVDAX, the strong follow-through above prior resistance levels demonstrates sustained buying interest[span_7](start_span)[span_7](end_span). ▪️ Fundamental & News: As a tokenized asset pegged 1:1 to NVIDIA equity, NVDAX’s upside momentum is heavily backed by the broader resurgence in the AI sector[span_8](start_span)[span_8](end_span). Positive sentiment across major tech catalyst announcements and expanded collateral utility for xStocks on centralized platforms like Bybit continue to fuel strong demand for tokenized real-world assets (RWAs). ▪️ Outlook: Sustaining price action above the immediate MA7 support at 219.17 is crucial for maintaining momentum[span_9](start_span)[span_9](end_span). A decisive breakout past the 220.37 local resistance could pave the way for a retest toward the 223.00–225.00 level[span_10](start_span)[span_10](end_span), whereas a loss of the 217.33 (MA14) handle could trigger a temporary pullback toward the 215.00 support zone[span_11](start_span)[span_11](end_span). ⚠️ Risk Disclosure: High-volatility assets can experience rapid price swings. This analysis is for educational purposes only and not financial advice. #ByXIMPACT #IMPACTbyTrade #MyByXTake

#ByXIMPACT#IMPACTbyTrade#MyByXTake

imsencond233
A large EPS number can be the least useful figure in an earnings report. Alphabet's Q2 2026 diluted EPS reached $9.11, but other income included roughly $98 billion in net gains, primarily unrealized gains on equity securities. That's not the same as profit generated by Search or Cloud operations. For Q3, I'm putting operating income, segment results and cash spending ahead of any eye-catching bottom-line number. I am not dismissing Alphabet's earnings. I'm saying investors should know which dollars came from customers and which came from investment revaluations. The distinction changes the story completely. #EarningsWatch

Motivated
🌊 XRPUSDT | Market Structure Update Price structure provides clues, but confirmation remains essential before making a trading decision. • Market: XRPUSDT • Direction: Long Watch • Timeframe: 15M • Strategy: Higher lows, resistance & retests • Focus: Structure confirmation and risk control If price forms higher lows and breaks resistance, the bullish scenario may strengthen. A breakdown below support could invalidate that view. Always prepare for both bullish and bearish outcomes. • No emotional entries. • No unnecessary leverage. Protecting capital is the priority. 📈⚡ $ZEREBROUSDT $SUIUSDT #IMPACTbyTrade #MyByXTake #BybitStocks #ByXIMPACT #MidtermsMarketWatch

#IMPACTbyTrade#MyByXTake#BybitStocks#ByXIMPACT#MidtermsMarketWatch

Diamond
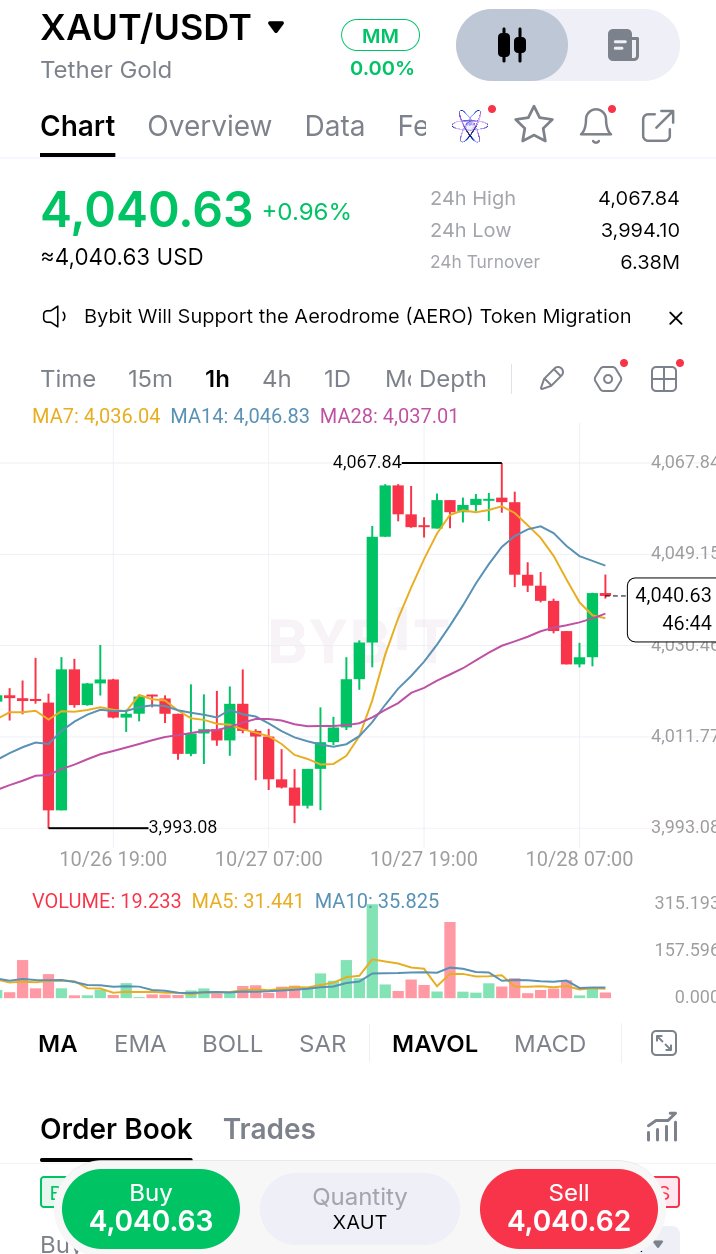
🥇 $XAUT: The Next Move Could Be Important $XAUT just made a strong recovery from the $3,993 area, pushing as high as $4,067.84 before sellers stepped in. Now price is back around $4,040.63, sitting directly inside a key decision zone. The question is simple: Are buyers preparing for another push higher, or is this bounce losing momentum? 👀 📊 Key Levels to Watch 🔴 Resistance: $4,049 → $4,067.84 🟢 Support: $4,030 → $4,037 ⚠️ Major Support: $3,993–$3,994 The moving averages are also tightly compressed: MA7: $4,036.04 MA14: $4,046.83 MA28: $4,037.01 That tells me XAUT is currently in a decision phase. 🔥 If bulls take control: A reclaim of $4,049 with strong volume could open the door for another test of $4,067.84. A confirmed breakout above that level would make the bullish structure much more interesting. ⚠️ If bears take control: A breakdown below $4,030 could weaken the current recovery and send price toward $4,000, with $3,993–$3,994 becoming the key area to defend. For me, the most important thing isn't simply whether XAUT goes up or down. It's how price reacts at $4,049 and $4,030. 🎯 Your call: Where do you think XAUT goes FIRST? 🚀 $4,067+ breakout 📉 $3,993 retest ⚡ Or sideways around $4,040? Drop your prediction below 👇 Let's see who reads this setup correctly. Not financial advice. Always manage your risk. #ByXIMPACT

#ByXIMPACT

S T E P H E N
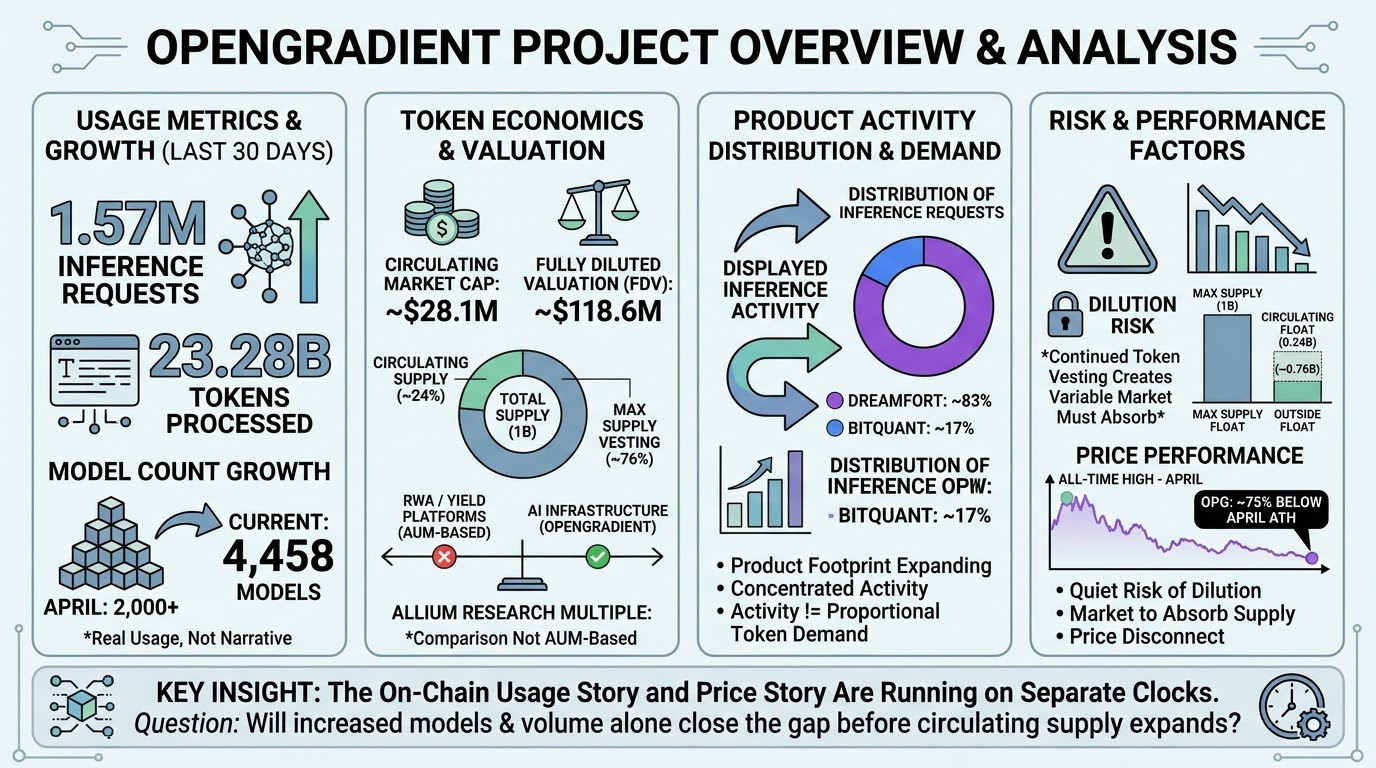
OpenGradient’s network dashboard reports 1.57M inference requests and 23.28B tokens processed over the last 30 days, while its model count has grown from 2,000+ in April to 4,458. That’s real usage, not narrative. The valuation is a different story. OPG trades at roughly a $28.1M circulating market cap against a $118.6M FDV, with only around 24% of its 1B supply circulating. I couldn’t verify an Allium Research valuation multiple for OPG, and an AUM-based comparison with RWA or yield platforms would be misleading: OpenGradient is AI infrastructure, not an asset manager. The product footprint is expanding, but displayed inference activity remains concentrated. The portal attributes roughly 83% of reported inference requests to DreamFort and 17% to BitQuant. More models and more processed tokens matter, but neither automatically translates into proportional token demand. The quieter risk is dilution. With roughly three-quarters of maximum supply still outside the circulating float, continued token vesting creates another variable the market has to absorb. OPG also remains approximately 75% below its April all-time high. None of this says the token is wrong. It says the on-chain usage story and the price story are running on separate clocks right now. Worth asking which one catches up to the other first—and whether more models and inference volume alone are enough to close that gap before circulating supply expands. #ByXIMPACT $OPGUSDT
#ByXIMPACT

Cripto0Hunter
Bullish
About $770B was added to US stocks today
$NVDAXUSDT $SPCXXUSDT 💸 after Trump turned down a proposal to attack Iran (The Market Periodical) 🛢️ Earlier, stocks also climbed and oil dropped when planned strikes on Iran were called off (Sherwood News) 🌪️ When US-Iran tensions flared back up, stocks slipped (Barchart) 🔥 Markets love calm 🕊️ But claims and denials can flip fast, so I'm watching the next headline. ⚠️ 🎯 Calm headlines or strong earnings: which pushes stocks harder? 👇 Follow for more ⚡ #ByXIMPACT #Bybit8thAnniversary #BybitStocks #FOMCRateDecision @BybitX @Underrated #MidtermsMarketWatch

#ByXIMPACT#Bybit8thAnniversary#BybitStocks#FOMCRateDecision#MidtermsMarketWatch

Bitxen
Bullish
$ONDOUSDT sits where macro and crypto narratives collide. Tokenized finance sounds more serious than meme liquidity, but serious narratives can still become crowded. If demand keeps building, Ondo may benefit from RWA rotation. If expectations run ahead of adoption, the correction can be sharp. #IMPACTbyTrade

#IMPACTbyTrade

MuzammilWeb3
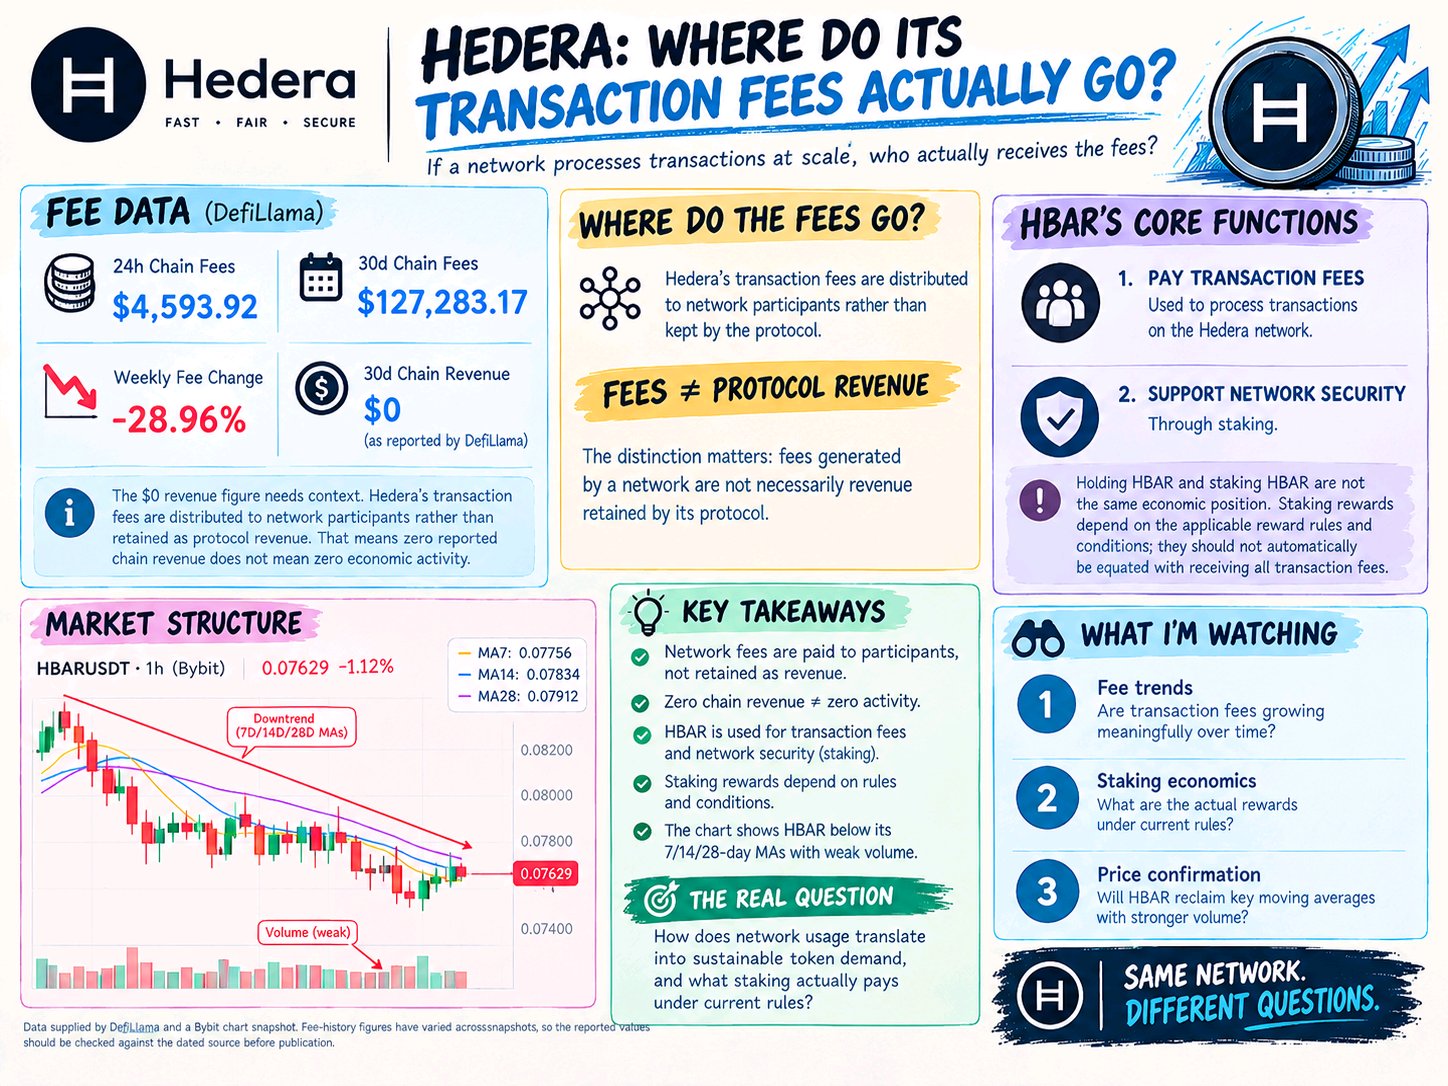
Hedera: Where Do Its Transaction Fees Actually Go?
Hedera presents an interesting question: if a network processes transactions at scale, who actually receives the fees? According to the DefiLlama data provided: • 24-hour chain fees: $4,593.92 • 30-day chain fees: $127,283.17 • Weekly fee change: -28.96% • 30-day chain revenue: $0, as reported by DefiLlama The $0 revenue figure needs context Hedera's transaction fees are distributed to network participants rather than retained as protocol revenue. That means zero reported chain revenue does not mean zero economic activity The distinction matters: fees generated by a network are not necessarily revenue retained by its protocol. $HBARUSDT has two core functions: paying network transaction fees and supporting network security through staking. But holding HBAR and staking HBAR are not the same economic position. Staking rewards depend on the applicable reward rules and conditions; they should not automatically be equated with receiving all transaction fees. The market structure also matters. At the reported price of $0.07629, HBAR was trading below its 7-day, 14-day and 28-day moving averages. All three averages were trending downward, while volume remained weak relative to its moving averages. That does not establish a future price direction, but it does suggest that the chart had not confirmed a strong recovery. My takeaway: Hedera's fee model is different from protocols that retain revenue in a treasury. The key question for HBAR holders is how network usage translates into sustainable token demand and what staking actually pays under current rules. I’m watching fee trends, staking economics and price confirmation—not transaction counts alone. Data supplied from DefiLlama and a Bybit chart snapshot. Fee-history figures have varied across snapshots, so the reported values should be checked against the dated source before publication. #ByXIMPACT
#ByXIMPACT

Shugaba1717
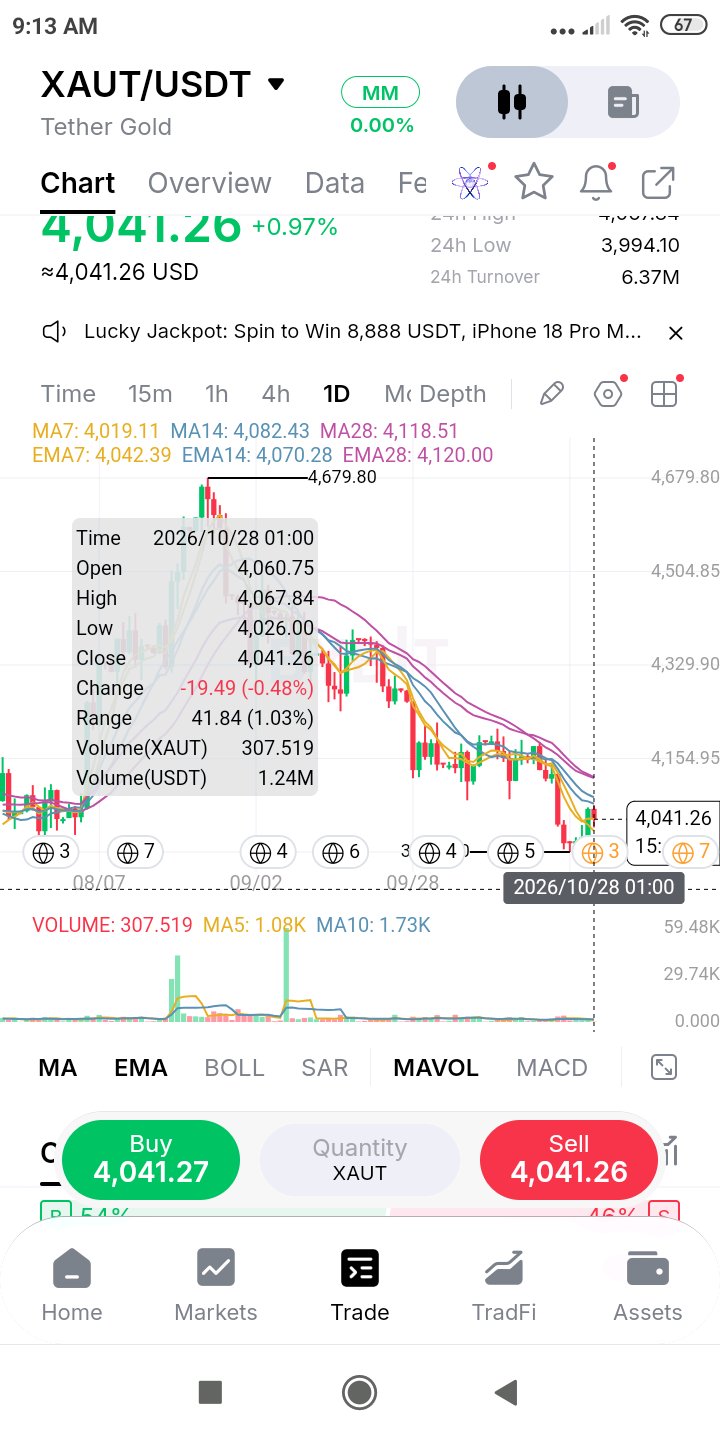
$XAUTUSDT peaked at 4,679.80 in late August and has stepped down in lower highs ever since, to a low near 3,980. It has now steadied around 4,041, above the MA7 (4,019) and sitting right on the EMA7 (4,042). Everything slower is still overhead: EMA14 4,070, MA14 4,082, MA28 4,119 and EMA28 4,120. Volume vs turnover: Volume counts XAUT traded and turnover counts the USDT value. At around 4,000 per token, 300 XAUT is already more than 1.2M USDT, so small-looking volume numbers still carry real money. Turnover is about 6.4M USDT over 24h. What stands out is the shape: there were huge green volume spikes in late August and September, while this whole decline has printed bars that barely register. A slide on thin volume means few sellers pushing, but also few buyers stepping in. A base here is quiet and needs a genuine volume day before I'd call it confirmed. Levels: Resistance: 4,068 (today's high), 4,070-4,082 (EMA14 and MA14), 4,119-4,120 (MA28 and EMA28 overlap), then roughly 4,350-4,400 where the last bounce stalled. Support: 4,026 (today's low), 3,994 (24h low), 3,980 (the low of this leg). Key level: 4,120. A daily close above it puts price over every average for the first time in this decline. Until then, each rally into the 4,070-4,120 band is a test, not a trend change. Trade logic and risk: Buying here risks about 1.5% to the 3,980 low for roughly 1% to the MA14 or 1.9% to the 28s. That's not enough. Waiting for a daily close over 4,120 gives up some of the move, but from about 4,125 a run to 4,350-4,400 is 5-7% up against roughly 3.5% to the low, around 1.6-1.9:1. A daily close under 3,980 removes the base, and I can't mark any support beneath it on this chart. Consideration: Gold reacts to dollar and yield headlines, and a headline can overrule a chart. The daily candle is also still forming. Quiet charts get loud eventually. I'd rather wait for that candle than predict it. #ByXIMPACT
#ByXIMPACT

Mantein
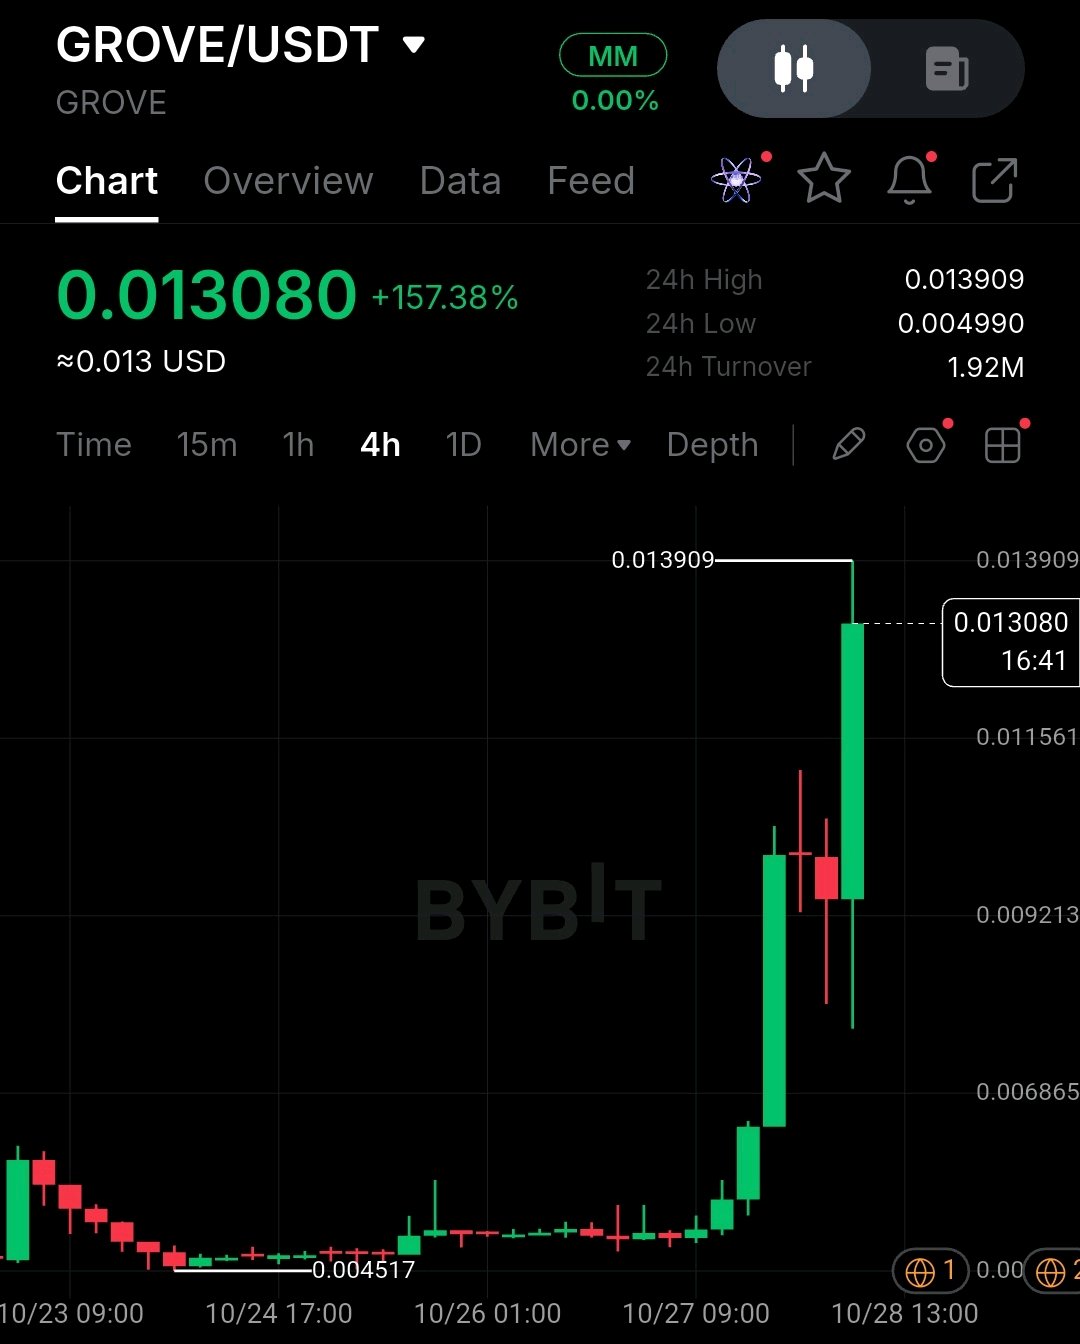
$GROVEUSDT just did something I rarely see on a 4H chart. It spent days asleep around 0.0045–0.005, then went vertical. It's now at 0.013080, up about 157% on the day, with a high of 0.013909. How we got here The base was boring. A low at 0.004517 and a lot of tiny candles. Then the ramp: a big green push, two indecisive candles with long wicks both ways around the 0.0100 area, and a fresh green candle that opened near 0.0095 and ran straight to the highs. That candle is still open, and I'd rather see a close before getting excited. Turnover and volume 24h turnover is 1.92M against a range of 0.004990 to 0.013909. That's a big move on modest turnover, and thin books can unwind as fast as they run up. My screen has no volume bars, so I'm not going to pretend to read them. Levels on my radar - 0.013909: the high, the first thing price has to reclaim on a close - 0.011561: first support below - 0.009213: the next shelf, close to where the indecision happened - ~0.0077: the lower wick of the current candle, where dip buyers showed up My read I don't like chasing this. Buying near 0.0116 with a stop under 0.0092 risks about 0.0024 to make about 0.0023 on a retest of the high. That's under 1:1, and I'd skip it. If you want a scenario, a pullback toward 0.0095 with a stop under 0.0075 and a target at 0.013909 risks about 0.0020 for about 0.0044, roughly 2.2:1 gross, before fees and slippage. The catch is that a pullback may never come, and missing the move beats forcing a bad entry. What flips the view A 4H close back under 0.0092 means this is fading back into the earlier chop. Under 0.0077, most of the move has been given back. A clean 4H close above 0.013909 would be the first real confirmation of continuation. After a +157% day, I'd keep size small whichever way it goes. Scenario, not a signal. Are you waiting for a retest, or only buying strength above 0.013909? OPTIONAL ALTERNATIVE HOOK GROVE went from a four-day yawn to a +157% day. I'm watching 0.0092 more than the highs. #ByXIMPACT #BybitStocks
#ByXIMPACT#BybitStocks
Bitxen
Bullish
AERO Market Update | Watching Key Support🔥 Last week, we identified a high probability of a reversal in $AEROUSDT based on its weakening price action and market structure. Since then, AERO has dropped approximately 18%. This pullback has brought price toward the $0.68 area, where an uptrend Anchored VWAP from the local lows aligns with a demand zone and daily level. $AERO is now testing its first support area, but we're still waiting for clearer signs of strength. So far, bullish signals remain limited, with lower timeframes continuing to print lower highs and lower lows. If this support fails to hold, the next stronger support sits at the $0.479 weekly level, where the range POC aligns with another uptrend Anchored VWAP. #IMPACTbyTrade $XRPUSDT

#IMPACTbyTrade
Microsoft's earnings debate can be reduced to four competing priorities: A) Azure growth and AI consumption B) Copilot monetization and renewals C) Capex, depreciation and free cash flow D) Commercial backlog conversion My vote goes to C, but only because A and B are already well-known parts of the bullish story. The incremental question is how much capital has to be committed before the benefits reach shareholders. An impressive product narrative can coexist with a difficult investment cycle. What's your deciding metric? #EarningsWatch
CryptoAuthor
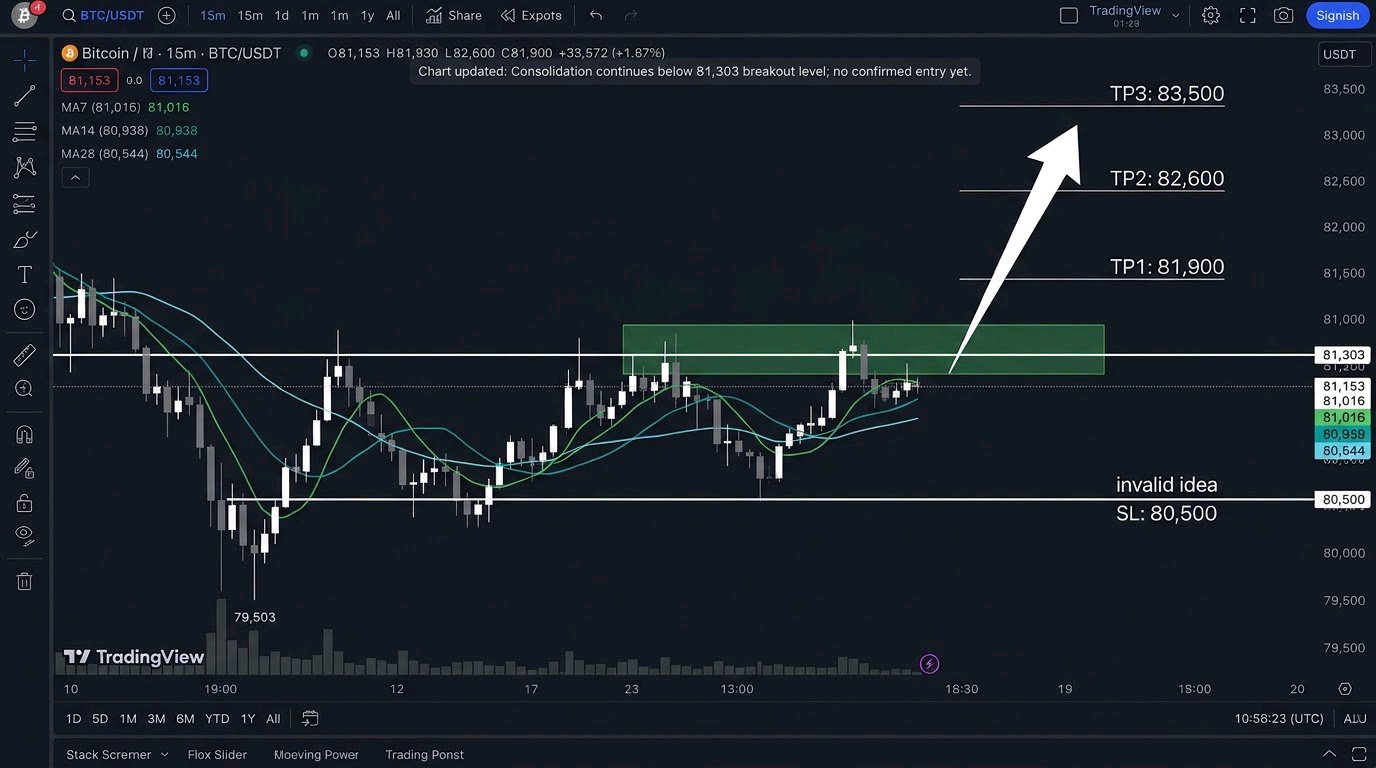
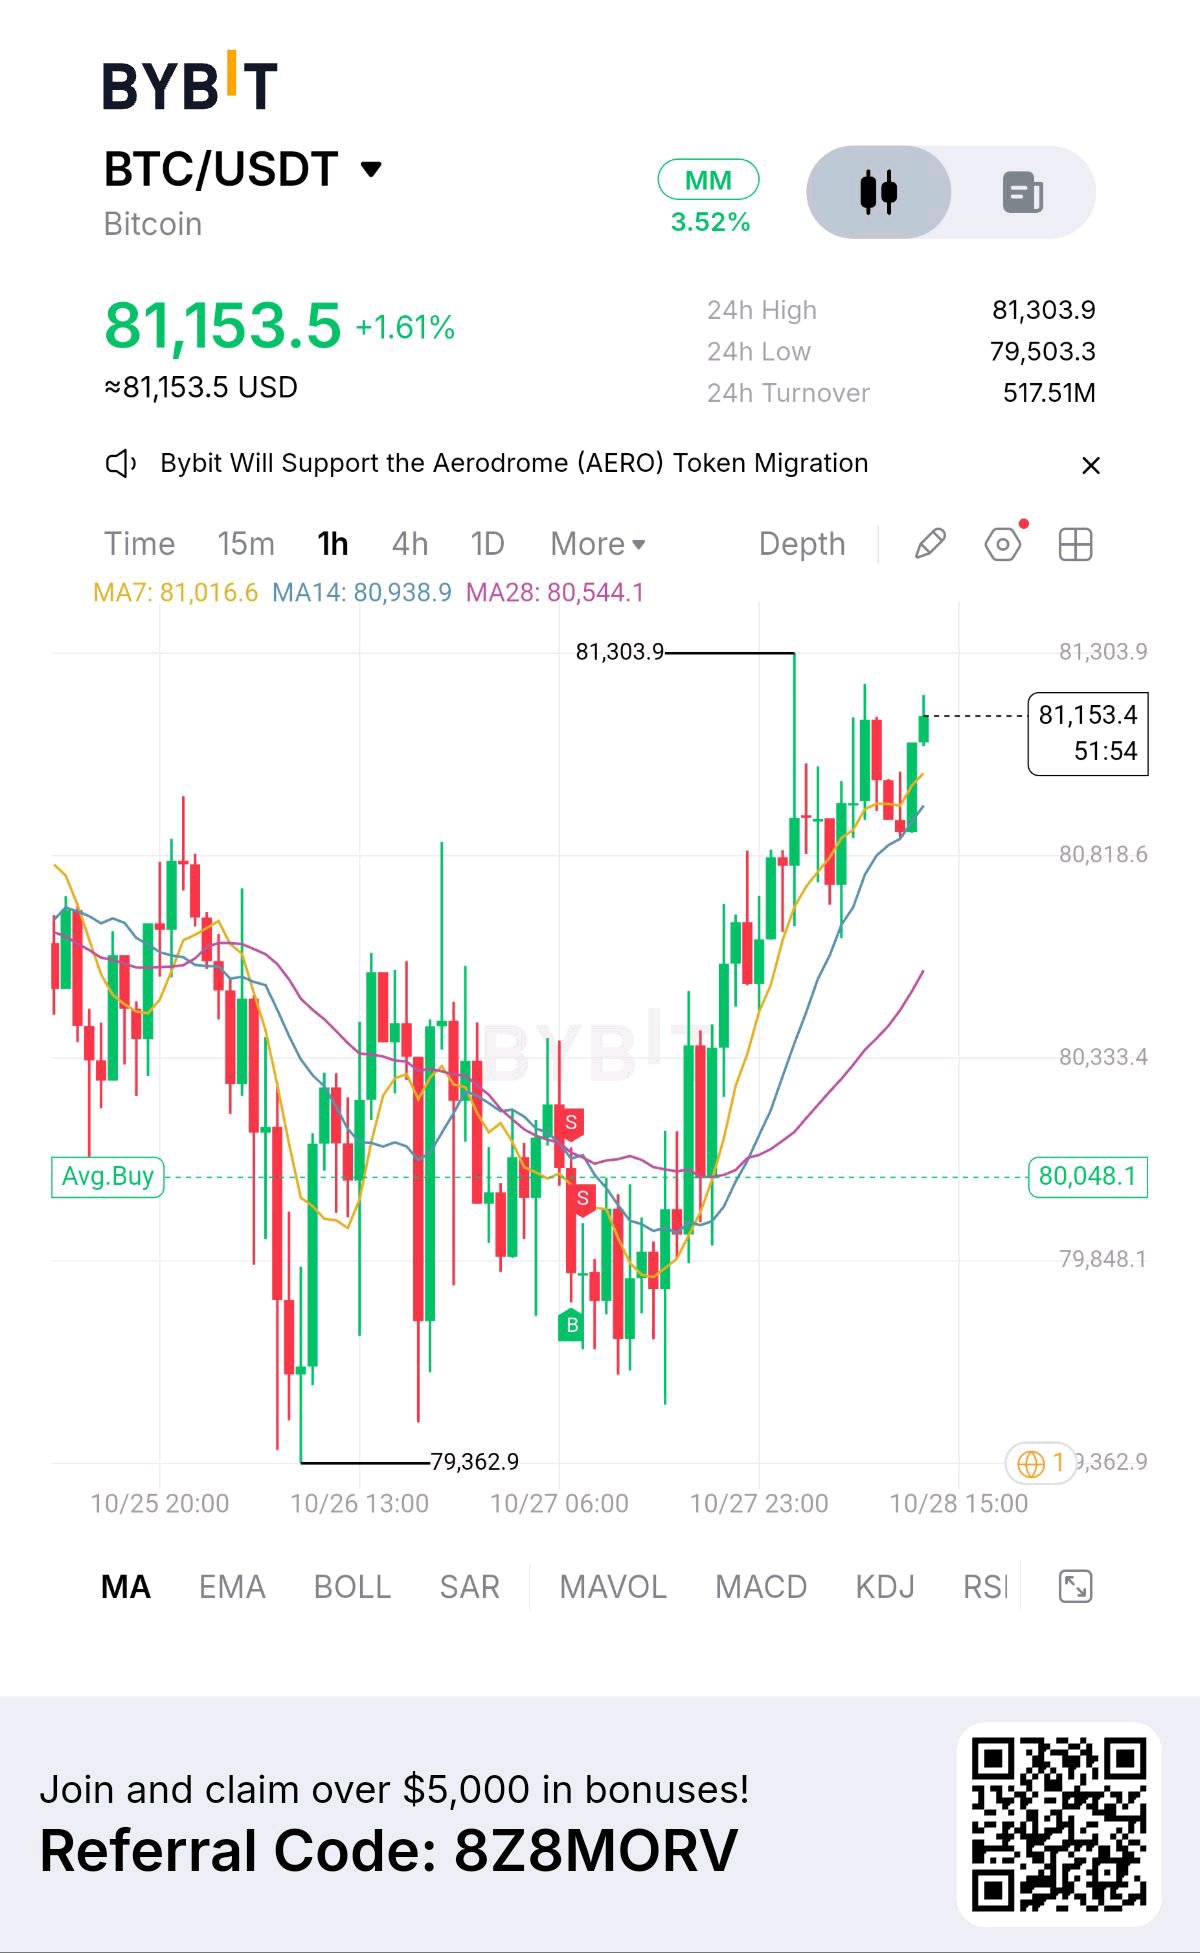
$BTCUSDT just reclaimed the 81K zone, but I'm not chasing yet. is trading around 81,153 (+1.61%), pushing toward the 24h high of 81,303.9. Price is sitting above MA7 (81,016) and MA14 (80,938), with MA28 at 80,544 acting as trend support. That's a constructive structure, but the 24h range is tight (79,503–81,303), so a breakout needs a real close above 81.3K, not just a wick. Setup (long, only on confirmation): Entry: 81,350 (after a 15m close above 81,303) TP1: 81,900 TP2: 82,600 TP3: 83,500 SL: 80,500 Targets are my own projections, not guarantees. If 80,500 breaks, the bullish idea is invalid and I'm out. Risk 1-2% per trade at most. Rejection at 81.3K could send price back to retest the MAs, so patience matters. Are you buying the breakout or waiting for a pullback to MA14? #IMPACTbyTrade #ByXIMPACT
#IMPACTbyTrade#ByXIMPACT

102 Jony Dong
Bearish
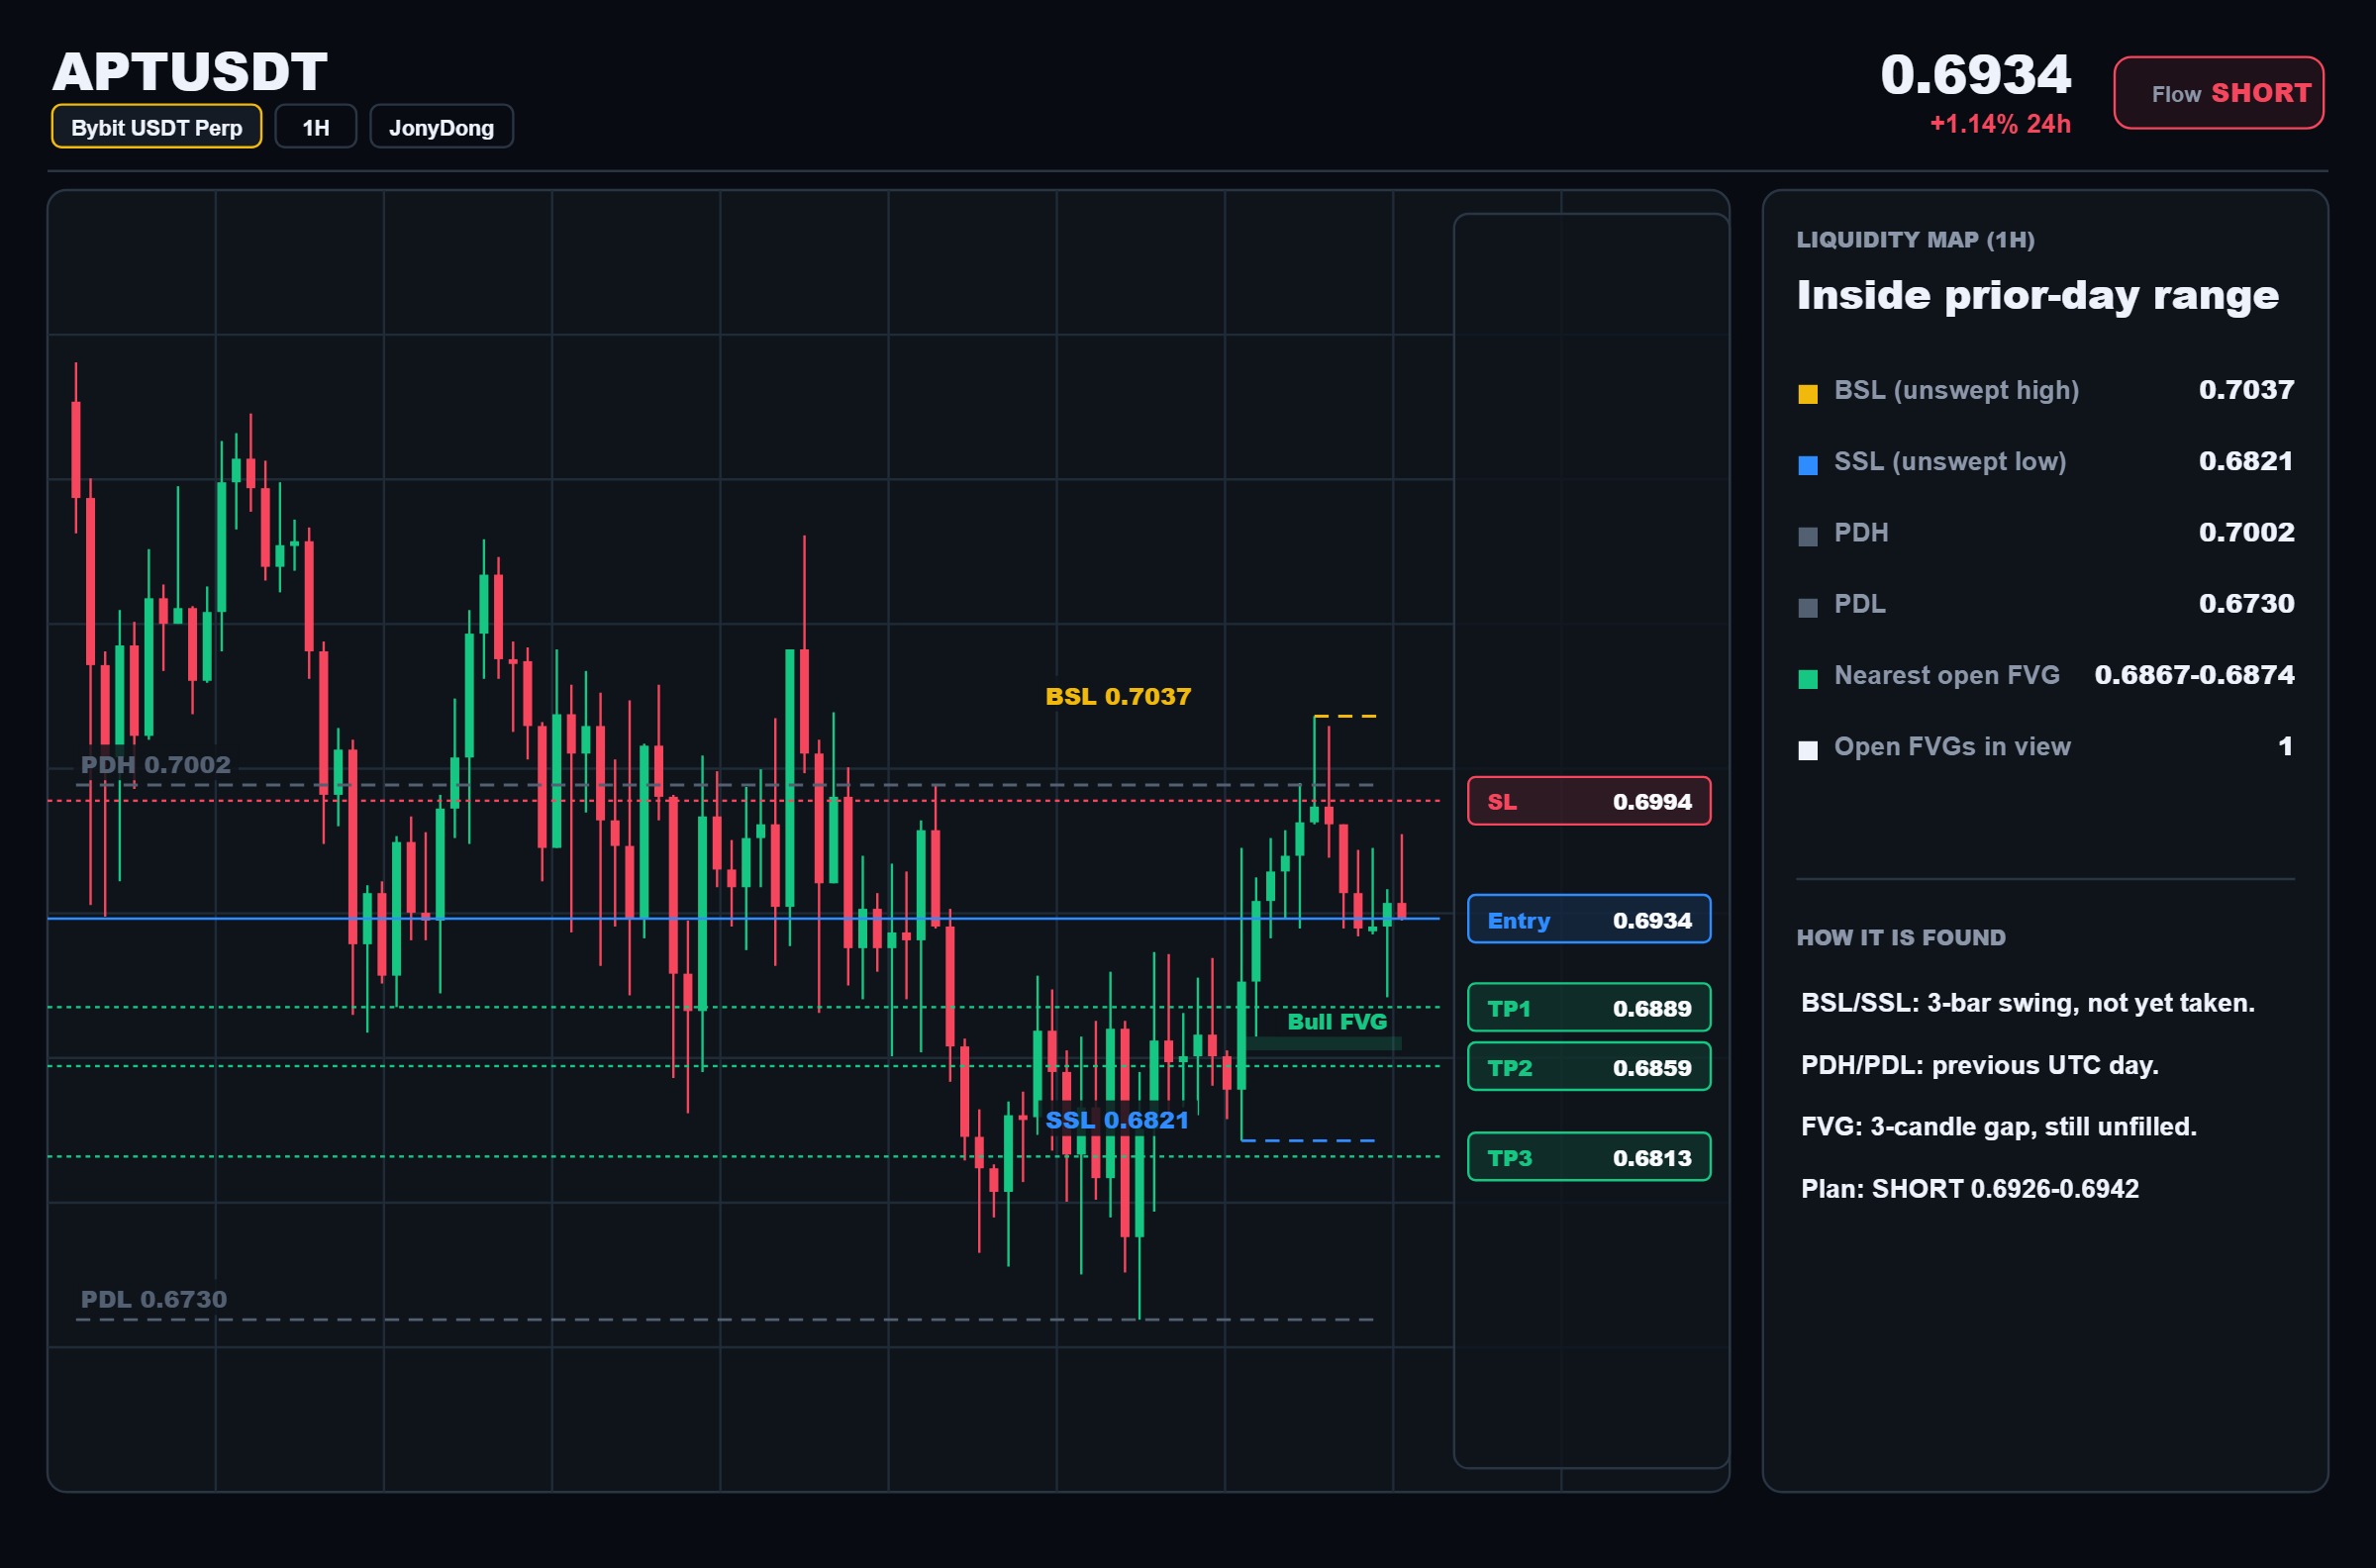
Short $APTUSDC : price sits at 0.694 on the 4H, the line sellers must hold. Reject 0.694 → 0.686, then 0.681. Reclaim 0.699 → the idea is off the table. I want to see sellers lean on this zone before I lean short. The read: 4H price 0.693 below EMA50 0.729, trend structure still favors sellersRisk 0.87% to SL vs 1.7% to TP3, about 2.0R if the full move plays outDaily below EMA200 0.805, the bigger trend is on this sideSHORT · Entry 0.6926–0.6942 · TP 0.6889 / 0.6859 / 0.6813 · SL 0.6994NFA · DYOR

CashCalling™
🎯 CashCalling Conviction A thesis should be specific enough to be examined after the trade. If you cannot explain why you entered, you will struggle to learn from the result. $BTC #Trading

BlockChainMafia
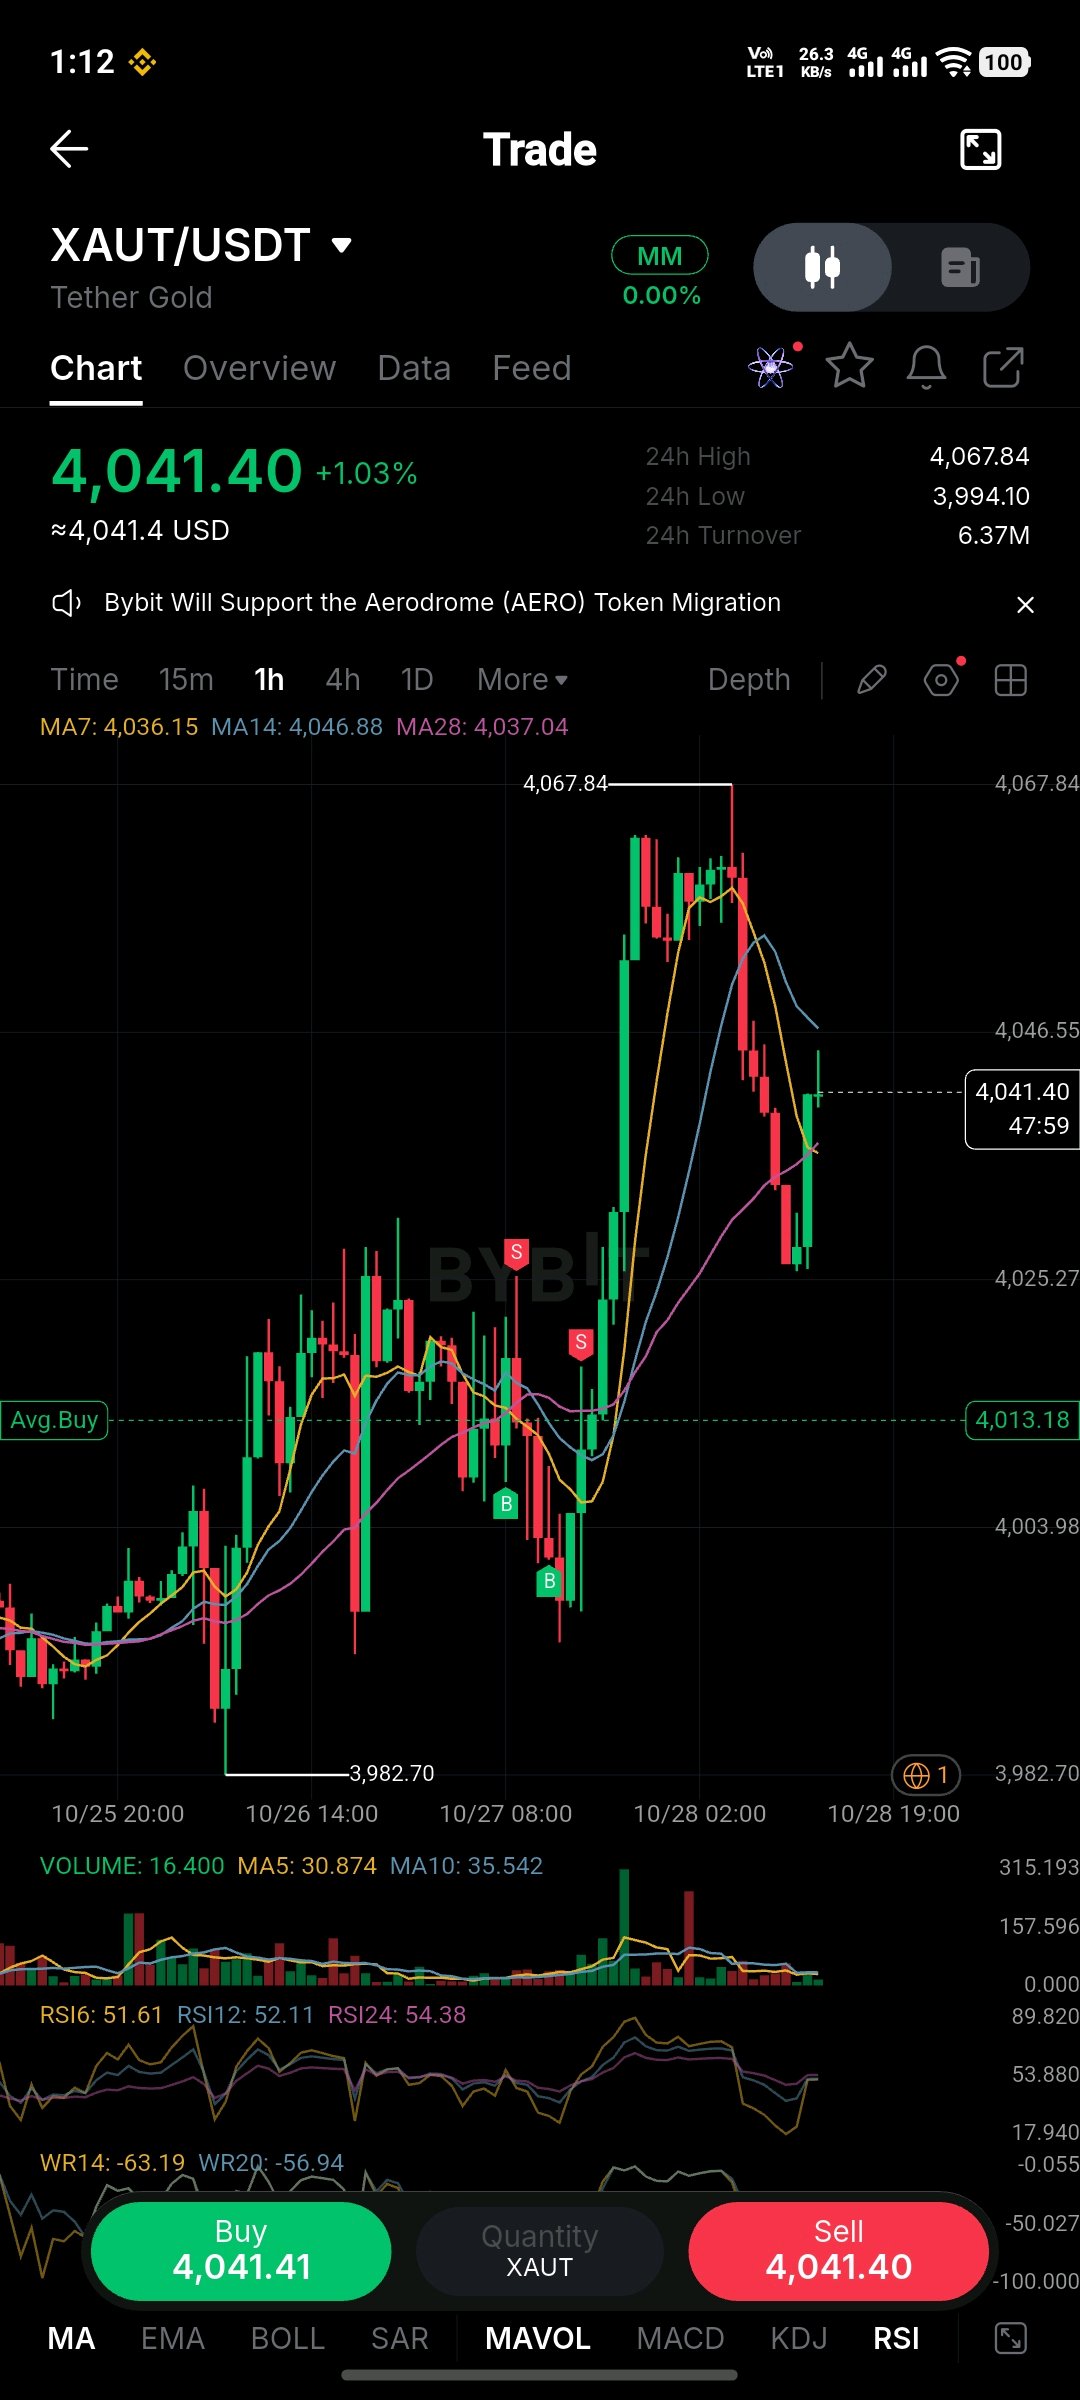
🚀 XAUT/USDT – BUY THE DIP OR WATCH THE BREAKOUT! I'm watching XAUT closely as buyers try to push the price higher after a strong recovery from the $4,025 support area. The price is currently trading at $4,041.40, up 1.03% in 24 hours. Bulls are showing fresh interest, but an important resistance zone is still ahead. 🟢 BUY ZONE: $4,032 – $4,038 🎯 TAKE-PROFIT TARGETS: - TP1: $4,047 - TP2: $4,058 - TP3: $4,067 🛑 STOP-LOSS: $4,018 📊 KEY LEVELS TO WATCH: - Support 1: $4,025 - Support 2: $4,013 - Support 3: $4,004 - Resistance 1: $4,046 - Resistance 2: $4,067 🔥 MARKET FEELING: CAUTIOUSLY BULLISH The 1-hour RSI is around 51, showing a slight improvement in buying strength. I'm looking for XAUT to break above $4,047 with strong volume. If buyers hold control, we could see another move toward $4,067. However, losing $4,025 could bring fresh selling pressure. ⚠️ Don't rush into a trade. Wait for confirmation, manage your risk, and protect your capital. Every move needs a smart plan! ❤️ Follow my account for more trading updates and fresh opportunities. 📢 Share this signal with your trading friends and trading fam! $XAUTUSDT

Tahir28
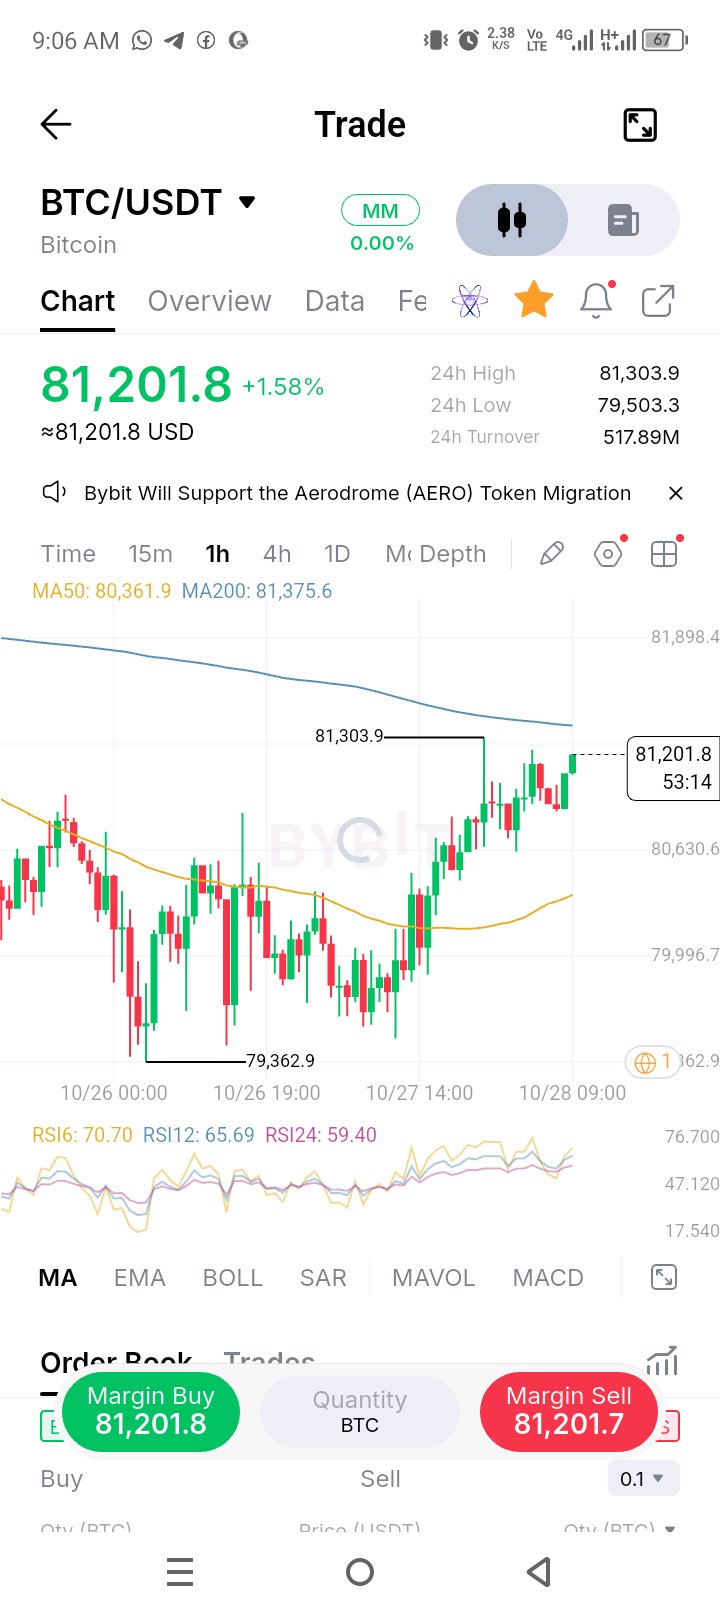
$BTCUSDT V-bottomed and is knocking on its MA200 Sharp recovery here. Dropped to 79,362, nearly tagged 81,303 on the bounce, pulled back, and is now grinding higher again to 81,201. That's a fast V off the low, and it's already approaching the same resistance it hit on the first attempt. MA200 (81,375.6) is the level right above current price, and it's been sloping down the whole time, now just barely starting to flatten as price climbs into it. This is the real test, BTC hasn't closed above this average in a while. What I like about this move is the shape underneath it. Since the low, price reclaimed the MA50 (80,361.9) and has been holding above it through the whole climb, using it as support on pullbacks instead of losing it. That's healthier than a vertical spike with no structure behind it. RSI6 at 71, RSI12 at 66, RSI24 at 59, all climbing together, no divergence. Momentum backing the price action, not lagging behind it. 79,362.9 is the deep level if this fails completely, far below right now. The level that actually matters is 81,375 (MA200), clear that with a real close and 81,898 becomes the next target. Get rejected here again like the first attempt and it's back into the range below. Second test of a key level after already touching it once, I'd want to see a clean close above the MA200 before trusting this breaks through rather than fading again. #ByXIMPACT $BTCUSDT $ETHUSDT
#ByXIMPACT
CashCalling™
💡 CashCalling Alpha For RWA assets, a trading decision should start with the actual product. Understand the underlying exposure before interpreting the token's price. $ONDO #Trading

Technical Trader
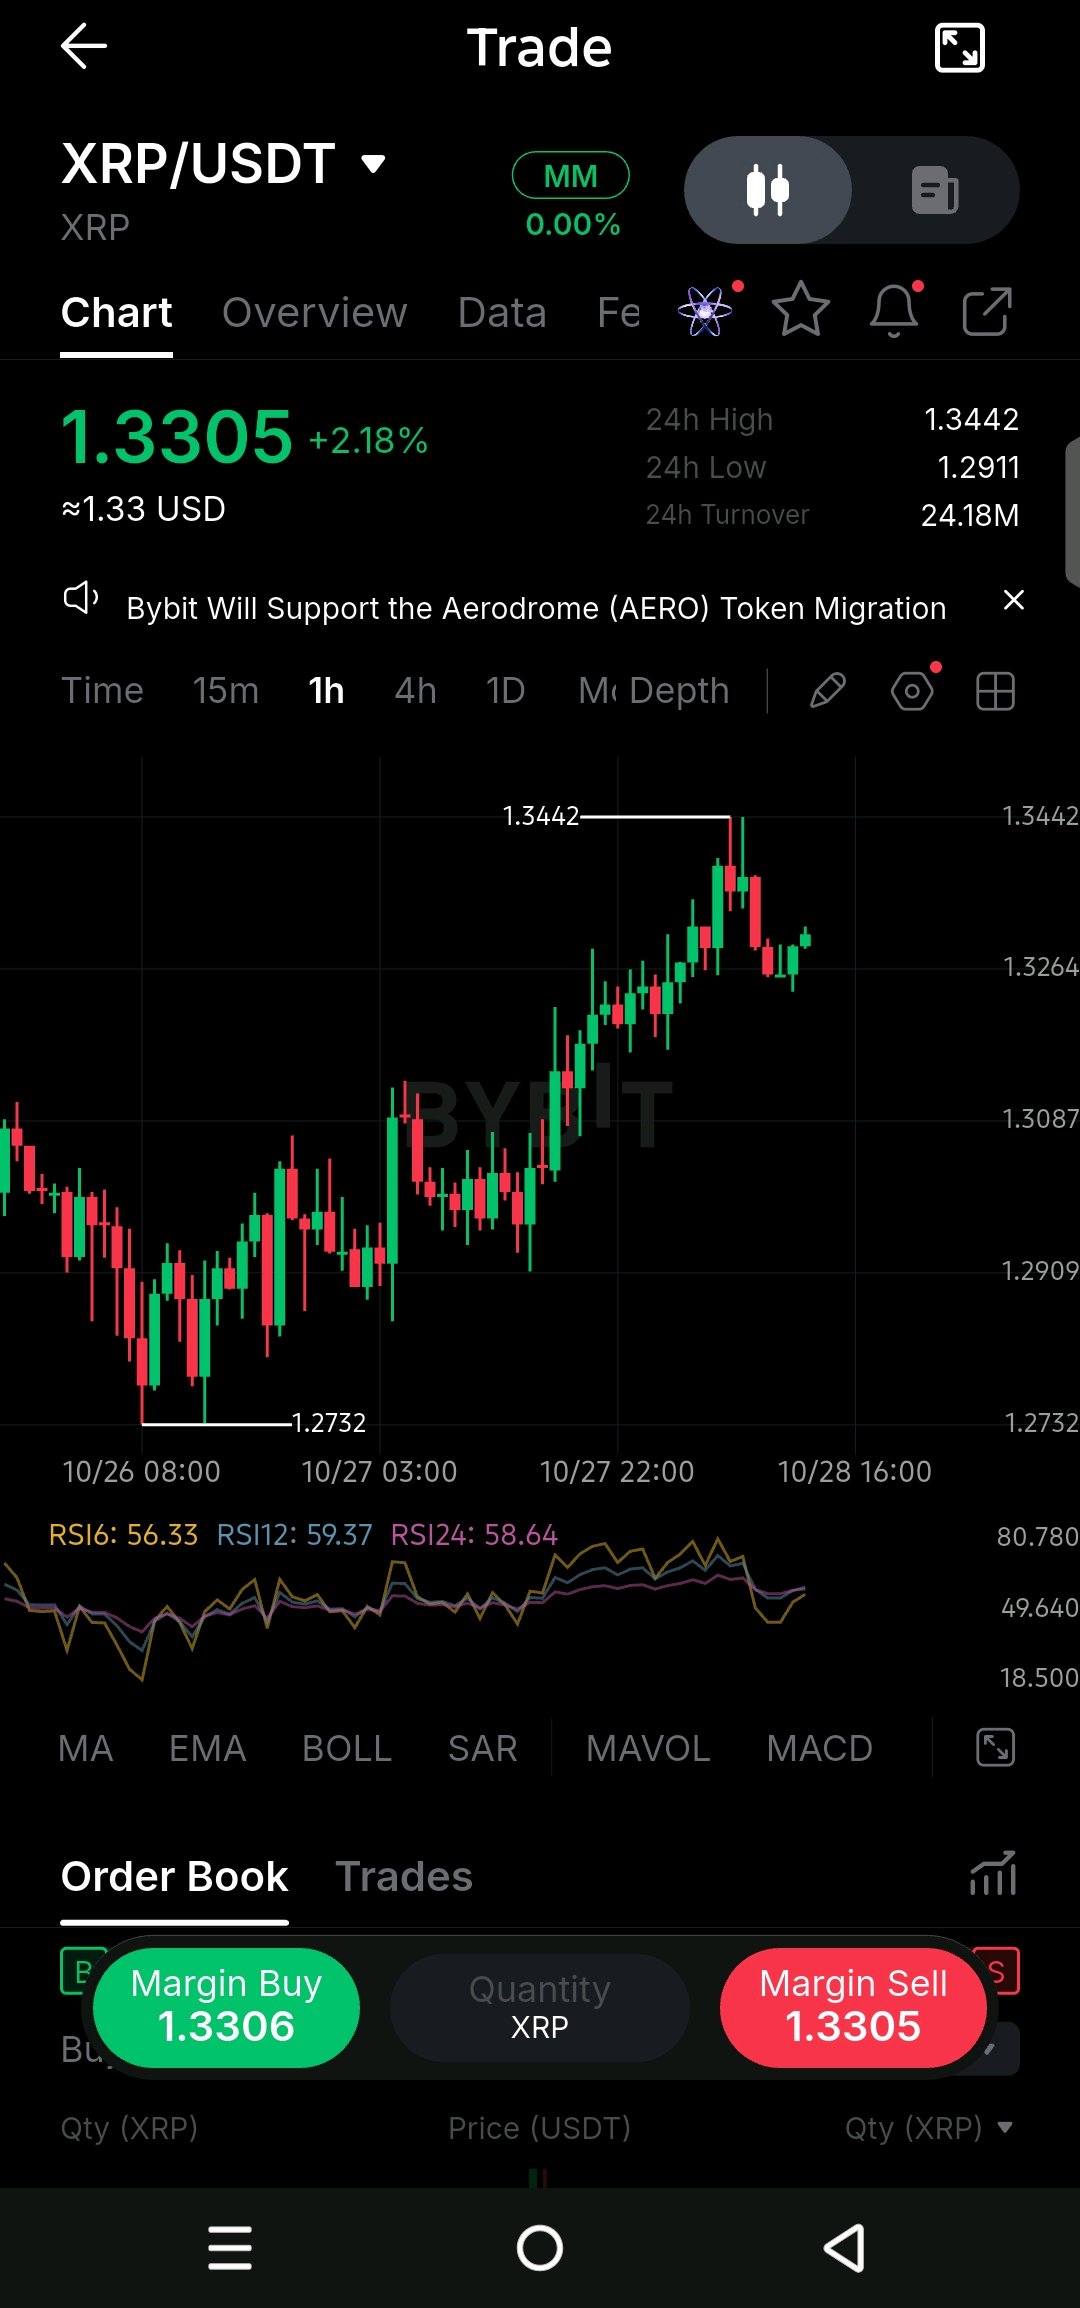
$XRPUSDT is climbing strongly on the 1h after bouncing hard from that low... 👀 Look at this move from 1.2732 → clean higher structure forming. Price tagged 1.3442 and got a quick REJECTION... now sitting around 1.3305. RSI holding mid-range near 56-59... still has room. SUPPORT near the recent swing lows is key right now. If it holds → another push toward that 1.3442 high becomes possible. 📈 Break below and the next visible area comes into play. Keep an eye on how price reacts at current levels... This high could act as RESISTANCE again. Follow for more chart analysis 😎 #ByXIMPACT
#ByXIMPACT

BULLISH
🚨 WALL STREET IS LOADING UP ON BITCOIN! 🇺🇸 Big money is making its move! BlackRock and other Bitcoin ETFs have reportedly added $176 million worth of BTC, showing that institutional interest is still alive. This is the kind of buying activity traders don't want to ignore. While market sentiment remains uncertain, large purchases could help strengthen Bitcoin's demand and support a potential recovery. Now all eyes are on BTC. Can this institutional buying bring fresh bullish momentum and push the market higher? The next move will be interesting to watch. Follow for more and share with your trading fam! $BTCUSDT #ByXIMPACT


#ByXIMPACT

Mr. Mann
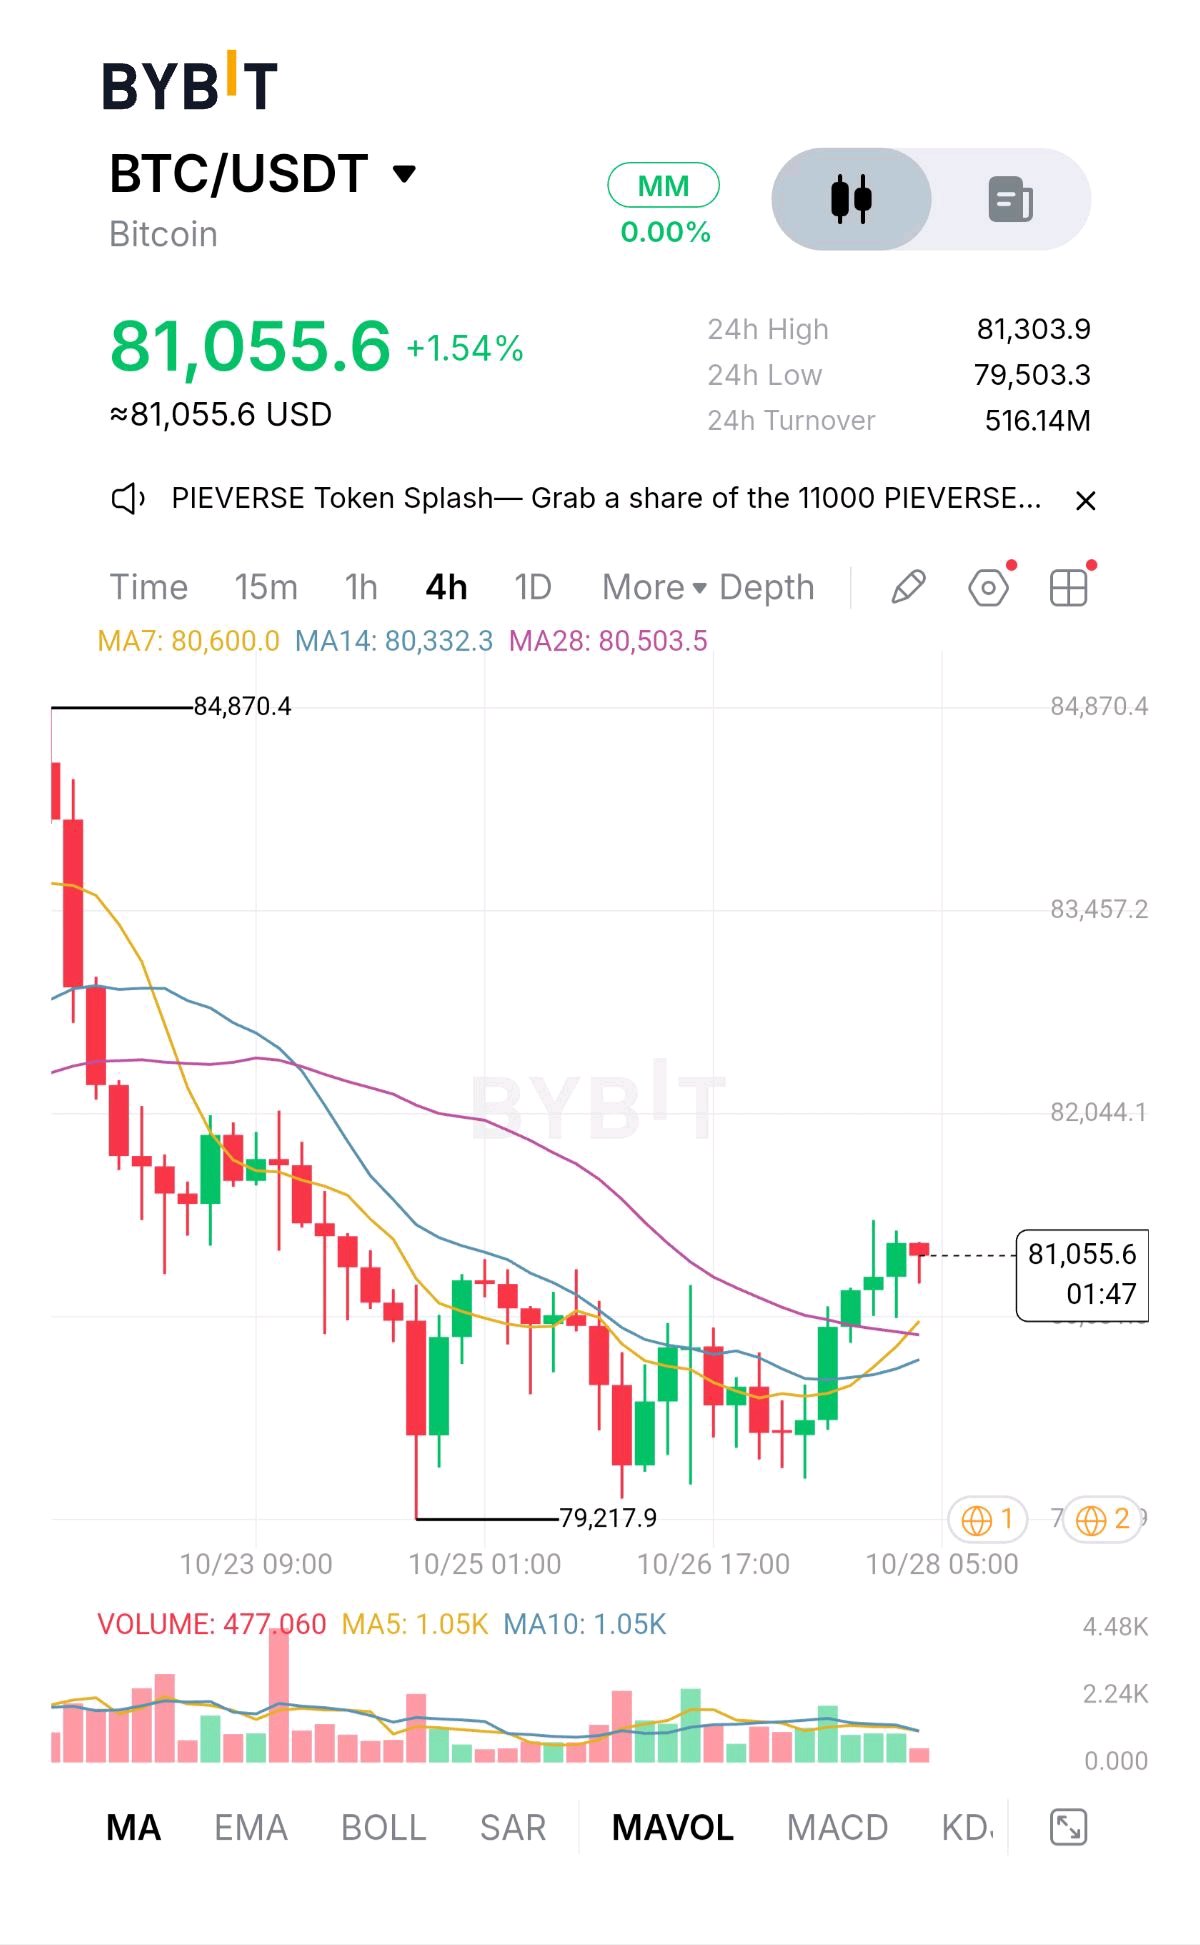
⚡ BITCOIN (BTC) SITS AT 81,055.60 USDT — RAISING (+1.54%) ⚡ Bitcoin (BTC) is trading at 81,055.60 USDT on the 4H timeframe, attempting to hold higher ground (+1.54% 24h change) following a strong rebound from its key local support floor at 79,503.30 USDT up to its recent peak near 81,303.90 USDT. MARKET SITUATION Price is currently consolidating around 81,055.60 USDT after holding above the key moving average cluster (24h Low: 79,503.30 USDT / 24h High: 81,303.90 USDT). 24h Turnover stands at 516.14M USDT. MY OBSERVATION Price is trading strictly above the MA7 (80,600.00 USDT), MA14 (80,332.30 USDT), and MA28 (80,503.50 USDT). The short-term moving averages have formed a tight bullish convergence beneath current price action, providing an immediate dynamic demand floor. TECHNICAL ANALYSIS Moving Averages: MA7 (80,600.00) and MA14 (80,332.30) are sloping upward alongside MA28 (80,503.50), establishing a stacked bullish alignment under price. Candlestick Structure: Price has established higher swing lows since bouncing off 79,217.90 USDT, with recent 4H candles showing buyer absorption on lower-wick retests of the MA cluster. KEY LEVELS Resistance: 81,303.90 USDT (24h High), 82,044.10 USDT (Key Structural Resistance), 84,870.40 USDT (Major Target Zone) Support: 80,332.30–80,600.00 USDT (MA7/MA14 Support Cluster), 80,503.50 USDT (MA28 Dynamic Support), 79,503.30 USDT (24h Low), 79,217.90 USDT (Major Structural Floor) BULLISH AND BEARISH SCENARIOS Bullish Scenario: A clean 4H candle close above 81,303.90 USDT unlocks momentum toward the major structural resistance at 82,044.10 USDT, with a breakout opening expansion targets near 84,870.40 USDT. Bearish Scenario: A breakdown below the MA28 support at 80,503.50 USDT triggers a pullback toward 79,503.30 USDT, with a loss of that level exposing the 79,217.90 USDT key floor. ENTRY, TAKE-PROFIT AND INVALIDATION LEVELS Execution Strategy: Long retest on local MA support Entry: 80,750.00 USDT Take-Profit (TP): 84,350.00 USDT ($3,600.00 Gain per BTC) Invalidation / Stop-Loss (SL): 79,550.00 USDT ($1,200.00 Risk per BTC) MOMENTUM AND VOLUME Volume indicator (MAVOL) shows current candle activity backed by an MA5 volume of 1.05K BTC and MA10 of 1.05K BTC. Order book depth shows strong buyer support (73% Buyers vs 27% Sellers) clustering around the 81,062.20–81,063.30 USDT range. Low volume during consolidation indicates buyers need a volume expansion above MA10 to push past the 81,303.90 USDT resistance zone. RISK MANAGEMENT Maintain disciplined position sizing using max 10x cross leverage. Keep total risk per trade capped strictly at 1–2% of trading account capital. KEY FACTORS TO WATCH MA Support Defense: Holding above the 80,332.30–80,600.00 USDT MA zone. 24h High Breakout: Volume sweep pushing price above 81,303.90 USDT. Order Book Depth: Immediate order book liquidity showing strong bids clustered around 81,062.20–81,063.30 USDT. FINAL TAKE BTC is maintaining a solid bullish structure above all major 4H moving averages (MA7, MA14, MA28). Dips toward the 80,750.00 USDT zone offer a favorable 3.0R Risk/Reward long entry targeting 84,350.00 USDT with invalidation below 79,550.00 USDT. #ByXIMPACT $BTCUSDT
#ByXIMPACT
CashCalling™
📊 CashCalling Market Desk A private-credit product can distribute income while the credit quality underneath it changes. The payment alone doesn't tell the whole investment story. $CFG #Trading
BULLISH
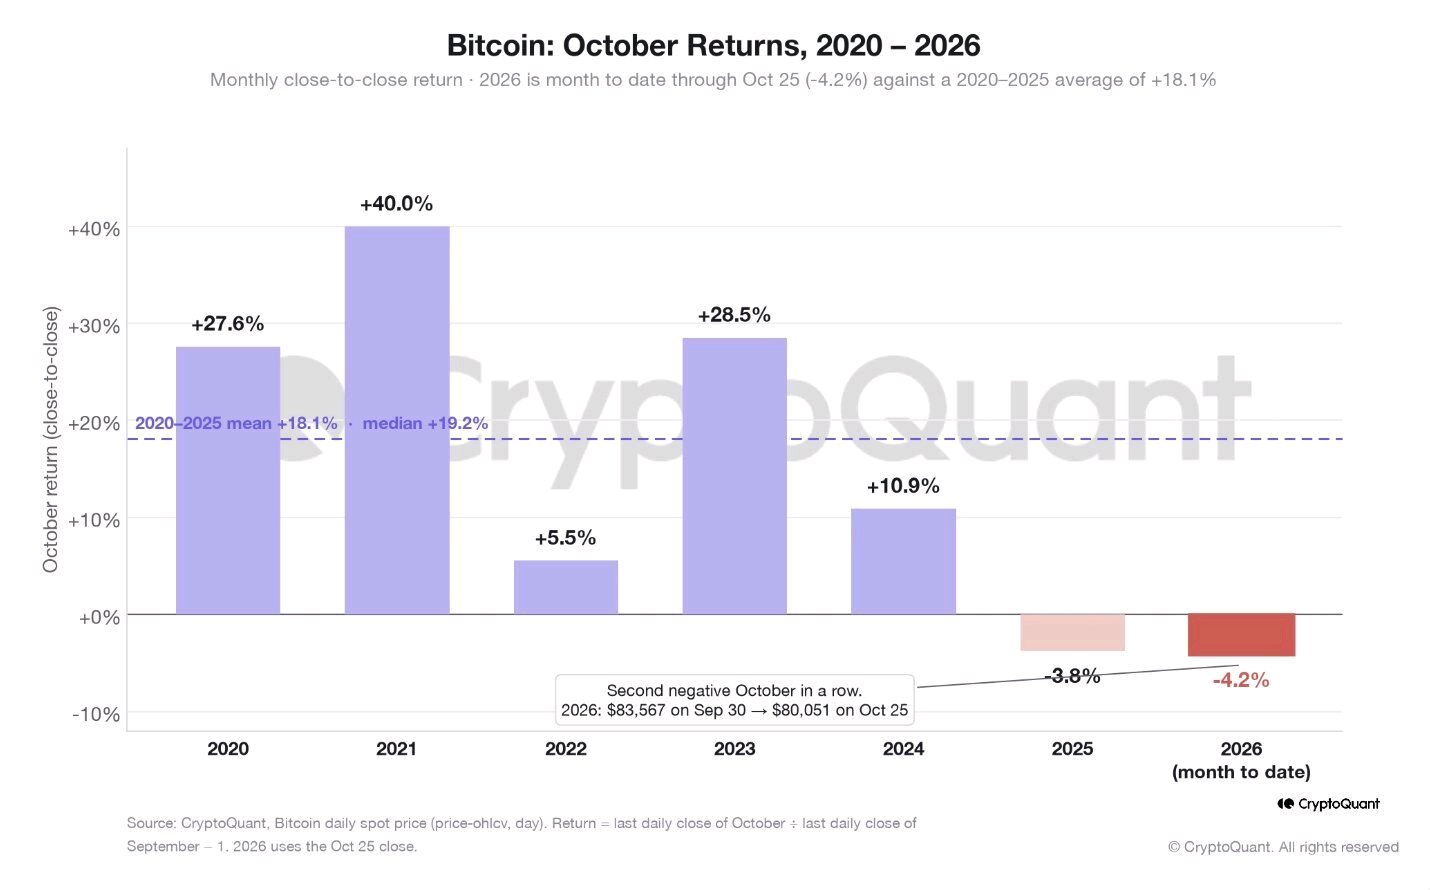
🔴 BITCOIN FACES ANOTHER RED OCTOBER! Bitcoin is currently down 4.2% this October, raising concerns that history could repeat itself with two consecutive negative Octobers. October has often been a strong month for Bitcoin, but this time the market is showing a different side. Selling pressure is building, and bulls are struggling to bring back strong momentum. The big question now is whether buyers can step in and turn things around before the month ends. A recovery could change the market mood, but continued weakness may bring more downside pressure. I'm keeping a close eye on Bitcoin because the next few days could be important for its short-term direction. Don't let market emotions control your decisions. Stay patient and manage your risk. Follow for more and share with your trading fam! $BTCUSDT #ByXIMPACT
#ByXIMPACT

Mrsuper
Bullish
📈 $BNB 合约多单|站回 750 就是发令枪,这波能摸到 775 吗? 📍 入场:$740.00 - $746.00 🛑 止损:$730.50 🎯 止盈1:$758.00 🎯 止盈2:$774.00 💡 逻辑: ① 技术结构:现价 745 美元,24h 涨 1.3%,7 日基本走平(-0.18%),30 日 -2.5%,典型的横盘末端。日线 50 日均线在 749.8,价格就贴在它下沿磨,200 日均线 653.7 还稳稳在下方 14% 的位置,中期多头结构没坏。RSI(14) 从 10 月 19 日的 41 一路回到 60,动能是实打实修复的。4 小时级别更清楚:734、739、742、744,低点一路抬高,价格站在 4 小时 EMA20(742.9)上方。上方 750-753 是 50 日线与 20 日均线的共振阻力,也是前面几次被打回的位置;下方 734 是这波起涨的低点,705-706 是 20 日区间的底。所以这单是在多头结构里赌一次阻力突破,不是追高。 ② 量能与资金:24h 成交额约 7660 万美元,日内量能不算炸,但 4 小时里那根冲 754 的阳线放了 2440 万,属于放量试探,随后缩量回踩 745,是健康换手而不是派发。合约端 24h 成交约 2470 万美元,持仓量 13.6 万枚 BNB(约 1 亿美元),过去 6 小时从 13.7 万缓慢下滑,价格却没跟着跌——减仓不跌价,通常是空头在悄悄平。资金费率 -0.0032%,轻微负值,说明永续这边空头略占多数、还得付钱给多头,这种结构一旦向上突破,容易引发被动回补。几项凑一起,偏向「跌不动」。 ③ 基本面催化:今天 10 月 28 日,Jenner 硬分叉正式上了 BSC 测试网,带来 Payment Lane(默认预留 5% 区块 Gas 给支付类交易)、毫秒级区块时间戳,以及新的合规资产标准 CAS20,这是当天落地的叙事。再往前,10 月 22 日官方文档确认要再造一条并行新 L1,200 毫秒出块、20 毫秒预确认,关键一句是「不发新币」,BNB 继续做 Gas、质押和治理,等于新链的价值全回流到 BNB 本身。10 月 19 日第 37 次季度销毁干掉 164.6 万枚 BNB,约 11.97 亿美元,总供应降到 1.315 亿枚,离 1 亿枚目标还剩 3150 万。供应在缩、用途在扩,这两条是硬逻辑。 ④ 情绪与风险:大盘这边 BTC 站上 8 万美元、24h 成交 97 亿美元,主流普涨但山寨没跟上,资金明显还挤在头部,BNB 作为市值第四(约 980 亿美元)是受益的一方。风险也实在:750-753 已经反复拒绝过好几次,突破失败就是假动作;新 L1 的测试网要等到年底、主网 2027 年初,属于远期故事,短期靠情绪推;季度销毁是可预期事件,早就被 price in 了一部分。所以止损必须放 730.5——跌破 734 这个起涨低点,说明抬高低点的节奏断了,多单逻辑直接作废,别犹豫也别扛单。 750 这道坎今天已经试过一次了,你觉得这次能站上去,还是又要被打回来?评论区聊聊你的目标价。仓位控制别上头,严格带止损。$BNBUSDT

财道
这次在拉升,多没走的可以随时止盈,不想走你就利润锁住不去管了,而空仍然是一层仓拿,不去补仓,刚才空没进的,就等15分钟再出来一次两情相悦死叉时空一层仓就可以,重点还是看能否破2380,破了站上去,后面在拐头才做三层仓应对,不然不补!
CashCalling™
🔥 CashCalling Signal A tokenised asset may have a secondary-market price and separate redemption conditions. Understand both before trading. $POLYX #Trading

Bigoo
ADA is trying to bounce from the $0.20 area, but I’m watching whether buyers can reclaim $0.21 after the recent breakdown from $0.23. The price is showing a small recovery, yet the broader structure remains under pressure until buyers can turn nearby resistance into support. Cardano is trading near $0.206, with a 24-hour range around $0.201–$0.208 and daily trading volume close to $117M. Its market capitalization is approximately $8.05B, while ADA remains about 93% below its September 2021 all-time high near $3.10. The immediate question is whether the $0.20 region can become a genuine base or whether this bounce will fade into another lower high. The short-term structure remains weak. ADA declined from around $0.230 on October 21 to near $0.201 on October 27, with the sharpest pressure appearing around October 22. The $0.200–$0.202 zone is the first support area buyers need to defend, while $0.208–$0.212 is the immediate resistance region. A sustained reclaim of $0.212 would provide stronger evidence that momentum is improving. The more interesting signal is Cardano’s stablecoin liquidity. A recent market report highlighted that ADA’s September–October rally coincided with rising derivatives open interest, while Cardano’s stablecoin supply declined. That divergence matters: leveraged positions can push price higher in the short term, but falling stablecoin liquidity may limit the capital available to sustain a broader DeFi recovery. If derivatives exposure remains elevated without stronger spot demand, price can become vulnerable to sharp liquidations. Cardano is also progressing with its Dijkstra upgrade work, while programmable tokens under CIP-113 have reached mainnet. These developments may improve the network’s capabilities, but their long-term value depends on whether they attract sustained users, transactions, and capital. Key figures: - Price: ~$0.206 - 24H change: approximately +1.2% - 24H range: $0.201–$0.208 - Market cap: ~$8.05B - 24H volume: ~$117M - Circulating supply: ~38.96B ADA - Maximum supply: 45B ADA - Distance from ATH: ~−93.3% Bullish confirmation: Holding $0.200–$0.202 and reclaiming $0.208–$0.212 with stronger spot volume could open the way toward $0.22. Bearish confirmation: Losing $0.200 decisively would weaken the current base and expose ADA to another downside test. What I’m watching is whether Cardano’s technical progress begins translating into real on-chain demand. Development milestones are encouraging, but ADA needs stronger spot buying and liquidity to turn this stabilization into a convincing recovery. Will ADA reclaim $0.212 first, or will sellers force another test of $0.20? $ADAUSDT #ByXIMPACT
#ByXIMPACT

Accurate
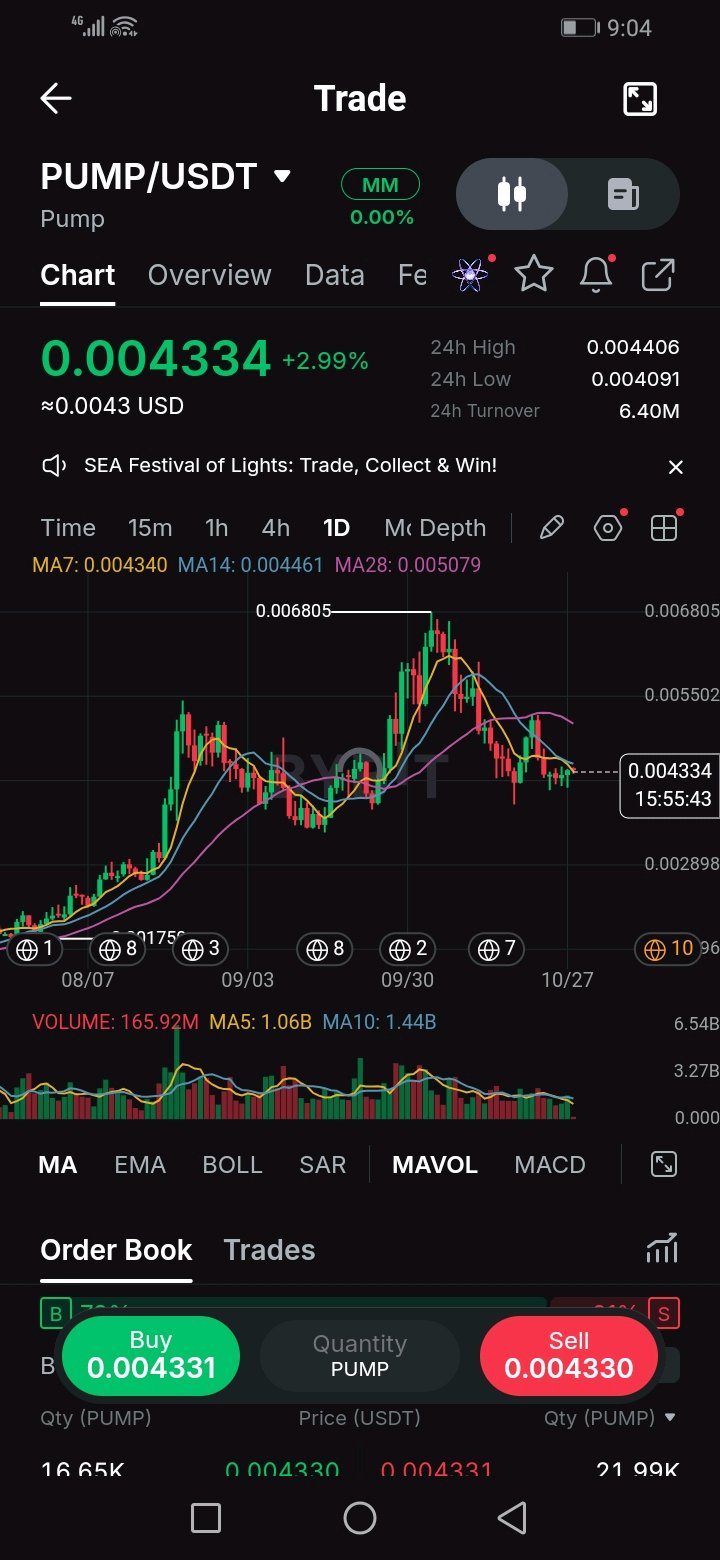
$PUMPUSDT has given back exactly half of its run from the 0.00175 base, and it's pinned to MA7. The staircase of higher lows is still intact, but only just. Context The structure since August is a staircase. The first leg topped near 0.0055 and pulled back to a higher low around 0.0030. The second leg printed 0.006805 and has been fading since. At 0.004334, price sits almost exactly on the 50% retracement of the whole move (about 0.004278). This is the point where a pullback inside an uptrend either gets bought or starts looking like a lower high. Turnover and volume 24h turnover is about 6.4M USDT. Both rallies came with heavy volume spikes, while the decline from 0.006805 has happened on steadily shrinking volume. Today's 166M is far below the 5-day average (1.06B) and 10-day (1.44B), but the candle is still open, so I'm not reading it yet. Fading volume on a pullback is normal. What I want is a daily close back above resistance with volume rising toward that 1B average. Without it, a bounce is just a bounce. Support and resistance Support: 0.00409 (24h low), 0.0040 (round number and the October low), 0.00368 (0.618), then 0.0030-0.0029 (the higher low and 0.786). Resistance: 0.00434-0.00446 (MA7, the 24h high and MA14, all stacked), 0.00487 (0.382), 0.00508 (MA28), then 0.0055 and 0.006805. Level to watch 0.0040 is the one. A daily close under it breaks the October low and puts the 0.618 in play. On the upside, a close above MA28 at 0.00508 reclaims every average and turns the story back to the trend. Trade plan Pullback: buy a hold of 0.0041-0.0043, stop under 0.00385 (about 0.00035 of risk from 0.0042). Targets are 0.00508 and 0.0055, roughly 2.5R and 3.7R. Breakout: wait for a daily close above 0.00508, buy the retest, stop under 0.0046, targets 0.0055 then 0.0068. Invalidation A daily close under 0.0039 cancels the pullback idea. The stairs only hold if price stays well above the 0.0030 higher low, and that is 30% away, so I'd step aside long before it matters. Risk note PUMP is a high-beta, narrative-driven token that can move 10% or more in a day, so keep size small and respect the stop. Fib levels are zones, not guarantees. Levels are read off my chart. Idea only, not financial advice. Does the half-way level hold, or does 0.0040 go? #ByXIMPACT
#ByXIMPACT

RAFIK_BANK
#WSOT2026 #Регистрационная форма S-1 компании Anthropic #Наблюдение за рынком в период промежуточных выборов #ФинансовыйПаспорт2026 #BybitStocks $SOLUSDT $DOGEUSDT $NEARUSDT
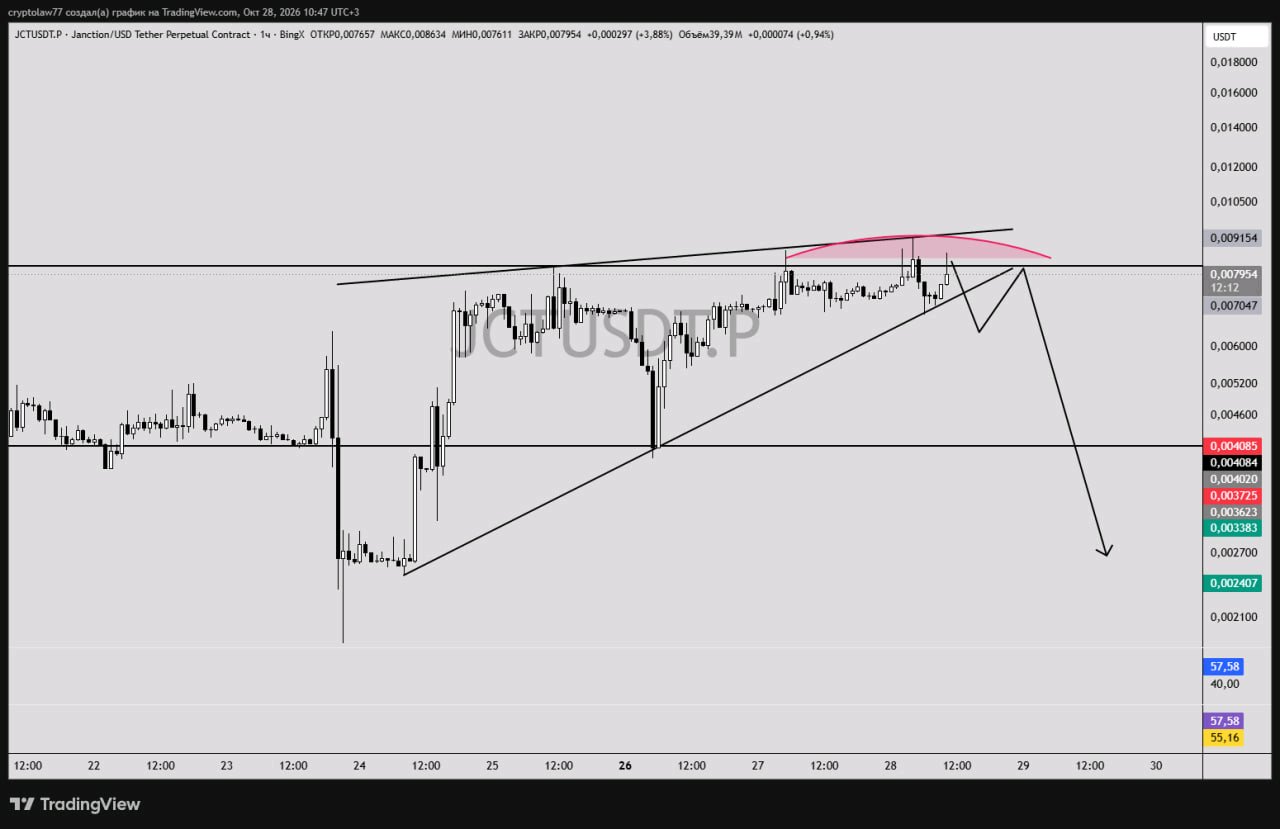
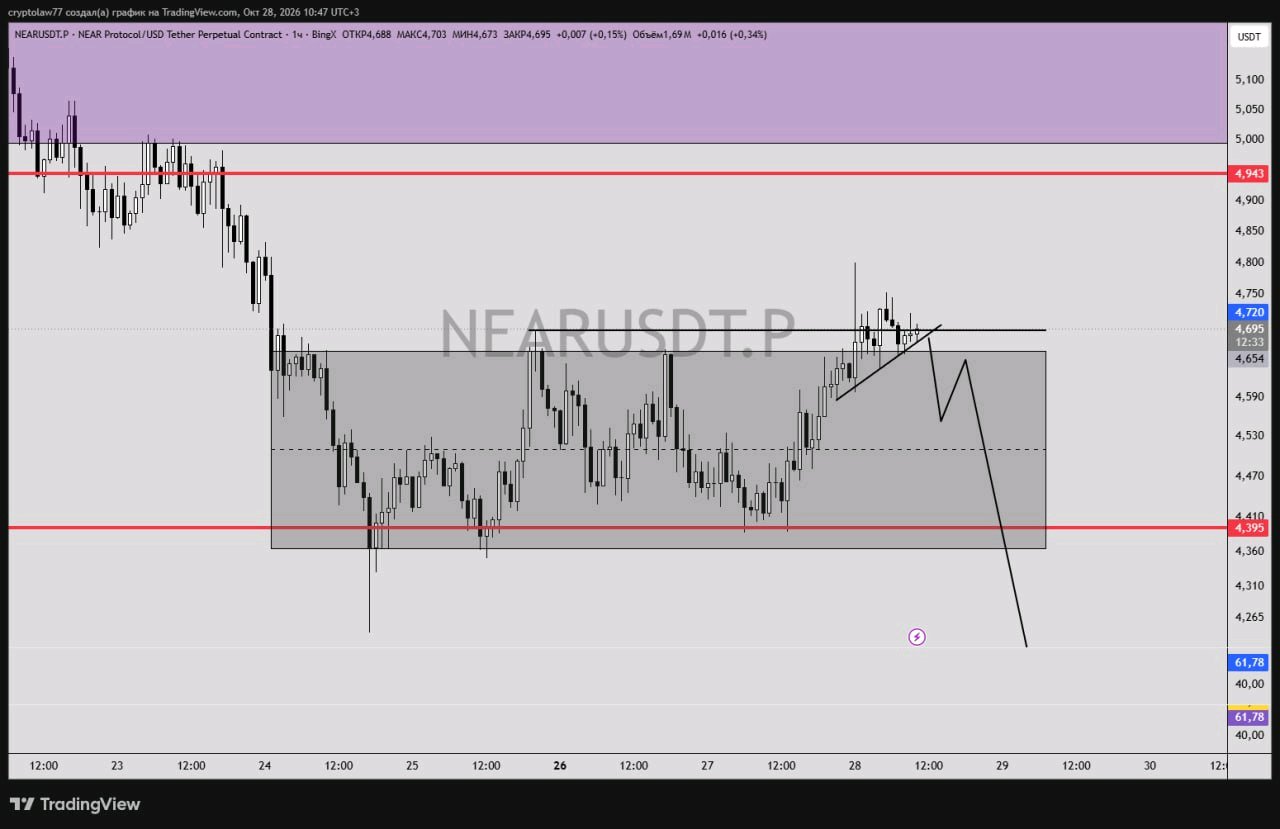
#WSOT2026#Регистрационная форма S-1 компании Anthropic#Наблюдение за рынком в период промежуточных выборов#ФинансовыйПаспорт2026#BybitStocks

OGAnalysis
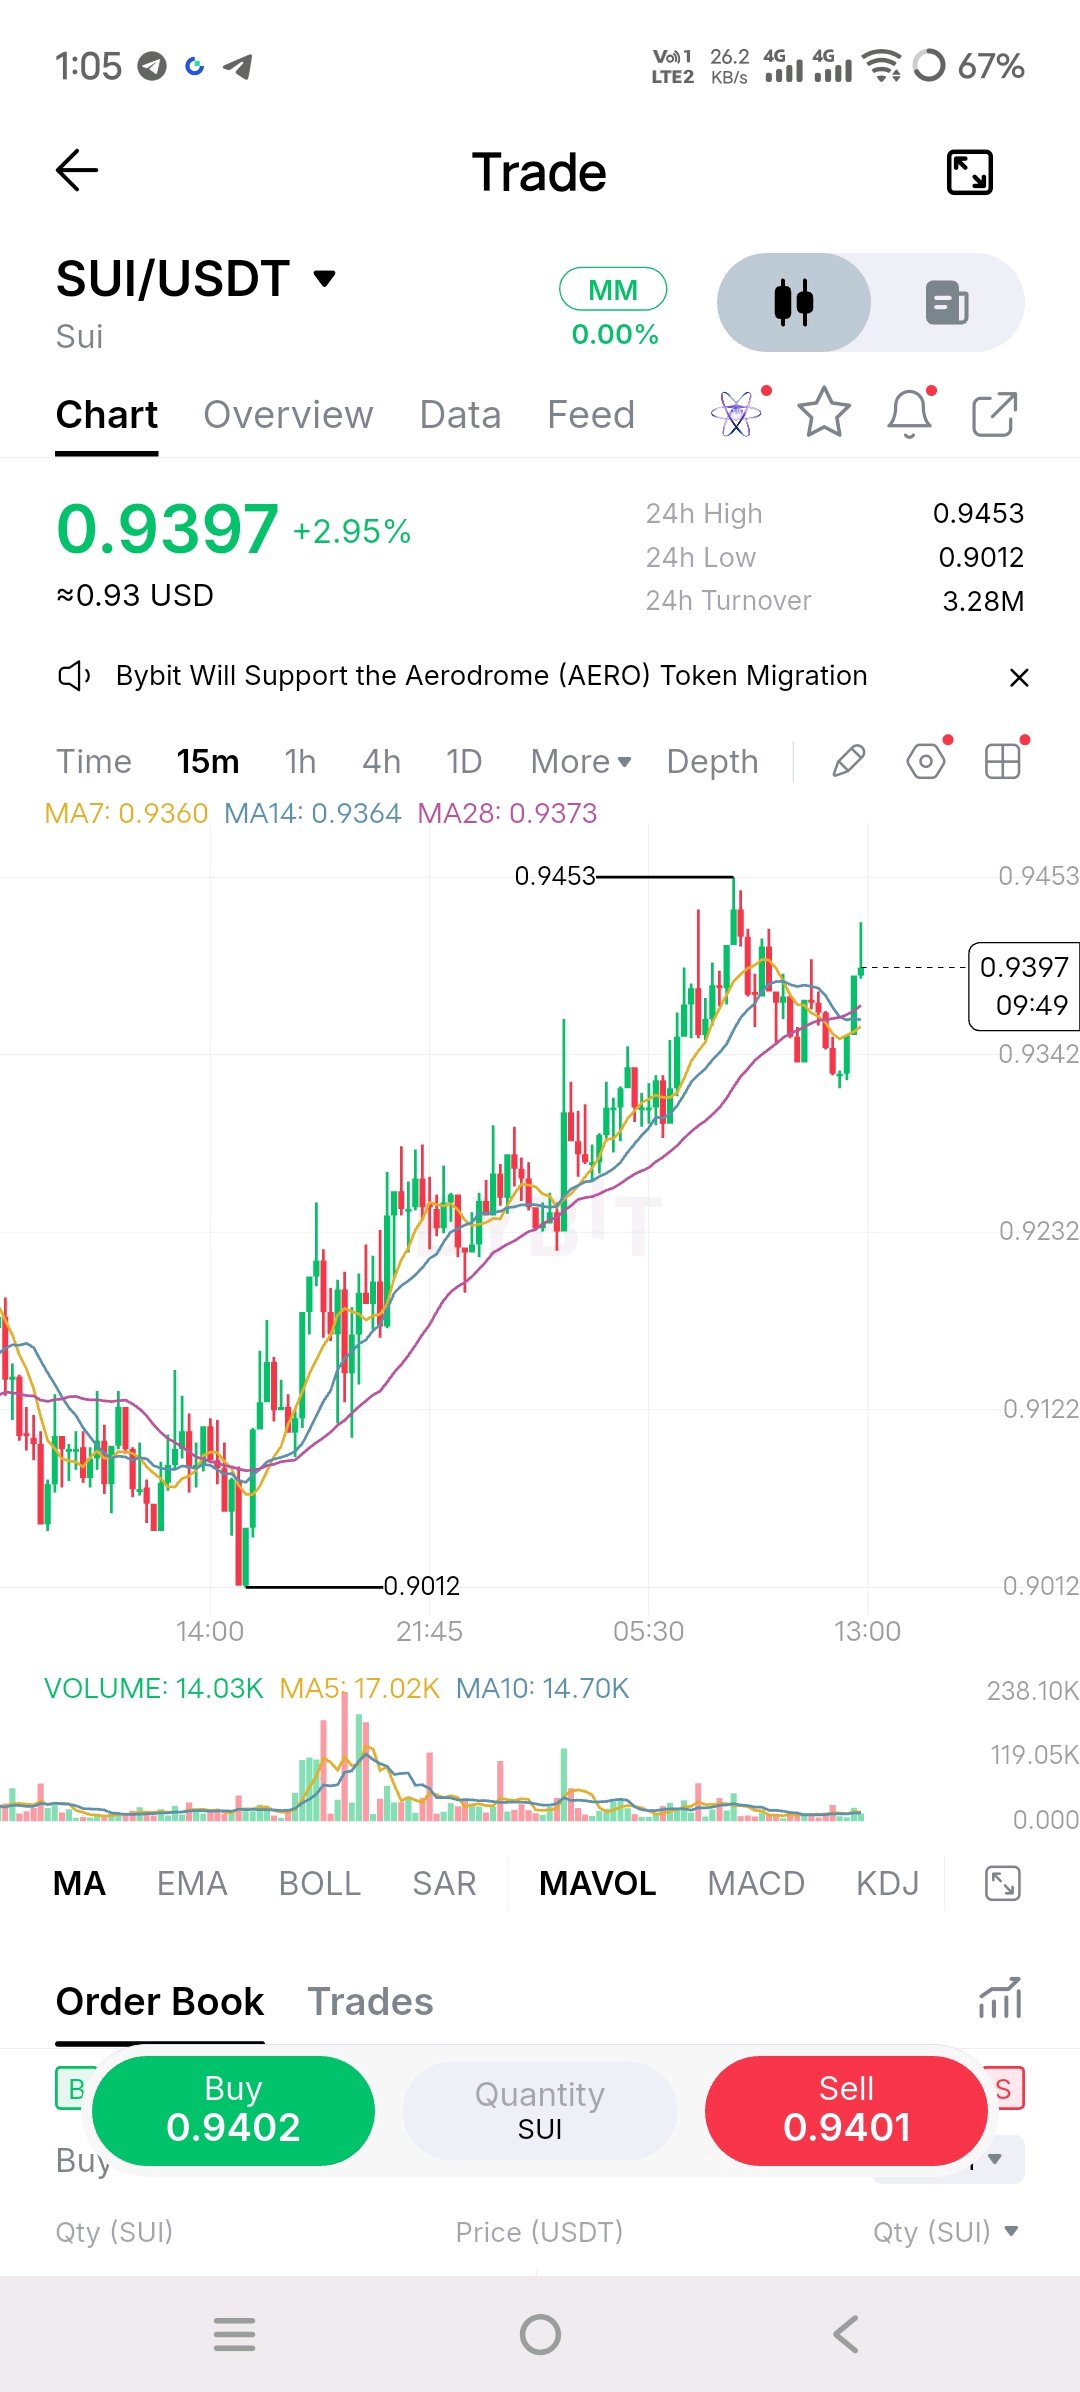
🚨 Trade Alert 📌 Asset: SUI/USDT 📈 Bias: Bullish Rebound 🎯 Entry: 0.9360 – 0.9400 🛑 Stop Loss: 0.9300 ✅ TP1: 0.9450 ✅ TP2: 0.9500 🚀 TP3: 0.9580 ⚠️ Risk: Medium-High 📊 Technical Outlook: On the 15-minute chart, SUI/USDT is trading around 0.9397, showing a strong recovery from the recent low of 0.9012. The market structure remains bullish, with higher highs and higher lows forming during the recent upward move. Price is trading above the MA7 (0.9360), MA14 (0.9364), and MA28 (0.9373), suggesting short-term bullish momentum. Buyers have stepped in following a recent pullback, pushing price back toward the key resistance zone at 0.9450–0.9453. Support is located around 0.9360–0.9340, with stronger support near 0.9300–0.9230. However, recent volume appears moderate rather than explosive, so a confirmed breakout above 0.9453 with increasing volume would strengthen the bullish case. Rejection at this resistance could trigger another short-term pullback. 💡 Trade Idea: Consider a long entry near 0.9360–0.9400 if support holds and bullish candles confirm buying pressure. Target 0.9450 first, followed by 0.9500 and 0.9580, while maintaining disciplined risk management; avoid chasing the price if resistance rejects the move. ⚠️ Disclaimer: This is not financial advice. Always manage your risk and use proper position sizing. $SUIUSDT #ByXIMPACT
#ByXIMPACT
CashCalling™
👀 CashCalling Watchlist An RWA portfolio isn't diversified simply because it contains different tickers. Examine the assets, borrowers and economic exposures underneath them. $ONDO #Trading
td0***@****
罗马结算了 稳稳拿下4.5% 翻了一下最近的足球比赛 没有一个能薅的了 只能攒分到周末用nba对冲一下

MIDAN
$QNTUSDT is trading around the $207 area after rebounding from the $173-$177 support zone, and I'm watching $214 closely. What caught my attention is the strength of this recovery despite weakness across parts of the broader crypto market. However, after such a sharp rally, the next challenge is proving that buyers can sustain momentum rather than allowing the move to fade into another correction. Quant's institutional adoption story remains a major catalyst. The Clearing House selected Quant to support its On-Chain Money Initiative, which aims to facilitate the movement and settlement of tokenized bank deposits. The network is targeting institutional access in the first half of 2027, giving the market a concrete milestone to watch. These developments strengthen Quant's long-term positioning in financial infrastructure, but there is an important distinction: institutional adoption of Quant's technology does not automatically guarantee sustained buying demand for QNT. The market still needs evidence that adoption, token utility and investor demand can reinforce one another. The price action adds another layer. QNT recently surged above $200 after recovering from its October lows, but the rally has encountered resistance around $214-$215. With a relatively limited circulating supply, buying pressure can produce sharp moves in either direction. That creates opportunity, but it also increases the risk of volatility if momentum weakens. **Key figures** $207 - Recent price area $214-$215 - Immediate resistance zone $200 - Key psychological support $173-$177 - Major downside support zone $251 - Potential upside resistance $373 - September swing-high area Bullish confirmation: QNT holds above $200, breaks $215 with stronger spot volume, and establishes the former resistance as support. That would improve the recovery structure and open the possibility of a move toward $230-$251. Bearish confirmation: QNT fails to break $214-$215 and loses $200. That would suggest the recovery is losing momentum and could bring $185-$190 into focus, with $173-$177 becoming important if selling pressure accelerates. I'm not treating the institutional narrative or the recent rally as an automatic buy signal. For QNT, the stronger setup comes when buyers defend support, spot volume confirms the breakout, and price action begins to validate the longer-term adoption story. #ByXIMPACT #AnthropicS1Filing #WSOT2026 $QNTUSDT

#ByXIMPACT#AnthropicS1Filing#WSOT2026

CryptoSatRed
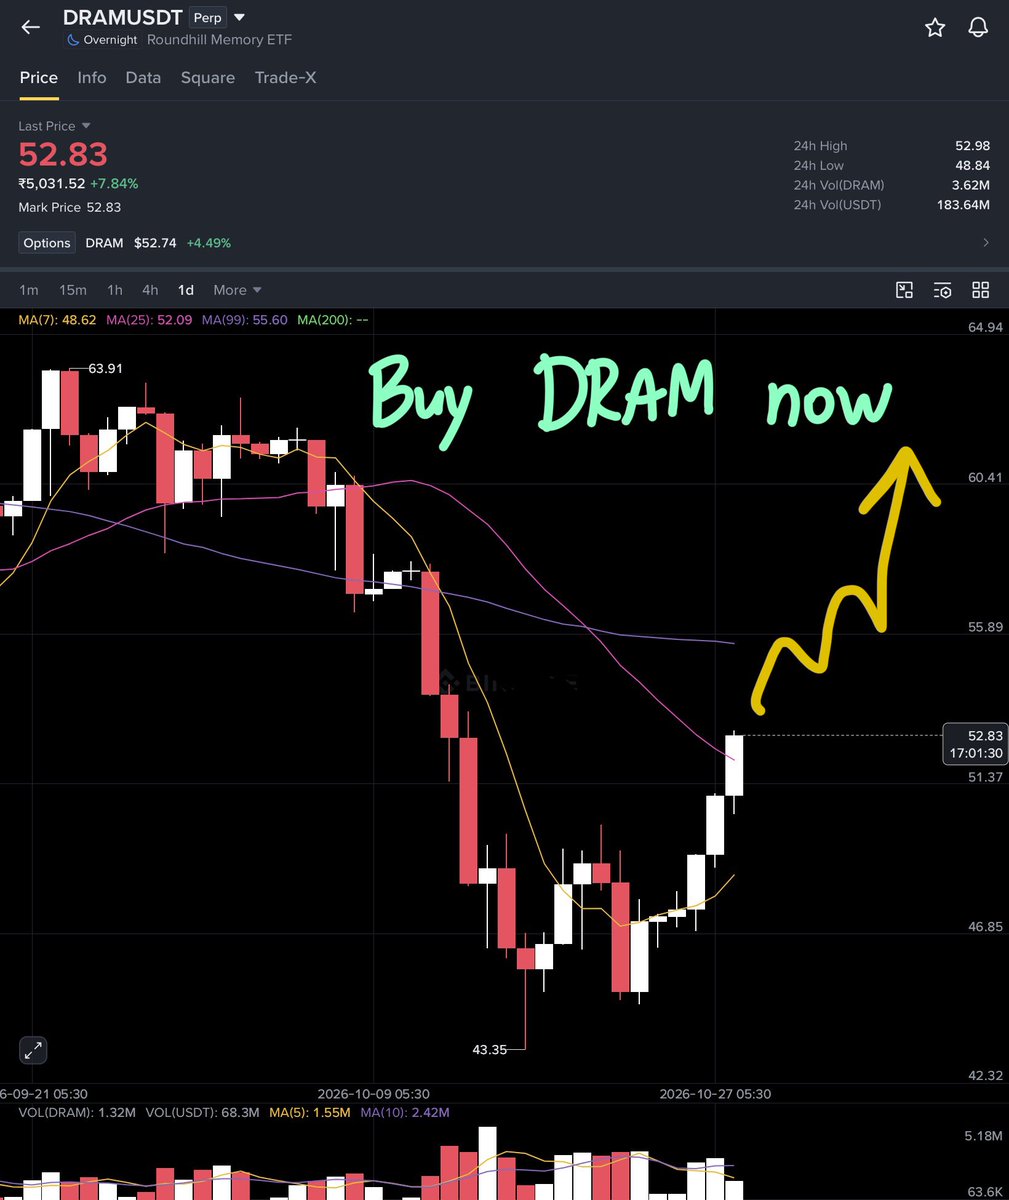
💰 $DRAM /USDT 🔼 LONG ✳️ ENTRY (Use DCA STRATEGY) : 52.52, 51.80 , 51 🎯 TARGETS - 55, 57, 60, 63 🀄️ LEVERAGE - cross 10x 🔴 STOPLOSS - 50 Price just broke out at MA25, We will see 55-60 for Damn Sure 😎

taiba
GRAM is bouncing toward $1.23 after a prolonged decline, but I’m watching whether buyers can reclaim $1.243 or whether this is just a relief rally inside a damaged trend. The key tension is that short-term buying pressure is returning while the broader daily structure remains bearish. GRAM recently traded near $1.23, up around 3% over 24 hours but down approximately 9% over seven days and 21.5% over 30 days. The 24-hour range is $1.19–$1.24, putting price close to the top of its daily range. That makes $1.243 the first recovery test, while $1.21 is immediate support. A clean break above resistance would improve the short-term picture, but the wider downtrend still needs to be addressed. The broader ecosystem story is tied to Telegram’s push toward integrated crypto access. A built-in self-custody wallet rollout could make transfers and blockchain applications easier to access for Telegram users. However, easier access does not automatically translate into sustained GRAM demand, and the market still needs measurable growth in active users, transactions and liquidity. Supply also deserves attention. GRAM’s original proof-of-work mining has ended, but the token’s supply picture is complicated by large early-mined allocations and the lack of a clearly established fixed maximum supply. That makes holder concentration and actual circulating supply more useful to monitor than headline scarcity claims. A future release from the Believers Fund has been reported for March 2027, but the exact schedule should be verified before treating it as a confirmed near-term catalyst. Derivatives show a cautious rebound rather than clear trend confirmation. Aggregate perpetual open interest is around $75M, up approximately 4.5% over 24 hours, while funding is positive near +0.0054% per eight hours. Futures volume is roughly $34M versus $9.9M in spot volume. Longs are paying shorts, and recent liquidations have disproportionately affected long positions. Rising open interest alongside a price bounce suggests fresh positioning is returning, but leveraged activity is still much larger than spot demand. Key figures $1.23 — Current price area $1.243 — Immediate resistance $1.21 — First support $1.19 — Recent 24H low $75M — Aggregate perpetual open interest $34M — 24H futures volume $9.9M — 24H spot volume +0.0054% — Funding per eight hours Bullish confirmation: Reclaim $1.243 and hold above it with stronger spot demand. That would put $1.278–$1.318 in focus. Bearish confirmation: Lose $1.21 and fail to recover it. That would expose $1.185, followed by $1.148. GRAM’s rebound is attracting fresh activity, but the wider trend remains weak and derivatives are leading spot turnover. The decisive signal is whether buyers can turn the $1.24 resistance into support—or whether leverage fades before real demand arrives. $GRAMUSDT #ByXIMPACT
#ByXIMPACT